
Policy Research for Front of Package Nutrition Labeling: Environmental Scan and Literature Review
Final Report
February 2011
Contract No. HHSP23320095651WC
Prepared for: Kathleen Koehler Department of Health and Human Services Office of Assistant Secretary for Planning and Evaluation Office of Science and Data Policy 200 Independence Avenue SW Washington, DC 20201
Prepared by: James E. Hersey, Kelly C. Wohlgenant, Katherine M. Kosa, Joanne E. Arsenault, and Mary K. Muth RTI International 3040 Cornwallis Road Research Triangle Park, NC 27709
This report is available on the Internet at:http://aspe.hhs.gov/sp/reports/2011/FOPNutritionLabelingLitRev/
Contents
1. Background and Purpose1.1 Introduction1.2 Study Objective1.3 Conceptual Framework1.4 Report Organization
2. Methods2.1 Literature Review2.2 Interviews with Experts
3. Identification of Issues3.1 The Public Health Perspective3.2 The Consumer Perspective3.3 The Producer and Retailer Perspective3.4 The International Experience3.4.1 Sweden3.4.2 United Kingdom3.4.3 The Netherlands3.4.4 Australia and New Zealand
4. Summary of Discussions with Experts4.1 Consumer Response to FOP Labeling4.2 Producer Response to FOP Labeling4.3 Retailer Response to FOP Labeling4.4 Public Health Issues Regarding FOP Labeling4.5 Criteria for Developing and Assessing FOP Systems
5. Literature Review Findings5.1 Studies of Consumer Response5.1.1 Attention and Processing5.1.2 Liking, Satisfaction, and Preferences5.1.3 Understanding5.1.4 Effects of Nutrition Labels on Likely Purchase Behavior5.1.5 Effects on Purchases and Consumption5.1.6 Effects of FOP Labels on Diverse Subpopulations5.2 Studies of Producer and Retailer Response5.2.1 Producer and Retailer Implementation Experience and Marketing5.2.2 Effects on Product Introduction and Reformulation5.2.3 Studies of Combined Consumer and Producer/Retailer Response
6. Discussion and Synthesis6.1 Description of Study and General Findings6.2 Data Limitations6.3 Primary Findings6.3.1 Effects on Attention and Processing6.3.2 Effects on Preference and Liking6.3.3 Effects on Understanding6.3.4 Effects on Diverse Consumer Populations6.3.5 Effects on Use, Purchase, and Consumption6.3.6 Effects on Producers and Retailers6.3.7 Combined Effects on Consumers, Producers, and Retailers6.4 Identification of Knowledge Gaps
Appendices
A: FOP Labels Search StrategyB: Discussion Guide for Expert InterviewsC: Summary of Evidence to Address Front-of-Pack Research Questions
Figures
1-1. Conceptual Framework for Producer, Retailer, and Consumer Response to FOP Nutrition Labels3-1. FOP Symbols Used Internationally5-1. Percentage of German Customers Selecting the Healthier Product5-2. Percentage of UK Consumers Selecting the Healthier Product5-3. Percentage of U.S. Consumers Choosing the Healthier Product5-4. Mean Sodium Content for Processed Meats Before and After Implementing the Choices Logo (mg/100 g)5-5. Mean Saturated Fatty Acid Content for Processed Meats Before and After Implementing the Choices Logo (g/100 g)5-6. Mean Caloric Content for Dairy Products Before and After Implementing Choices Logo (kcal/100 g)5-7. Percentage Change in Sales of Starred Foods After the Introduction of Guiding Stars in Hannaford's Supermarkets
Tables
2-1. Search Terms and Databases2-2. Summary of Identified Articles by Category2-3. Quality Criteria Used to Score Identified Articles2-4. Experts Interviewed5-1. FOP Symbols and Shelf-Tag Systems Discussed in This Report5-2. Effects of Consumer Response to FOP on Attention and Processing5-3. FOP Effects on Liking, Satisfaction, and Preferences5-4. Shelf-Labeling Effects on Consumer Response to Liking/Preferences5-5. FOP Effects on Identification of Healthier Foods5-6. FOP Effects on Use of Labels and Likely Food Purchase Behavior5-7. Shelf-Labeling Effects on Use of Labels and Likely Food Purchase Behavior5-8. FOP Effects on Purchases and Consumption5-9. Shelf Labeling Effects on Purchases and Consumption5-10. FOP Effects on Producers and Retailers: Implementation, Reformulation, and Sales5-11. Shelf-Labeling Effects on Producers and Retailers: Sales and Other Benefits6-1. Summary of Findings of Experimental Studies of Effects of Labels on Identifying Healthier Food Choices
EXECUTIVE SUMMARY
ES.1 Background and Purpose
Food manufacturers have recently been adding summary nutrition information on the front of packages in addition to the currently mandated back or side Nutrition Facts Panel (NFP). In addition, some supermarkets have added summary information or symbols on shelf labels where the information is more visible to consumers in the shopping aisle. The Department of Health and Human Services (DHHS), Office of Assistant Secretary for Planning and Evaluation (ASPE) and the Food and Drug Administration (FDA) want to ensure that front-of-package (FOP) and shelf-label nutrition systems that provide nutrition information or summarize the overall nutritional quality of a food are useful for the consumer and that the nutrition criteria are based on science.
RTI International conducted an environmental scan and literature review on consumer, producer, and retailer response to FOP nutrition labeling and shelf labeling and interviews with key experts on these issues. FOP nutrition labels and shelf tags have effects on consumer attention and processing, liking, understanding, use, and purchases. FOP nutrition labels and shelf tags also might influence sales of food products and stimulate producers and retailers to develop new products or reformulate existing products to improve their nutritional content.
Examples of FOP nutrition labels and shelf tags are shown in Figure ES-1. These symbols are classified into two main categories: nutrient-specific and summary systems. Nutrient-specific FOP symbols display a few key nutrients; examples of these symbols include the percentage guideline daily amounts (%GDA) and traffic light (TL). Summary systems use an algorithm to provide an overall nutritional score. Summary systems can be binary such as the Choices Programme logo, which is a single check mark that is present or absent on foods depending on whether the foods meet specified nutrient criteria, or graded such as the Guiding Stars system, which displays a ranking of one to three stars.
Figure ES-1. Examples of FOP Nutrition Labels and Shelf Tags
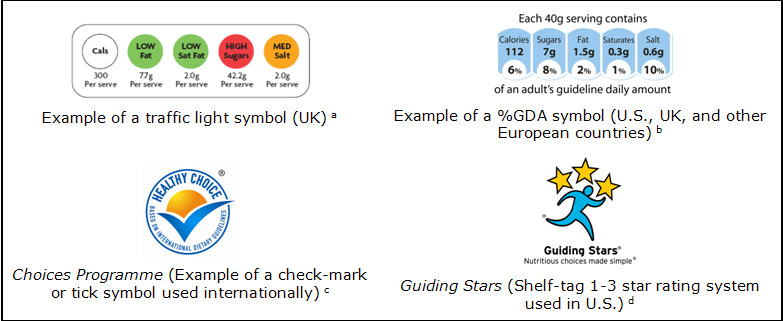
a Traffic light symbol reprinted with permission from the Food Standards Agency, UK.b %GDA symbol reprinted with permission from the Food and Drink Federation, UK.cChoices logo reprinted with permission from the Choices International Foundation, Belgium.dGuiding Stars shelf-tag symbol reprinted with permission from the Guiding Stars Licensing Company, U.S.
ES.2 Key Findings
Key findings based on the literature synthesis and as confirmed by the experts interviewed for the study are as follows:
- Consumers can more quickly process simple graphic FOP labels (e.g., labels displaying TL colors or graphic elements) than labels primarily displaying detailed numeric information (e.g., a monochrome %GDA).
- Consumers like and understand nutrient-specific FOP nutrition labels that incorporate TL color-coding more than nutrient-specific FOP labels that emphasize numeric information such as %GDAs or binary summary check-mark symbols. This is especially true for diverse subpopulations, including older adults, individuals with low socioeconomic status, or high body mass index (BMI).
- Text corresponding to TL color-coding that indicates "high," "medium," or "low" levels of negative nutrients appears to enhance consumer understanding of nutrition information.
- Nutrition-conscious consumers are more likely than less nutrition-conscious consumers, or consumers with low socioeconomic status or with high BMI to purchase healthier products as indicated by FOP nutrition labels or shelf tags.
- Effects of FOP labeling on consumers' purchase and consumption habits are unclear because of insufficient research and mixed results of existing research.
- Although less literature was available on producer and retailer response than consumer response, FOP nutrition labels and shelf tags appear to benefit food producers and retailers who implement these systems, because studies suggest that sales of products that are indicated as a "healthier choice" by FOP nutrition labels or shelf labels increase over time.
- FOP nutrition labels appear to stimulate food producers to develop healthier products.
Additional detail on consumer response to FOP nutrition and shelf labeling, FOP and shelf-labeling effects on producers and retailers, combined findings, and knowledge gaps on these topics are provided below. However, several knowledge gaps exist in the literature including limited studies conducted in the United States or lack of studies that compare a TL system against a more graded summary system, such as Guiding Stars.
ES.3 Consumer Response to FOP Nutrition Labels and Shelf Tags
This section reviews findings on consumer response to FOP nutrition labels and/or shelf labels in terms of attention and processing, liking, understanding and identification of healthier food choices, use and purchase or consumption, and effects on diverse subpopulations.
Attention and Processing
- To gain consumers' attention in the supermarket FOP labels should be positioned to stand out against potential "competing" elements on the food package that could distract consumers' attention. "Competing" elements can include any text, graphics, and/or color displayed on food packages by the producer for marketing purposes. One study found that FOP labels more quickly gained consumers' attention if they were large and consistently placed on the top right of food packages.
- Overall, consumers' processing time (e.g., time needed to understand nutrition information) was about 5.8% faster for products with FOP labels than for products without them.
- Simple FOP symbols that emphasize color-coding and graphic elements such as a TL symbol, a single check mark (e.g., Choices Programme logo), or a series of stars (e.g., the Guiding Stars system) more quickly capture consumers' attention than a monochrome symbol displaying the percentage of daily reference intake amounts for specific nutrients (e.g., %GDA). There were limited studies that compared consumers' processing time using different types of "simple" FOP symbols, so it is unknown whether some of these symbols may be easier to process than others.
- Results from one eye-tracking study suggested that an FOP label can perhaps direct consumers' attention to a more detailed nutrition label such as the Nutrition Facts Panel (NFP).
Liking and Satisfaction
- In general, based on studies conducted in the UK and Korea, consumers have favorable opinions regarding FOP nutrition labels, believing that they are helpful in making healthy food selections at the supermarket. However, participants in a focus group study admitted that they may not use FOP symbols in all situations because other factors such as price may sometimes take precedence over nutrition.
- Consumers like simplified nutrition labels they perceive are visually appealing, credible, trustworthy and/or easy to understand quickly.
- Regarding specific labeling schemes liked by consumers, consumers say they prefer nutrient-specific labels that indicate levels of nutrients using TL color-coding such as TL symbols or colored GDAs (e.g., %GDA label with TL colors) as opposed to monochrome GDA schemes or check-mark symbols. It should be noted that only one study compared consumers' preferences for a TL scheme to a continuous or graded summary concept such as stars (e.g., the Guiding Stars system) to find that consumers preferred the TL symbol.
- Based on the results of one study, consumer preferences for specific FOP labeling schemes may be influenced by the complexity of the task: the more complex the task (e.g., the more products' nutrition information being compared) the more likely consumers preferred simple labels, meaning labels incorporating simple graphic elements (e.g., stars) as opposed to %GDA information.
- Consumers with lower income, education or who are less health-conscious tended to have a stronger preference for FOP labels with TL color-coding or graphics compared with other groups.
- A study of shelf labels found that many consumers prefer a labeling system to be displayed on both a shelf label and the food package.
Understanding
- In most studies that included a no-label condition, consumers were more likely to identify healthier foods in response to a product package with an FOP nutrition label system than to a product package without an FOP nutrition label.
- Most experimental studies that compared FOP labels incorporating TL color-coding, such as TLs or colored %GDAs, to less interpretive nutrient-specific systems, such as the GDA or Percent Daily Intake (%DI), found that consumers could more easily identify healthier foods using an FOP label incorporating TL color-coding. The magnitude of differences in consumer understanding between labels with TL colors and less interpretive nutrient-specific FOP labels were in the range of 10 to 20%.
- Most experimental studies comparing nutrient-specific TL schemes to binary summary FOP schemes found that consumers were better able to identify a healthier food choice in response to a TL nutrition label compared with check-mark or tick symbols. However, it should be noted that few studies compared a TL label system with a more continuous or graded summary rating system such as multiple stars.
- Studies also suggested that schemes incorporating TL colors are easier to understand among consumers who were older or of lower socioeconomic status.
- When considering individual design components of FOP nutrition labels, consumers were most frequently able to identify a healthier food choice when exposed to FOP labels that included TL color-coding and corresponding text indicating "high," "medium," and "low" levels of nutrients. For example, one study investigated exposing study participants to numerous schemes with different combinations TLs, GDA, and text to find that labels incorporating text were the easiest to interpret by study participants. However, TL colors in addition to text further increased performance by about 15%.
Effects on Use, Purchase, and Consumption
- Use of FOP nutrition labels is most common among consumers who are health conscious, of normal weight, and higher in socioeconomic status.
- Some evidence suggests that consumers have a greater preference for foods displaying FOP nutrition labels or shelf-labeling systems and are willing to pay more for these foods. However, studies of effects of FOP nutrition labels on consumers' actual purchase behavior and consumption habits were limited and show mixed results.
- One UK study found that consumers' reported use of FOP nutrition labels was higher than their observed use of FOP labels.
Effects on Diverse Subpopulations
- Older adults, less-educated consumers, and consumers with higher BMI liked FOP nutrition labels that contained simple graphic elements or color-coding, such as a check-mark logo and the TL label.
- Older adults, consumers with low socioeconomic status, and nonwhite consumers generally had more difficulty understanding FOP labels than other groups.
- For consumers of low socioeconomic status and high BMI, TL nutrition labels proved to be the easiest FOP nutrition label to understand compared with %GDA labels. Text indicating "high," "medium," or "low" levels of nutrients is also an important FOP label feature, in particular, for color-blind consumers.
ES.4 Effects on Producers and Retailers
Producer and retailer response to FOP nutrition and shelf-labels can be assessed based on their implementation and marketing experiences and the effects of FOP and shelf labeling systems on product reformulation or new product development.
Implementation and Marketing
- Although limited studies are available on producer and retailer implementation and marketing of FOP nutrition and shelf tags, results suggest that summary FOP systems are beneficial to producers and retailers. Two marketing studies found that consumers, particularly those who are health conscious, reported preferring to shop at stores with summary FOP systems. Another study found that summary systems can provide private label products with increased brand equity (e.g., increased value).
- A UK study conducted after a voluntary call for FOP labeling found that producers are implementing FOP labeling schemes that they believe are less expensive to implement or confusing to consumers.
Reformulation and Development of Healthier Food Products
- Although the number of studies is limited, analysis of products before and after implementing FOP labeling suggests that the introduction of FOP labeling has led producers to reformulate products and formulate new food products that have healthier nutrient content. For instance, in the Netherlands, these changes have had considerable effects in prompting the introduction of products that are lower in sodium and saturated fats. In Australia and New Zealand, new or reformulated products have been introduced that are substantially lower in sodium.
ES.5 Combined Effects on Consumers, Producers, and Retailers
Combined effects of consumer, producer, and retailer response to FOP nutrition labels and shelf-labels are as follows:
- Most empirical studies suggest that food products indicated as "healthy" by FOP nutrition schemes or shelf labels will likely increase product sales, implying that producers implementing these systems will likely profit. While a modest increase of 1 to 2% was found for the Guiding Stars program, this program also found that the effects were greater after 2 years than after one, suggesting that effects on sales could increase over time.
ES.6 Knowledge Gaps
A number of research questions need to be investigated to help address important knowledge gaps. These questions include the following:
- What type of FOP labeling would work best in the United States? Most of the studies on FOP labeling have been conducted in Europe, Australia, and New Zealand. Moreover, the United States has a more diverse population and less vertical integration of producers and retailers than many of those countries.
Also, although a number of studies have compared TL systems with %GDA systems or against a single summary check or tick, relatively little has been done to compare a TL system against a more graded summary system, such as a set of stars.
- What type of FOP nutrition labeling best serves the needs of diverse consumer populations? Studies in Europe and Australia suggest that less-educated consumers and older consumers do a better job of identifying healthy food choices when presented with simpler labels (e.g., TL) rather than more complex formats (such as %GDA). It will be important to assess the effects of alternative FOP labeling systems on the range of consumer populations in this country, including those who are lower in health literacy, those who have children at home, older audiences, consumers of different racial/ethnic and cultural backgrounds, and individuals with disease risks such as obesity or chronic conditions such as hypertension or diabetes.
- What are the interrelationships between the Nutrition Facts Panel and FOP labels in the U.S. market? Little information about the interrelationship between the mandatory Nutrition Facts Panel and FOP symbols is another limitation, especially for understanding the efficacy of FOP labels in the U.S. market.
- What is the influence of competing nutrition claims on the effects of FOP nutrition labeling? An important gap in the research is limited information about the effects of other contextual information, such as nutritional claims provided by food manufacturers on the fronts of packages.
- What is the effect of FOP nutrition labels on influencing consumers to purchase or consume products? There is little evidence on the likelihood or existence of substitution effects, that is, whether and how much consumers consume/purchase products displaying an FOP symbol, particularly a summary type of symbol or a multiple TL symbol with a lot of green lights and whether this might lead to over-consumption of products perceived as healthy.
- What would minimize possible consumer confusion with multiple FOP label systems? One study found that 73% of UK consumers thought it would be confusing if producers used different types of FOP nutrition labels. It will be important to understand what requirements or guidelines could reduce possible confusion of multiple FOP labeling systems and nutrition claims in the United States.
- What are the effects of FOP nutrition labeling on use and purchase? Most research studies we identified were laboratory or Web-based experimental studies; we found limited studies on the effects of FOP labels in actual shopping situations.
- What consumer education best supports appropriate use of FOP labels? It will be important to better understand the effects of broader social marketing, in-store promotions, and consumer education to encourage the understanding and use of FOP labels.
- What are the effects of FOP labels on new product development and reformulation? From a public health perspective, one of the greatest benefits of FOP labels is that they will likely motivate the development and reformulation of products to better satisfy nutritional criteria. It would be useful to develop a monitoring system that would enable the assessment of possible changes in the nutritional content of foods that are sold in response to implementing FOP nutrition labels.
1. BACKGROUND AND PURPOSE
1.1 Introduction
Food manufacturers have recently been adding summary nutrition information on the front of packages in addition to the currently mandated back or side Nutrition Facts Panel (NFP). In addition, some supermarkets have added summary information or symbols on shelf labels where the information is more visible to consumers in the shopping aisle. There is interest in ensuring that multiple front of package (FOP) labeling schemes do not cause confusion among consumers; a uniform system based on current science may be optimal.
The Department of Health and Human Services (DHHS), Office of Assistant Secretary for Planning and Evaluation (ASPE) and the Food and Drug Administration (FDA) want to ensure that FOP and shelf-label nutrition systems that provide nutrition information or summarize the overall nutritional quality of a food are useful for the consumer and that the nutrition criteria are based on science.
In August 2010, ASPE contracted with RTI International to conduct a two-part project on FOP nutrition labeling. The first part is an environmental scan that includes a literature search of published and unpublished literature relating to the responses of consumers, producers, and retailers on FOP nutrition labeling and shelf labeling and interviews with key experts on these issues. The second part is an evaluation of nutrient criteria underlying summary FOP systems and the development of a summary system. This report describes the results of Part 1 of the project.
For the literature review, RTI reviewed articles published from 1990 to the present in the United States and other countries, while considering differences in labeling regulations in other countries for the interpretation and applicability of these studies. The time period of the search was publications dated 1990 to the present. Our search uncovered a number of review articles and editorials that describe "issues" to be considered regarding nutrition FOP and shelf labeling as well as academic journal articles reporting empirical consumer and producer response studies. For the discussions with experts, RTI conducted interviews with seven experts in nutrition, consumer behavior, and marketing to obtain their views on key issues related to consumer, producer, and retailer response to FOP.
1.2 Study Objective
The objective of this task was to conduct an environmental scan, including a systematic literature review on consumer, producer, and retailer response to FOP nutrition labeling, and interviews with key experts on these issues.
1.3 Conceptual Framework
The synthesis of our literature review was organized based on the conceptual framework in Figure 1-1, adopted from a framework presented by Grunert and Wills (2007). Results of the studies are organized by concept, including consumer response, ranging from search and perception to comprehension and use, and retailer/producer response, ranging from effects on product introduction to reformulation. The interview guide was also influenced by this conceptual framework.
Figure 1-1. Conceptual Framework for Producer, Retailer, and Consumer Response to FOP Nutrition Labels
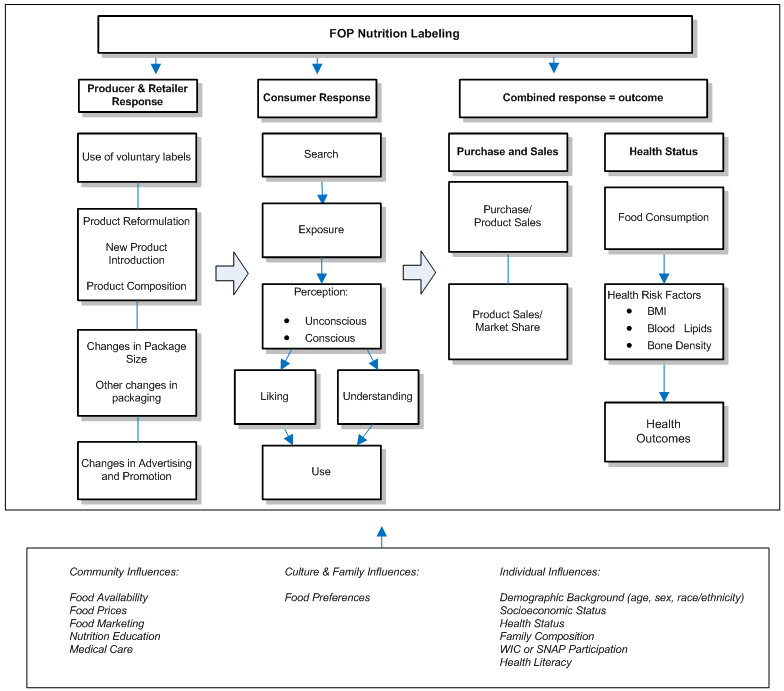
This report explains our methods in conducting a systematic literature review and expert interviews and presents our findings. The literature review uncovered many articles discussing issues related to FOP labeling, which are discussed in Section 3 followed by the results of the expert interviews in Section 4. Findings from the articles reviewed that reflect the Grunert and Wills (2007) conceptual framework are presented and discussed in Section 5, Literature Review Findings. The information learned from the review is synthesized in Section 6.
2. METHODS
This section describes the methods employed in conducting a systematic literature review and in conducting interviews with experts on FOP nutrition labeling.
2.1 Literature Review
We conducted a systematic search to obtain empirical studies and grey literature regarding the topics of FOP nutrition and shelf labeling. The search was conducted from August 31 to September 10, 2010, and the time period specified in searches was for publications dated 1990 to the present. The following databases were searched twice using different sets of key words: PubMed, Web of Science, ScienceDirect, CHINAHL, Business Source Corporate, PsycINFO, AGRICOLA, and Food Science and Technology Abstracts. Table 2-1 provides a list of the search terms used by database. After reviewing the abstracts retrieved in these searches it was determined that the second set of search terms did not provide additional literature that was relevant to the topic studied. Therefore, only the first set of terms was used when searching additional databases, which included New York Academy of Medicine Grey literature Report, NTIS, AgEcon, and CAB Abstracts (Appendix A details the strategy for each search conducted by database).
| Set | Search Terms |
| 1 | ("front of package nutrition label" or "FOP label" or "front of package label" or "shelf-labeling") and: ("Consumer" or "Consumer response" or "effective" or "design" or "nutrition" or "producer" or "retailer") Years included: 1990 present Language: English Databases searched: PubMed, Web of Science, ScienceDirect, CHINAHL, Business Source Corporate, PsycINFO, AGRICOLA, Food Science and Technology Abstracts, New York Academy of Medicine Grey literature Report, NTIS, AgEcon, and CAB Abstracts |
| 2 | ("front of package nutrition icon" or "front of package nutrition logo" or "front of package labeling scheme" or "Signposting" or "Principle Display Panel") and ("Consumer" or "Consumer response" or "effective" or "design" or "nutrition" or "producer" or "retailer") Years included: 1990 present Language: English Databases searched: PubMed, Web of Science, ScienceDirect, CHINAHL, Business Source Corporate, PsycINFO, AGRICOLA, Food Science and Technology Abstracts |
Results of the searches were saved in EndNote and duplicate articles were removed. We also entered into EndNote the bibliographies and abstracts of literature obtained during the proposal writing and references provided by ASPE after the kick-off meeting.
We initially identified a total of 190 articles in our searches. Two researchers independently reviewed each abstract. In situations where an abstract could not be obtained and the article title was relevant to the topic studied, we retrieved the article to determine whether it was relevant. We initially deemed 106 articles to be potentially relevant and retrieved them. Articles not retrieved for review discussed related but not directly relevant topics such as organic versus nonorganic food package labeling, country-of-origin labeling, and restaurant nutrition labeling.
To supplement our database searches and to retrieve additional grey literature, we also reviewed DHHS, FDA's Front-of-Pack and Shelf Tag Nutrition Symbols docket solicitation (DHHS, FDA, 2010). Additional articles identified by the experts we interviewed or identified in references to the documents our searches identified were also included, as were five additional articles and letters of response to the docket solicitation in the fall of 2010. In total, we identified 197 articles and documents, which after review for relevance by two independent researchers, yielded 111 articles that were reviewed for this report. Table 2-2 shows the identified articles by category and their corresponding counts.
| Category | Count |
| a Fourteen of the 69 studies were review articles. | |
| Total articles identified in initial searches | 190 |
| Articles identified from experts interviewed | 5 |
| Letters of response to docket identified after memorandum report | 2 |
| Total Identified | 197 |
| Nonrelevant articles (e.g., labeling of point of origin; organic/nonorganic) | 84 |
| Articles reviewed | 111 |
| Commentary/review articles | 69a |
| Empirical studies | 42 |
| FOP articles on consumer response: | 28 |
| Focus groups and in-depth interview studies | 4 |
| Nonexperimental studies (e.g., surveys) | 12 |
| Experimental studies | 12 |
| FOP articles on producer/retailer response | 4 |
| Shelf-labeling articles | 8 |
| Responses to docket solicitations on consumer/producer response | 2 |
We created evidence tables from empirical experimental and nonexperimental studies we identified in journal articles and in the grey literature. Two researchers independently reviewed these studies to abstract important information regarding the study design (including FOP labels used), sample population, and outcome measures. We assessed and compared the quality of studies on a 1 (lowest) to 5 (highest) scale using the criteria in Table 2-3. Studies that were scored and are presented in evidence tables provided empirical quantitative data. Other relevant studies using only qualitative methods or studies found in commentary and review articles with limited information on research methods are discussed in Section 5 but were not included in the evidence tables. Studies in the evidence tables are sorted by date (earliest to latest) and author's last name alphabetized. Higher scoring studies received greater emphasis in the Section 5 and 6 discussions.
| Quality Criterion | Score |
| 1. Comparison or control group | 1 = yes, 0 = no |
| 2a. Randomization: Randomized assignment of intervention and controls | 0.5 = yes, 0 = no |
| 2b. Randomization: Probability-based selection of sample | 0.5 = yes, 0 = no |
| 3. Adequate sample size (i.e., 30+ per group) | 1 = yes, 0 = no |
| 4. Statistical control for confounding factors | 1 = yes, 0 = no |
| 5a. Clear description of the stimulus/or intervention and control condition | 1 = yes, 0 = no |
| 5b. Peer review status | Subtract 0.5 point if the study had not gone through peer review |
Many of the experimental studies of consumer response involved posttest-only comparisons reported in terms of means and statistical significance (some, but not all, of these studies report the standard deviations). One challenge is that the means are often based on Likert-type rating scales. This makes it difficult to compare findings across studies in a way that clearly communicates the magnitude of effects.
2.2 Interviews with Experts
RTI initially compiled a list of 15 potential experts for discussions on FOP labeling, incorporating suggestions of experts from ASPE and FDA. RTI selected experts from nutrition and public health, industry, consumer behavior and advocacy, marketing, and economics. We assigned a priority level to each expert for scheduling purposes. Questions for the discussions were developed based on the framework for the scan on consumer, producer, and retailer responses to FOP labeling (Appendix B). The questions pertained to the experts' opinions on key issues for consumers, producers, and retailers with respect to FOP and shelf labeling. A draft of discussion questions was reviewed and approved by ASPE and FDA. We selected seven experts and conducted 30- to 60-minute interviews via telephone. One of the experts, Dr. Wills, invited a colleague (Dr. Storcksdieck) to join the interview. The experts interviewed are listed in Table 2-4.
| Name | Country | Area of Expertise | Association with an FOP System |
| NA = Not applicable. | |||
| Scot Burton | USA | Marketing | NA |
| Klaus Grunert | Denmark | Consumer behavior | NA |
| Janet Hoek | New Zealand | Marketing | NA |
| David Katz | USA | Nutrition/public health | NuVal |
| Jaap Seidell | Netherlands | Nutrition/public health | Choices Programme |
| Lisa Sutherland | USA | Consumer behavior/industry | Kellogg's (formerly with Guiding Stars) |
| Josephine Wills and Stefan Storcksdieck | Belgium | Consumer behavior/advocacy/policy | NA |
3. IDENTIFICATION OF ISSUES
This section reviews the issues regarding FOP nutrition labels identified in our review of the literature and our discussions with experts. We organize these issues in terms of issues from the public health perspective, the consumer perspective, and the producer and retailer perspective. Then to provide a fuller context for this report, we briefly describe the experience of other countries in implementing FOP nutrition labeling systems.
3.1 The Public Health Perspective
According to the Centers for Disease Control and Prevention (CDC), 68% of American adults are overweight or obese (Flegal, Carroll, Ogden, & Curtin, 2010). Obesity rates have tripled in children since 1980, and currently, 32% of children aged 2 to 19 years old are overweight or obese (at or above the 85th percentile of BMI for age) (Ogden, Carroll, Curtin, Lamb, & Flegal, 2010). Obesity increases the risk of chronic diseases, including coronary heart disease, stroke, certain forms of cancer, and type 2 diabetes. It is estimated that obesity accounts for 10% of all medical spending and $147 billion per year (Finkelstein, Trogdon, Cohen, & Dietz, 2009).
To help reduce the incidence and prevalence of morbidity and mortality associated with obesity and chronic diseases, the Dietary Guidelines for Americans 2005 recommends Americans reduce their overall caloric intake and limit their intake of saturated and trans fatty acids, cholesterol, added sugars, salt, and alcohol, which are the nutrients associated with higher risks of chronic diseases (DHHS & USDA, 2005). Several studies have shown that following this recommended diet could save lives. For example, one study estimated that adopting desirable dietary behaviors could reduce rates of mortality from any cause in women and men aged 45 years or older by approximately 9 to 16%, respectively (Kant, Graubard, & Schatzkin, 2004). In addition, the National Heart, Lung, and Blood Institute estimated that reducing sodium levels in processed and restaurant foods by 50% could save 150,000 lives per year (Havas, Roccella, & Lenfant, 2004). Excess consumption of sodium leads to increased risk of hypertension, which is associated with increased rates of heart disease, stroke, and kidney disease. Since processed foods are a significant source of sodium in the U.S. diet, it is particularly important that information on sodium levels be readily available on product packages. It has also been found that disclosing the number of grams of trans fatty acids per serving on the NFP could prevent from 600 to 1,200 cases of coronary heart disease and prevent from 240 to 480 deaths annually (DHHS, FDA, 2003).
As the obesity epidemic suggests, an alarming number of consumers struggle to make informed and healthy food choices. Improved food labeling could help consumers construct healthier diets and reduce their risks of chronic diseases. To combat obesity and overweight, the Institute of Medicine (IOM) recently concluded that FOP labeling should display calorie information and serving sizes in familiar household measures and highlight saturated and trans fatty acids and sodium (IOM, 2010). According to IOM (2010), such an FOP labeling scheme could help consumers make healthier choices and encourage food manufacturers to reformulate less healthy products.
3.2 The Consumer Perspective
In an extensive review of consumer food labeling research, Grunert and Wills (2007) concluded that consumers are generally aware of the overall link between food and health and are interested in receiving nutrition information on food packages. Approximately one-half of U.S. consumers report using the labels that list ingredients and nutrition information on food packages when buying a product for the first time according to the 2008 Health and Diet Survey conducted by FDA (Choinière & Lando, 2010). Other estimates may be lower than this; for example, in a six-country European survey, only 16.8% of consumers reported looking for nutrition information when they shopped (Grunert, Fernández-Celemín, Wills, Storcksdieck genannt Bonsmann, & Nureeva, 2010). Nonetheless, other studies have found that using nutrition labels can contribute to healthier consumption. Hersey et al. (2001) found that low-income shoppers who reported that they "always or almost always read the nutrition label" consumed less fat than those who did not read the NFP. Many studies, however, have also shown that some consumers, particularly older adults and consumers with lower levels of education and income, have difficulties using or interpreting food labels accurately, mainly because of the complexity of information and/or the associated quantitative tasks involved. According to Levy and Fein (1998), the majority of consumers do better making comparisons of products with high low ratings than numerical scores. Levy and Fein (1998) and other researchers (Grunert & Wills, 2007; Wansink, 2003; Williams, 2005) also found that consumers prefer short FOP labels to back-of-package labels (i.e., the NFP). Hence, a simplified FOP label that summarizes key nutrition information could reduce confusion and help consumers choose healthier products in less time and with less nutritional or mathematical knowledge (Möser, Hoefkens, Van Camp, & Verbeke, 2010).
Relatively little research exists on the impact FOP labels have on reported and actual food purchasing and dietary behaviors (Smith, Stephen, Dombrow, & Macquarrie, 2002). Most research concerning FOP labels has occurred outside the United States but likely provides some valuable lessons for what may be most helpful for American consumers. In the United Kingdom (UK) and other European Union (EU) countries, consumers like FOP labels and see them as a useful supplement to current food labels (Grunert & Wills, 2007; Navigator, 2007). Currently, there is no clear consensus among consumers on the preferred FOP labeling scheme, most likely because consumers look for different things on labels and have different priorities (e.g., price vs. nutrition) (Grunert & Wills, 2007). However, some research found that consumers use and understand the traffic light (TL) FOP labeling system, in use in the EU countries, which uses red, amber, and green color codes to indicate whether nutrient amounts are "high," "medium," or "low," better than other FOP labeling schemes (Grunert & Wills, 2007). Research also indicates the Guideline Daily Amounts (GDA) FOP label, employed in the UK and New Zealand, which uses the percent daily value amounts similar to those used in the NFP, is mostly used and understood by a select fewthose who already use food labels and/or those who want more detailed nutrition information (Gorton, 2007).
3.3 The Producer and Retailer Perspective
Nutrition labels and food packaging are the interface between food manufacturers and consumers (Gorton, 2007). According to an interview with Dr. Lisa Sutherland of Kellogg's, FOP labels are traditionally part of a food manufacturer's marketing scheme, a way for food manufacturers to differentiate and sell their products. In their response to Docket No. FDA-2010-N-0210, Mars, Inc. (U.S.) stated, "numerous food manufacturers have voluntarily implemented GDA FOP labels on their products because they are [an] effective tool to communicate nutrition information to consumers at the point of purchase. Compared with other FOP labeling schemes, GDA FOP labels are preferred [by food manufacturers] because they are easy to use, are effective, and are already widely adopted in the food industry globally" (Mars, Inc., 2010).
In the UK, 90 members of the food industry, including 83 food manufacturers, have introduced GDA FOP labels on over 20,000 food product lines, or 50% of all UK retail food and beverage packages (http://www.gdalabel.org.uk). Food manufacturers' data comparing consumer use and understanding of GDA FOP labels versus other FOP labeling schemes, like the TL labeling scheme, are extremely limited publically, making it unfeasible to conclude why food manufacturers prefer the GDA labeling scheme over other FOP labeling schemes, particularly the TL labeling scheme.
According to the experts that RTI interviewed for this study, food manufacturers prefer the GDA FOP labels over the TL labeling scheme because they do not want to communicate negative information about their products (i.e., red TLs) or have consumers interpret their products as unhealthy because their sales may suffer if their products display labels with more red lights than green lights. Similarly, a spokesperson for The Food Commission stated in a 2006 issue of New Nutrition Business (NNB), "The food industry simply does not want a color-coded labeling scheme that will force them to put a red sticker on a great number of foods. The food industry is terrified of losing sales [from products] with red dots" (p. 8). Per their response to Docket No. FDA-2010-N-0210, the Food Marketing Institute (FMI) opposes an FOP labeling scheme that employs colors with negative connotations; they believe such colors are "akin to a warning label" (FMI, 2010).
Yet Becky Lang, a nutritionist at Teeside University, stated in NNB (2006), "If the entire cereal aisle is plastered with red dots, it may force the food industry to address the formulation of foods and make healthier product choices" (p. 8). Möser et al. (2010) and the experts that RTI interviewed also agreed that FOP labeling schemes, like the TL labeling scheme, could motivate food manufacturers to reformulate and improve their products because food manufacturers are very concerned about placing negative information on their products. Möser et al. (2010) and Rubin (2004) concluded that a mandatory FOP labeling scheme could eliminate food products with unfavorable characteristics from the market.
Comments received from the food industry regarding Docket No. FDA-2010-N-0210 (DHHS, FDA, 2010) somewhat varied. Most food manufacturers, retailers, and organizations support a fact-based approach FOP labeling scheme that highlights at a minimum calorie information and is grounded on the Dietary Guidelines for Americans 2005. Although it is apparent that most food manufacturers use and, therefore, support a GDA FOP labeling scheme, some members of the food industry are not opposed to a TL labeling scheme, and other food industry members favor an FOP labeling scheme based on a nutrient profiling system, like NuVal. A few manufacturers, such as TreeNut and Paramount Farms, a producer of pistachios and almonds, advocate an FOP labeling scheme that highlights good and bad types of fat by rating healthy mono- and polyunsaturated fats instead of total fats.
Several food manufacturers stressed that FDA should consider package sizes and shapes (e.g., by exempting small packages), different package materials, printing processes (e.g., use of color and time), and package location when considering an optimal FOP labeling scheme so that the labels do not interfere with a manufacturer's ability to sell and market [their] product. Several members of the food industry also stressed in their responses the need for a public education campaign to help consumers identify and use FOP labels.
A few food retailers promote their own shelf-tag labels. For example, Stop and Shop/Giant disclosed that sales of shelf-labeled products in eight categories increased significantly in test stores where a shelf-tag labeling program was implemented over control stores. They concluded that "shelf tags are effective in providing consumer[s] with nutrition information and can help them make better choices" (Ahold, USA, Inc., 2010). On the other hand, the FMI recommends against a voluntary shelf-tag labeling program in their responses to Docket No. FDA-2010-N-0210 (DHHS, FDA, 2010) because they believe "such an effort would be counterproductive as it would stifle vigorous competition occurring among supermarkets in providing nutrition information to consumers. The use of shelf tags has increased dramatically among supermarkets in recent years and is an important point of differentiation for retailers" (FMI, 2010).
In the interviews that RTI conducted with experts, most interviewees believe that retailers would potentially benefit from their own shelf-tag labels because using them would differentiate their products and stores from their competitors, increase store traffic, and promote customer loyalty. A few experts mentioned that they have heard testimonials from retailers that shelf-tag labeling programs increased profit margins and shifted consumer purchasing of healthier products. These experts have also heard testimonials that food manufacturers have reformulated some products to achieve better "scores" from the shelf-tag labeling programs.
3.4 The International Experience
To provide a clearer context for understanding issues regarding FOP labels, this section briefly describes the implementation of FOP nutrition labels in other countries: Sweden, the UK, the Netherlands, and Australia and New Zealand.
3.4.1 Sweden
In 1989, Sweden's National Food Administration (NFA) established the Keyhole symbol to help consumers identify healthier food options within product categories (see Figure 3-1). The Keyhole symbol is a voluntary FOP label currently used in Denmark, Norway, and Sweden on prepackaged foods, fresh or frozen fish, and fresh or frozen fruits and vegetables, as well as restaurant menus and store recipe leaflets. The Keyhole symbol assures a product has limited amounts of total fat, saturated and trans fatty acids, total or added sugar, and salt and has a minimum amount of fiber. For example, dairy products with the Keyhole symbol contain less fat, salt, and sugar than corresponding products not labeled with the symbol. Although NFA sets the labeling criteria for 25 product groups for the Keyhole symbol, food manufacturers are responsible for ensuring food bearing the symbol conforms to NFA's regulations. Manufacturers are not charged to use the Keyhole symbol but are responsible for its promotion, and their products bearing the symbol are subject to review by NFA at any time.
Figure 3-1. FOP Symbols Used Internationally
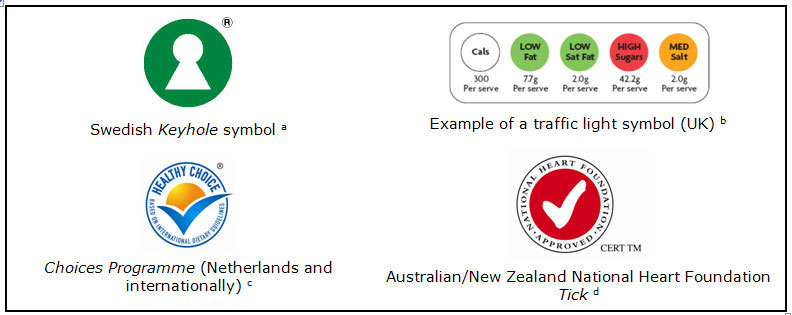 aKeyhole symbol reprinted with permission from the National Food Administration, Sweden.b TL symbol reprinted with permission from the Food Standards Agency, UK.cChoices logo reprinted with permission from the Choices International Foundation, Belgium.d The National Heart Foundation Tick reprinted with permission from the National Heart Foundation of Australia.
The Keyhole symbol was introduced by food manufacturers during the 1980s as part of a regional intervention project in northern Sweden to reduce the prevalence of coronary heart disease. One of the primary reasons NFA established the Keyhole symbol nationally was to stimulate food manufacturers to reformulate products and develop healthier products. Within 3 years of its introduction, consumer knowledge of the Keyhole symbol and consumer intake of low-fat and high-fiber foods increased (Larsson, Lissner, & Wilhelmsen, 1999). As reported by the Center for Science in the Public Interest (CSPI) in a petition to FDA, ICA, a major Swedish retailer, found sales of food products bearing the Keyhole symbol rose 15% in 2003 and 2004 (CSPI, 2006). However, Lobstein and Davies (2008) noted some drawbacks of the Keyhole symbol. They believe the symbol may not be applied uniformly to identify foods consumers should eat more of, like fruits and vegetables, and might be misunderstood by consumers to mean that food products bearing the symbol are recommended as an important and valuable part of a healthy diet, which in some cases they are not.
3.4.2 United Kingdom
In 2005, the UK's Food Standards Agency (FSA) adopted the TL labeling scheme (see Figure 3-1) to help consumers assess the levels of nutrients within a single food product and compare food products by using color-coding to help ascertain whether specific nutrient levels for fat, saturated fat, sugar, and salt fall under government definitions of high (red), medium (yellow), or low (green). FSA recommended applying the TL labeling scheme to seven categories of composite, processed foods and urged food manufacturers and retailers to voluntarily use the TL labeling scheme on such convenience foods as ready-to-eat meals, breakfast cereals, pizzas, sandwiches, burgers, and pies. By 2008, eight major food retailers, 26 food manufacturers, and one restaurant chain voluntary displayed the TL labeling scheme on 40% of all composite processed foods in the UK (Kondro, 2008).
Although several food companies, particularly retailers, widely adopted the TL labeling scheme, especially for store-brand items (Lobstein & Davies, 2008), a consortium of food companies disregarded FSA's recommendation and continued using GDA FOP labels on food products in the UK. GDA FOP labels typically display, without color-coding, the percentage recommended daily intakes for salt, sugar, fat, saturated fats, and calories. In their March 2006 issue, NNB reported there seems to be a "clear agreement across the food industry that GDAs are the most appropriate basis for providing important nutrition information to consumers" (p. 7). Additionally, some food retailers in the UK developed their own versions of FOP labels. For example, Sainsbury's, the third largest chain of supermarkets in the UK, developed their own TL labeling scheme, known as the Wheel of Health, which is a color-coded nutrient pie chart, and Tesco, the grocery market leader in the UK, developed its own GDA FOP label that uses color to identify nutrients, not nutrient levels (e.g., pink indicates sugar and yellow indicates salt).
Both Sainsbury's and Tesco reported increased sales of healthier products after they introduced each of their own FOP labeling schemes in their stores. Not only did Sainsbury's say their Wheel of Health significantly increased sales patterns but also stimulated manufacturers to reformulate their products to achieve healthier profiles (The Food Magazine, 2006; British Retail Consortium, 2009). Tesco reported that sales of healthier products increased by 80% (Green, 2006). Consumer research experts, however, caution the evidence was more anecdotal because neither Sainsbury's nor Tesco controlled for other factors (e.g., marketing promotions and/or discounts) or specified study details (Grunert & Wills, 2007). Also, Lobstein and Davies (2008) noted that more detailed evaluation is needed to show whether Sainsbury's Wheel of Health results in long-term behavior changes and sustains improvements in product reformulation.
In July 2006, Which?, a consumer organization in the UK, found 73% of UK consumers were confused by the variety of different FOP labels found on food products. Based on the same study results, consumers were able to use the TL labeling scheme correctly and found it easy to understand and quick to use. Compared with GDA FOP labels, the TL labeling scheme led to a significantly higher level of correct comparisons between products and provided consumers with more useful information to assess nutrition levels in individual products. The same study also found only a minority had a very good understanding of how to use GDA FOP labels. Another study found consumers had difficultly assessing and comparing the nutrients levels within a single food product and between food products using GDA FOP labels mostly because of different portion sizes (Lobstein, Landon, Lincoln, Ash, & Presso, 2007).
In a 2006 poll conducted by Harris Interactive, 46% of consumers reported they found different FOP labels confusing and would prefer to see one labeling scheme used on all food products; however, 39% of consumers believed the different FOP labels made sense in their own right. The poll also revealed that 40% of consumers believed FOP labels help them make healthier food choices, and 65% of consumers found the TL labeling scheme most helpful in determining whether a product was healthy. However, 45% of consumers polled said FOP labels had no effect on their purchasing decisions (Green, 2006).
In 2010, FSA released a report of a comprehensive 2009 study, including an independent review of consumer labeling research by Dr. Klaus Grunert, to assess several FOP labeling schemes (FSA, 2007). The report concluded that consumer use and understanding of FOP labeling could be improved if a single FOP labeling scheme were used that combined several FOP labeling schemes; that is, one scheme that incorporated both the words "high," "medium," and "low," and GDAs with or without TL color-coding. Based on the report, FSA made several changes to the TL labeling scheme, which included adding the words "high," "medium," and "low," and calories per portion to the scheme.
3.4.3 The Netherlands
In the Netherlands, an independent scientific committee of nutrition and food scientists developed the Choices logo (see Figure 3-1), which is assigned to food products that contain lower levels of sodium, added sugar, saturated fat and trans fatty acids, and energy and increased levels of fiber compared with similar products within the same product category. The Choices logo is not supported by a single authority but by a foundation of food manufacturers, retail and food service organizations, the Netherlands Nutrition Center, and nutrition scientists, and it is conditionally endorsed by the Dutch government. The Choices logo can be found on a variety of brands in many supermarket chains, worksite cafeterias, and other food service locations across the Netherlands, but, more specifically, on the following 10 food categories: vegetables and fruits, sources of carbohydrates, sources of protein (e.g., meat, fish, eggs, meat substitutes), dairy products, oil and fats, ready-to-eat meals, soups, sauces, snacks, and beverages. At its conception, a mass media campaign was developed to communicate the meaning of the Choices logo to consumers.
As of June 2008, more than 100 food manufacturers had joined the foundation, and the Choices logo was assigned to approximately 2,100 packaged food products and 600 fresh fruits and vegetables. In 2009, exposure to Choices logo significantly increased from 33% to 88% in its first year (Vyth et al., 2009). In a supermarket study, researchers found that consumers who are more weight and health conscious (i.e., pay more attention to their weight and/or look at nutrition information on food packages) actually do purchase more products with the Choices logo. However, the study also found that participants who reported having intentionally purchased products with the Choices logo had actually purchased more products with the logo than participants who reported not purchasing products with the logo intentionally (p 0.01) (Vyth, Steenhuis, Vlot, et al., 2010).
Currently, the Choices International Foundation has secured the endorsement of local authorities, scientists, nongovernmental organizations, and industry to support the logo in nine countries.
3.4.4 Australia and New Zealand
The Food Standards Australia New Zealand (FSANZ) is the governmental body responsible for developing food standards for Australia and New Zealand. Since 2002, FSANZ has required the nutrition information panel (NIP) to be displayed on food products, but consumer research indicates that consumers do not understand how to use the NIP to make healthy choices (Gorton, 2007). Currently, FSANZ is investigating whether an FOP labeling scheme would be an effective health strategy to guide consumer choice toward healthier food options and whether it should be voluntary or mandatory. According to research, most New Zealand consumers prefer the TL labeling scheme over the GDA FOP labeling scheme. The same research found that the TL labeling scheme was well understood across multiple consumer groups, including different ethnicities, races, education levels, and infrequent label users (Gorton, 2007).
The Heart Foundation in Australia and New Zealand implements the Tick program, a national public health initiative encouraging food companies to reformulate their products by meeting nutrition criteria and in return are able to display a certified trademark (the Tick logo) on food packaging and promotional material (shown in Figure 3-1). Tick criteria are based on national criteria for saturated fat, trans fat, salt, energy, fiber, and whole grains. The Tick program uses a panel of nutrition experts who research, approve, and set nutrition standards to specific food categories; currently there are 60 food categories. The Tick logo is on approximately 1,100 food products from 80 food companies. Each product that applies for the Tick is independently tested to verify if it meets standards. The Heart Foundation conducts random testing to make sure Tick products continue to comply with the standards. The Heart Foundation regularly reviews these nutrition criteria, changing them in a stepwise manner over time, so that the standards are always challenging manufacturers to produce Tick products that are healthier.
Research has shown the Tick logo acts as a "nutrient signpost" for consumers and has significantly influenced product reformulation (Vyth et al., 2009). Consumer awareness and use of the Tick logo is also high. As reported by Smith et al. (2002), two studies showed that 51% of women and 31% of men stated they had bought food with the Tick logo, and 68% of women and 55% of men stated that the presence of the Tick logo would persuade them to change brands. Also, according to Young and Swinburn (2002), many Tick products have either been specifically formulated or reformulated to meet Tick guidelines, particularly guidelines for fat and sodium. The Tick program has seen 61%, 26%, and 11% in average sodium reductions for cereals, breads, and margarine, respectively (Smith et al., 2002). As a result of the Tick program, 235 tons of salt have been removed from the Australian food supply annually (Williams, McMahon, & Boustead, 2003).
4. SUMMARY OF DISCUSSIONS WITH EXPERTS
In this section, we summarize the findings from the telephone interviews with seven experts regarding FOP labeling conducted in October 2010. Appendix B contains the discussion guide used in the interviews. The experts represent the areas of nutrition and public health, industry, consumer behavior and advocacy, and marketing. We summarize the findings by each of the following topic areas: (1) consumer response to FOP labeling, (2) producer response to FOP labeling, (3) retailer response to FOP labeling, (4) public health issues regarding FOP labeling, and (5) criteria for developing and assessing FOP systems. In general, the information provided by the experts corroborates the results in the literature review discussion in Section 5, as the experts are aware of the same literature. However, most experts emphasized the need to take the research to the "real-world" setting (i.e., studying consumer use and understanding in the supermarket and impacts on diet and health).
4.1 Consumer Response to FOP Labeling
Most experts agreed that consumers notice the NFP but not all consumers use or understand the information, particularly ethnic minorities and individuals with lower education levels and incomes. A few experts also noted that younger adults understand food labels better than older adults, but older consumers look at food labels more often. Most experts noted that consumers who are more educated and/or more health conscious are more likely to use and understand the NFP and other labeling features compared with other consumers. Most experts agreed, though, that most consumers want nutrition information available to them even if they do not use or understand it.
Most experts agreed that FOP labels could allow consumers to more easily compare food products and make healthier choices as long as the labels are conspicuous, consistent, and simple; promoted and created by a trustworthy source; and decrease the amount of time and knowledge it takes to make healthy decisions. As a member in the Keystone Food and Nutrition Roundtable, Dr. Lisa Sutherland learned that consumers look at food packages for a total of 9 seconds based on an eye-tracking study conducted to evaluate the Smart Choices program. She concluded FOP labels would be most noticeable if they appeared on the top left or top right of packages because people naturally read from top to bottom and left to right.
Based on their research, some experts found that FOP labeling schemes neutralized the gap in disparities among different population segments. For example, Dr. Sutherland mentioned that the GDA FOP label works for low-income populations because it takes away the "subjectivity," that is, the GDA label provides direct nutrition information rather than information that must be interpreted. Dr. Janet Hoek in New Zealand observed that TL labels neutralize the disparities normally found among different income and education levels as well as differences between highly motivated individuals (nutrition-information seekers) and less motivated individuals. Dr. David Katz believes nutrient profiling systems, like NuVal, eliminate real disparities among subgroups because "everyone can count to 100." Dr. Klaus Grunert believes there are no significant differences between different population segments in consumers' abilities to select the healthiest product within the same food category; however, he believes that most consumers have a more difficult time identifying the healthier product across food categories. Dr. Grunert, also mentioned, as did other European experts, that consumers from EU countries that have nationally known health messages and/or educational campaigns, like the UK, notice, use, and understand FOP labels more than other Europeans, particularly Eastern Europeans; currently 27% of UK consumers and 9% of French consumers notice FOP labels. Notably, Dr. Jaap Seidell in the Netherlands observed that low-income consumers consider price first, then convenience, taste, and finally healthfulness of a product. He believes the most effective FOP labeling system would consider all these factors. For example, if the healthiest products were less expensive and still tasty, then consumers, specifically those with lower incomes, would be more motivated to buy the healthiest products.
Based on a consumer research pilot study for FOP labels and other research he has conducted regarding calorie disclosures on restaurant menu boards, Dr. Scot Burton concluded that in order for FOP labels to make an impact on consumers the labels have to disconfirm consumers' expectations about the healthfulness of a product. For example, if someone expects a product to be higher/lower in a positive/negative nutrient than it actually is (based on the label), the FOP label is more likely to influence their purchase decision. More simply, if a consumer thinks a product is unhealthy but reads the FOP label and finds it is healthy, then the consumer is more likely to buy the product (and vice versa). If FOP labels simply confirm previous expectations (or prior beliefs) about product healthfulness, the FOP will have little influence.
4.2 Producer Response to FOP Labeling
Experts agreed that food manufacturers use FOP labels to market their products. According to Dr. Sutherland, FOP labels are traditionally part of a food manufacturer's marketing scheme, a way for food manufacturers to differentiate and sell their products. Hence, as Dr. Katz stated, "food manufacturers use FOP labels to accentuate the positives and ignore the negatives." He believes the FOP labels developed by food manufacturers provide some truth, but not the whole truth, about the nutrition of their products. For example, food manufacturers may label their products as "a good source of essential nutrients," but the products may also be high in fat. He believes the Smart Choices program was a failure because it was designed by manufacturers to help them differentiate and sell their products; thus, he believes that food manufacturers should not own an FOP labeling system. On the contrary, he believes a good, independent FOP labeling system would encourage competition among the food manufacturers and reformulation, which would ultimately lead to consumers purchasing more nutritious products within product categories.
Many experts agreed that food manufacturers prefer the GDA FOP labels over the TL labeling scheme because they do not want to communicate negative information about their products (i.e., red TLs) or have consumers interpret their products as unhealthy because their sales may suffer if their products are labeled with more red lights than green lights. A few experts also noted that food manufacturers who are currently using the GDA FOP labels would be opposed to adopting a different FOP labeling scheme because of cost and time to make changes to their food packages. Dr. Sutherland said that it can take up to 2 years to make changes to a food package. In contrast, a few experts believe that a few food manufacturers (e.g., those with products with low amounts of negative nutrients) would prefer the TL labeling scheme over the GDA FOP labels because it would make their products look more favorable.
Most experts agreed that FOP labeling schemes, like the TL labeling scheme, could motivate food manufacturers to reformulate and improve their products because food manufacturers are very concerned about placing negative information on their products, and they want consumers to buy their products. Comparatively, Dr. Burton found in his own research that requiring the disclosure of calorie information on restaurant menu boards encouraged some restaurant chains to undertake product reformulation or introduce new products (e.g., grilled chicken at Kentucky Fried Chicken).
Some experts believe that it may be too costly or difficult for some food manufacturers to reformulate their products. For example, Drs. Josephine Wills and Stefan Storcksdieck reported that in some cases a food manufacturer may be more likely to introduce a new product than reformulate an existing product because reformulation would affect product qualities like taste or texture. Dr. Seidell mentioned that the Netherlands uses a step-wise approach to gradually reduce the amount of negative nutrients (e.g., sodium) incrementally to avoid negative consumer reaction to major product changes.
4.3 Retailer Response to FOP Labeling
Most experts agreed that food retailers would potentially benefit from using a shelf-tag labeling scheme. By offering existing and new customers nutrition information via shelf tags, food retailers would differentiate their products and stores from their competitors, increase store traffic, and promote customer loyalty, which would ultimately increase food retailers' market shares and profit margins. Dr. Sutherland, one of the scientists behind Hannaford's Guiding Stars, mentioned that the original purpose of the program was to bring in secondary shoppers and convert them to primary shoppers by "adding value to their shopping" experience. By adapting the shelf-tag labeling scheme to an FOP labeling scheme and using FOP labels on private brands, many experts agreed that food retailers' store brand products would overshadow larger food manufacturers' products, possibly motivating large food manufacturers to reformulate their products to compete with less expensive private brands. However, Dr. Sutherland noted that although Hannaford supermarkets in the United States saw more customers in their stores after the introduction of the Guiding Stars program, she stressed that it took a lot of money and time to implement the program in their stores, and "it was a nightmare for store managers."
A few experts said that they have heard testimonials from retailers that shelf-tag labeling programs have led to increased profit margins and shifts in consumer purchasing to healthier products. For example, Dr. Katz, the principal inventor of the Overall Nutritional Quality Index used in the NuVal nutrition guidance program, is drafting a manuscript that concludes "consumers are purchasing more nutritious products within product categories." Experts also mentioned that food manufacturers have reformulated some products to achieve better "scores" from the shelf-tag labeling programs. For example, Dr. Sutherland mentioned that large food manufacturers inquired about getting more stars for their products after the launch of the Guiding Stars program; most manufacturers were interested in how they could get more stars by reformulating their products to attain lower amounts of negative nutrients (e.g., fat or sodium). Hence, Drs. Katz and Sutherland believe a shelf-tag labeling system would be the most advantageous way to provide consumers with nutrition information because retailers would be responsible for "scoring" every product on their shelves, and all consumers look at the shelf price tag. However, Drs. Katz, Sutherland, and Burton noted that consumers need nutrition information both at the point of purchase and at home to make optimal dietary decisions.
A few experts mentioned they read about Tesco's reported increased sales of healthier products in the UK after the introduction of Tesco's FOP labeling scheme and agreed the evidence was anecdotal based on lack of specific details, including lack of controls for other factors (i.e., marketing promotions and/or discounts). Drs. Wills and Storcksdieck also mentioned another paper that found no difference in sales of healthier products 4 weeks before and after the introduction of the TL labeling scheme in the UK (Sacks, Rayner, & Swinburn, 2009). Based on randomized trials in catering institutions and supermarkets, Dr. Seidell found FOP labels did not have a large effect on consumer choices but found pricing and product placement in conjunction with FOP labels had a larger effect on consumer choices.
Dr. Wills suggests that studies that look at food retailers' loyalty or club card data are the key to determining whether consumers use shelf-tag labels or FOP labels to choose healthier products. She also thinks such studies could reveal indirect effects of shelf-tag labels or FOP labels, like whether consumers who buy healthy products compensate with less healthier products. On the other hand, Dr. Seidell does not believe that FOP labels alone can have a big impact on sales. He noted that it is very difficult to capture effects of FOP labels on sales data because other factors, like marketing, promotions, product placement, and discounts, have bigger impacts. He mentioned consumers may be more likely to choose healthier products if food retailers used the nutrient profile of products (indicated by a shelf tag or FOP label) to determine which products to discount or market.
4.4 Public Health Issues Regarding FOP Labeling
Although most experts underscored the importance of acquiring real-world data to understand consumers' use and understanding of FOP labels, most experts agreed that an FOP labeling scheme, specifically a uniform system, could improve the overall dietary health of consumers in the long run and help reduce the rates of obesity-related chronic diseases. Most experts, however, believed an FOP labeling scheme is just one of many components needed to combat obesity. As Dr. Katz concluded, "Better food, better diet, better health." Dr. Katz also mentioned that a retrospective study he is working on has shown that people who eat foods with higher NuVal scores have lower BMI and lower risk of cardiovascular disease and death. Many experts, though, emphasized that an educational campaign is paramount to increase consumer awareness, knowledge, and motivation to change behavior by providing consumers with the education and tools they need to improve their overall diet quality. Additionally, most experts agreed the biggest impact of an FOP labeling scheme on positive public health outcomes (e.g., healthier diets) would be the result of product reformulation to create healthier products, which would impact all segments of the population. Otherwise, Dr. Katz believes consumer behavior changes are more likely to be seen only within specific population segments (i.e., those who are concerned about their diets). Dr. Katz also mentioned that to improve public health, individuals need to control calories; however, he noted that most consumers do not want to count or reduce calories. Dr. Katz believes an FOP labeling system that would improve the overall nutrient quality of foods would also help consumers choose healthier foods with higher nutrient density and lower energy density than foods with lower nutrient density and higher energy density, which would affect satiety and result in less caloric consumption. Dr. Sutherland believes an FOP labeling scheme should incorporate serving sizes to discourage overeating.
Although the potential benefits to public health are clear, some experts agreed there could be some disadvantages to FOP labels. One unintended consequence would be if consumers choose processed foods with more positive FOP labels over naturally healthy foods, like fresh fruits and vegetables. A few experts cautioned that some consumers, particularly adolescents, men, or individuals with lower incomes, may choose a product with more "red traffic lights," or higher amounts of calories, sugar, sodium, and/or fat, because they believe the product will taste better. A few experts also believe that some consumers may overeat products with "green lights" because they think they can eat a healthy product without limits. Additionally, Dr. Katz believes that without a standard, uniform FOP labeling scheme, consumers might become confused by different schemes or formats or too much or too little information on the label. Also, he also believes that different FOP labeling schemes could cause consumer suspicion because "everyone is telling me their products are nutritious." He also believes that too much information on an FOP label could cause confusion and discourage consumers from using the information. Dr Seidell mentioned that if food manufacturers develop their own FOP labels, they could use it as a marketing tool to accentuate the positive and ignore the negative aspects of the products (i.e., low-fat products that are high in sugar and not fewer calories). Based on the research of a French colleague (Rozin, Fischler, Imada, Sarubin, & Wrzesniewski, 1999), Dr. Grunert mentioned that breaking down foods into components, as a GDA FOP label does, could "ruin food cultures" in some countries such as France that have a strong food culture and generally healthy diets.
4.5 Criteria for Developing and Assessing FOP Systems
Most experts agreed that an FOP labeling scheme should include calorie information and four nutrients already featured in most existing FOP labeling schemes (sugar, saturated fats, trans fats, and sodium), reduction of which contribute to preventing chronic disease according to the Dietary Guidelines for Americans 2005. According to Drs. Wills and Storcksdieck, consumers want to see these nutrients on food labels. They also mentioned that consumers want information on positive nutrients (i.e., fiber), but they, along with a few other experts, agreed that an FOP labeling scheme should be limited to include calorie information, fiber, sugar, saturated fats, trans fats, and sodium to reduce consumer confusion derived from too much information. Nonetheless, Dr. Sutherland believes an FOP labeling scheme should also include nutrients for which the general public is lacking (e.g., folic acid, calcium). Drs. Wills and Storcksdieck would like to see an FOP labeling scheme that distinguishes good fats from bad fats. Additionally, Dr. Hoek mentioned that no calorie information is used in FOP labeling schemes in New Zealand because consumers there do not understand how to use this information.
Some experts want to see a standardized, uniform FOP labeling scheme based on the Dietary Guidelines for Americans 2005 (or similarly, the World Health Organization's chronic disease guidelines), scientifically proven research, and/or referenced benchmarks and developed by an independent but trustworthy entity. A few experts mentioned that separate FOP labeling schemes should be developed for different food categories. Dr. Sutherland concluded from her work on the Guiding Stars program that consumers think in terms of food categories; that is, they may compare different yogurts or different pretzels, but they do not compare across different food categories (e.g., yogurt vs. pretzels). She suggests that it would be useful to adopt a system with a limited number of food categories. She mentioned that during the initial development of Guiding Stars, certain generic nutrient criteria eliminated some foods from the program; for example, fiber criteria eliminated dairy products and saturated fat criteria eliminated meats. Dr. Grunert also mentioned that consumers notice FOP labels more often on specific food categories (e.g., yogurt, cereal) than other food categories (e.g., soft drinks, salty snacks). Additionally, a few experts agreed an FOP labeling scheme should be based on portion sizes or serving sizes in familiar household measures rather than a standardized measurement, like 100 grams. A few experts agreed an FOP labeling scheme based on serving size would allow consumers to more easily compare and choose the healthier option. Dr. Sutherland said that a system based on serving sizes (rather than per gram or kcal) allows for foods served in small portions to meet criteria; for example, in the Guiding Stars program, low-fat mayonnaise met criteria based on serving size but if the nutrient criteria were set per 100 kcal, then the sodium content would exceed the criteria. She also mentioned that there was subjectivity in deciding where to set the criteria cutoffs because there was no scientific basis.
Dr. Grunert added that a standard FOP labeling scheme should contain the same key nutrients, use the same font and colors, and be placed in the same locations on all products for easy identification and comparability. He believes that an FOP labeling scheme should be eye catching and easily recognizable. He promotes the use of a universal symbol or logo in an FOP labeling scheme to create an impression and/or increase noticeability. Dr. Hoek added that using color is more important than how the colors are displayed or formatted in an FOP labeling scheme.
Dr. Burton and Dr. Katz agreed that consumers would be more favorable to a nutrient profiling score than an FOP labeling scheme, like the GDA FOP label or the TL labeling scheme, because they believe it is very difficult for consumers, even well-educated consumers, to choose the overall nutritious product. They believe an overall score would make the biggest impact at the point of purchase and would help consumers compare products more easily. According to Dr. Katz, 9 out of 10 consumers appreciate the NuVal system because it "takes the burden off the consumer" and helps them identify the most nutritious products easily and quickly. Also, Dr. Katz stated there are no real disparities among different population segments with the NuVal system because consumers only have to compare different numbers. Although Burton and Katz believe some consumers (e.g., those who are highly motivated to acquire nutrition information) would like more information on the science or the "why" behind the score as well as information on specific nutrients or calories, they believe the average consumer just wants to be told which product is "good" and which product is "bad" in any easy-to-use and straightforward way. If consumers want more information, they still can rely on the NFP for more specific information. Drs. Wills and Storcksdieck, however, do not believe that food manufacturers would use a nutrient profiling system because they would not want any of their products rated poorly. Similarly, they believe consumers do not want to be told if a product is bad for them.
In comparison, Dr. Sutherland believes a nutrient profiling score is " subjective," that is, does not provide information on why one product scores higher than another. After working on the Guiding Stars program, she believes consumers need more information (i.e., than a star) about the nutrients in their food.
With regard to validation of FOP labeling schemes, Dr. Seidell believes the ultimate validation is testing how consumers use FOP labels and how FOP labels affect consumer choices. If the aim of the FOP system is reformulation, then he believes it should be validated to demonstrate that reformulation has occurred. He does not believe that FOP systems should be validated by expert rankings because the experts would rate 90% of the foods the same; he believes it is more important to rank those foods that "teeter on the fulcrum between healthy and unhealthy," or what he called "the gray zone" (e.g., low-sugar beverages, peanut butter). Dr. Sutherland discussed the need to test a large number of foods to determine how they are rated by a system and how different systems rate the same foods. For example, when 50 to 100 foods are tested with an algorithm, they generally rate in the direction expected, but when up to 1,000 foods are tested, then anomalies become apparent. To evaluate FOP labels, Drs. Wills and Storcksdieck suggest testing whether FOP labels help consumers choose healthy foods in the real-world setting. They believe there is no consensus on the best system to rank foods. They mentioned that an FOP labeling system could be used for other purposes, such as to restrict sales to children or tax less healthy foods.
5. LITERATURE REVIEW FINDINGS
Our review begins with a presentation of findings on consumer response to FOP and shelf-labeling systems (Section 5.1). Our synthesis is organized to discuss findings regarding (1) attention and processing; (2) liking, satisfaction, and label preference; (3) under-standing; (4) effects on use and purchase behavior; and (5) effects on sales and consumption. Within each section we review studies of FOP systems and then include studies on shelf-labeling systems. We conclude this section with a review of findings on consumer response by diverse subpopulations.
Next, we review the findings of studies on the effects of FOP labels on producers and retailers (Section 5.2). We discuss studies of implementation, effects on sales, and effects on product introduction and reformulation. Again, we start with a review of the effects of FOP labels and then include a section on the effects of shelf-labeling systems.
Table 5-1 describes the different FOP and shelf-labeling schemes discussed in the report and categorizes them by type, either nutrient-specific or summary systems. Summary nutrition systems are simple labeling schemes employing a single rating to a food product, while nutrient-specific systems display a series of nutrients on the label and their respective amounts.
| Name | Type | Description | Example of Symbol |
| a TL symbol reprinted with permission from the Food Standards Agency, UK.b GDA symbol reprinted with permission from the Food and Drink Federation, UK.c %DI symbol reprinted with permission from the Australian Food and Grocery Council.d TL-GDA symbol reprinted with permission from the Food Standards Agency, UK.e Healthy Choice symbol reprinted with permission from the Choices International Foundation, Belgium and the National Heart Foundation Tick symbol reprinted with permission from the National Heart Foundation of Australia.fKeyhole symbol reprinted with permission from the National Food Administration, Sweden.gNuVal symbol reprinted with permission from NuVal, LLC, U.S.hGuiding Stars symbol reprinted with permission from Guiding Stars Licensing Company, U.S. | |||
| Traffic light (TL) a | Nutrient specific | TL symbols usually display a ranking of total fat, saturated fat, sugar, sodium, and sometimes energy as high, medium, or low. Levels are assigned color codes of red, amber, and green, respectively. There are many versions of TL symbols that are most widely used in the UK and other parts of Europe. Several of the Australian studies tested UK TL labels. |  Example of a TL symbol. Example of a TL symbol. |
| Wheel of Health | Nutrient specific | Circular version of the TL symbol used in the UK. | Do not have permission to use symbol. |
| Guideline daily amount (GDA) b | Nutrient specific | GDA (also referred to as %GDA) schemes display nutrients per portion and include the amount in grams and as a percentage of a person's guideline daily amount for each nutrient. This symbol is used in the U.S., UK, and other parts of Europe. | |
| Percent daily intake (%DI) c | Nutrient specific | %DI schemes display the same information as GDA schemes and are used in Australia and New Zealand. | 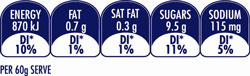 Example of a %DI symbol. Example of a %DI symbol. |
| Traffic light GDA (TL-GDA) d | Nutrient specific | The TL-GDA is a combination of the TL and GDA schemes and is often used in Europe. However, note that some versions of this scheme include text that corresponds to the TL colors indicating "high," "medium," or "low" levels of nutrients, while other versions do not include this text. This symbol is sometimes referred to as a colored GDA. | 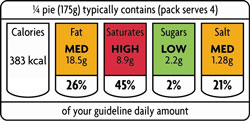 Example of a TL-GDA symbol. Example of a TL-GDA symbol. |
| "Check-mark" symbols also referred to as "Tick" symbols e | Summary (binary) | "Check-mark" stamps are either present or absent on food products. There are many types of check stamps used in different countries. For example, the Choices program using the Healthy Choice or Choices logo has countries participating on all continents, some of which include the Netherlands, Belgium, and Brazil. The Smart Choices program in the U.S., as well as the Australian/New Zealand National Heart Foundation, uses a "check-mark" symbol. |  The Healthy Choice symbol, an example of a binary "check-mark" symbol. The Healthy Choice symbol, an example of a binary "check-mark" symbol. The National Heart Foundation Tick, an example of a binary "check-mark" symbol. The National Heart Foundation Tick, an example of a binary "check-mark" symbol. |
| Keyhole symbol f | Summary (binary) | This green keyhole-shaped icon is either present or absent on food products. This logo is also permitted to be printed in black and may have a thin white line to allow it to stand out on a dark background. Countries using this voluntary icon include Sweden, Denmark, and Norway. |  Example of a green Keyhole symbol. Example of a green Keyhole symbol. |
| NuVal g | Summary (graded) | Shelf-tag system displayed in some U.S. supermarkets indicating overall food rating of 1 to 100; the higher the rating the more nutritious the food product. |  Example of NuVal symbol. Example of NuVal symbol. |
| Guiding Stars h | Summary (graded) | Shelf-tag system found in some U.S. supermarkets indicating 1, 2, or 3 stars; the higher the rating the more nutritious the food product. The system has also been expanded outside the grocery environment to restaurants, school cafeterias, and hospitals. |  Example of the Guiding Stars symbol. Example of the Guiding Stars symbol. |
5.1 Studies of Consumer Response
Studies of consumer response to FOP nutrition labels and nutrition shelf tags presented findings regarding different aspects of consumers' cognitive processes and behavior, including attention and processing, liking and preferences, understanding, effects on likely use and purchase behavior, and effects on sales and consumption.
5.1.1 Attention and Processing
Overview
Section Highlights
- A few studies suggest that to gain consumers' attention in the supermarket, FOP labels should be positioned to stand out against potential "competing" elements on the food package that could distract consumers' attention.
- According to the results from one study, simple logos such as the Choices logo, a single check mark, more quickly capture attention than more complex labels such as the %GDA that show the percentage of the recommended dietary amount per serving.
- Current research studies do not provide a clear answer as to how much information presented on a label is too much for consumers to process.
- Three studies conducted in the UK, Europe (e.g., Germany and Belgium), and Australia found that consumers believe they can process TL schemes quickly.
- The UK study, in particular, found that when respondents completed a task to identify the healthier food product about 6% more respondents believed that labels incorporating TL colors were perceived as easier to process compared with GDA labels without TL colors.
- A two-country European study found that consumers could identify the healthier food products approximately 13 to 17% faster when a package contained a multiple star rating or a binary "check-mark" symbol compared with when they saw a GDA label.
- A study in the Netherlands found that consumers were able to identify the healthier product about 8% faster when they saw a package with the healthy choices symbol (e.g., binary check-mark symbol) compared with a GDA label. The study also found that an FOP label more quickly gained consumers' attention if they were larger or were placed in a consistent location on the top right of food packages.
- An eye-tracking study in the UK found that the nutrients that consumers focused on in a TL label corresponded to the nutrients that consumers paid the greatest attention to in reading a EU standard nutrition label (e.g., similar to the Nutrition Facts Panel). This perhaps suggests that FOP nutrition labels may guide closer reading of the Nutrition Facts Panel.
Key Finding
Based on the studies reviewed, simple FOP labels that incorporate color-coding or graphic elements such as TL schemes (including a colored or TL GDA scheme), stars (e.g., concept similar to the Guiding Stars system), and check-mark or tick symbols enable consumers to more quickly process information than monochrome %GDA schemes. Because of limited research comparing consumers' processing time using TLs, stars, and check-mark or tick symbols, it is unknown among these types of systems which is the easiest for consumers to process.
Attention refers to individuals devoting their thinking toward a stimulus. Once an individual's attention is focused on an object or idea, then he or she will begin processing information. Together attention and processing are the first steps toward understanding nutrition FOP and shelf labels as well as leading consumers to change their behavior by incorporating this information into their food purchase and consumption decisions. We found seven empirical studies regarding consumer attention and processing of FOP labels, including five published articles and two studies in the grey literature. We did not find any studies on this topic regarding nutrition shelf-labeling systems. Table 5-2 summarizes the findings of studies regarding consumer attention to and processing of FOP labels. Studies were given quality scores ranging from 1 (lowest) to 5 (highest).
| Study | Labels | Study Design | Sample Population | Results | Quality Score |
| a The simple TL was a concept tested that displayed one of the following symbols on a food package: a red circle and text indicating "Less healthy choice," amber circle and text indicating "Ok choice," or a green circle and text indicating "Healthier choice." The Multiple TL symbol displayed on the front of food packages indicated levels of four negative nutrients as shown by color-coded circles and text (e.g., high, medium, or low). The color red represented "high," amber represented "medium," and green represented "low." | |||||
| Synovate, 2005a UK |
| Five FOP food label formats (four signposting concepts and a no-label scheme) were applied to 5 food categories. Subjects interviewed and shown food cards with photographs of front and back of products (subjects allowed to refer to both sides of products during testing). Interview consisted of 3 sections: performance of signposting concepts without signposting, preference of signposting concepts without signposting and diagnostics of preference, and application of signposting and background information on respondents' current nutritional awareness/diet. The performance section of the interview consisted of individual product evaluations and comparison of two similar products. For the individual task, consumers were asked about their perceptions of the amount of nutrients contained in the product as high/medium/low. For the comparison task, respondents were asked which of two products contained the higher amount of "negative" nutrients (e.g., fat, saturated fat, salt, and sugar). | Representative sample of 2,676 UK consumers aged 16 to 70 (69% female), and quotas on age, working status, and socioeconomic group. | Processing time: For the individual task, multiple TLs took the least time to interpret (average time 5.1 seconds) followed closely by the colored GDA (average time 5.4 secs) and other schemes. However, the time to interpret the multiple TL scheme was significantly faster than the other FOP label formats (p 0.05). For the comparison task, the colored GDA took the least time to interpret (average time 5.6 seconds) compared with other schemes. The time to interpret the colored GDA was significantly faster than the time to interpret other FOP labels (p 0.05). | 3.5 |
| Which?, 2006 UK |
| Each subject interviewed and presented with one of four labeling schemes for a healthier and less healthy version of the following products: breakfast cereal, pasta sauce, and ready-to-eat meal. | 636 participants aged 18 to 65 years and representative of shoppers in UK (included booster sample of lower socioeconomic groups); 150 participants per scheme. | Perceived processing time: FSA TL (93%) > manufacturers' GDA (84%) > Tesco with TLs (83%) > Tesco GDA (78%). | 2.5 |
| Jones & Richardson, 2007 UK | Standard UK nutrition label (standard 8 nutrients plus energy nutrient) vs. standard UK including the TL (standard 8 nutrients plus energy nutrient) | Participants' eye movements recorded while they made healthiness ratings for two types of nutrition labels; 2 (nutrition labels) x 9 (nutrients) repeated measures design = 18 sets of labels were presented to each participant. | 92 university staff and students (mean age 31.5 years, 72% female) in UK. | Processing: Fixation time different for each nutrient on each label, but all nutrients on TL were examined most often. Significant correlation between TL label and fixation time (r (6) = 0.88, p 0.01). | 3.5 |
| Feunekes et al., 2008 Italy, UK | Study 2:
| Online experiment but presented in a collage of products and comparisons of healthier and less healthier rated pre and post for either (a) paired choice of 2 categories or (b) market basket (e.g., shopping basket of products). | 776 Internet panel 18 to 55 years of age in Italy and UK. | Processing time: Stars (53.2 seconds) and tick (55.6 seconds) GDA (64.0 seconds) (p 0.01) a difference of 20.3%. | 4.0 |
| Kelly et al., 2009 Australia |
| Experimental study with three food product categories and 4 label conditions (monochrome % daily intake, color-coded % daily intake, TL, TL + overall rating). Participants divided into 12 groups and each group shown two-dimensional mock food packages with one labeling scheme for 2 sets of food products. Participants completed questionnaire to assess nutrient levels and healthiness. | Quota sample of 790 adults (= 18 years) in Southern Australia, who had primary or shared responsibility for grocery shopping in their household. Participants recruited via shopping center intercept. Quotas allocated equal numbers by socioeconomic status tertile and age (median age group 50 to 59); (68% female). | Perceived processing time: Participants presented with the TL and TL + systems significantly more likely to perceive that they could compare the healthiness of products "at a glance" than those presented with the M-%DI and CC-%DI systems (39% and 30% vs. 29% and 20%, respectively; p 0.01). | 3.5 |
| Möser et al., 2010 Germany, Belgium | GDA vs. TL | Self-administered survey to determine consumers' preferences for different nutrient profile labeling and determinants affecting preferences. | Convenience sample of consumers aged 17 to 81 in Germany (n = 147, 52% female) and Belgium (n = 128, 53% female). | Perceived processing time: Rated reading TL as less time consuming than reading labels with the percentage of GDA. | 3.0 |
| Bialkova & van Trijp, 2010 The Netherlands |
| Two experiments using visual search paradigm. Each participant completed 2 visual search tasks: Task 1: logo detection (present vs. absent logo), Task 2: logo detection/identification (for one vs. two logos). 12 participants were presented with Task 1 first and 12 participants presented with Task 2 first. | 24 participants from the Netherlands (16 women) aged 19 to 33 years, all had normal/corrected-normal vision. | Attention: Display size, color scheme, familiarity with label location, and specific label location on FOP are determinants of attention to labels. Task 1: Present vs. absent logoProcessing time: Performance faster when location of FOP remained the same in two consecutive trials (577 vs. 627 milliseconds) (p 0.0001) and performance faster when the logo was present rather than absent (584 vs. 620 milliseconds) (p 0.0001). Main effects for display size (p 0.01) and location (p 0.001) meaning that participants responded faster with doubled display size and when FOP logo was presented on top right of label. Logo type did not affect attention capturing. Task 2: One vs. two logosProcessing time: Faster response with monochromatic vs. polychromatic color scheme (709 ms vs. 737 ms) (p 0.001). Display size (p > .0001) and familiarity (p > .0001) also significant p > meaning that participants' performance was faster with doubled display size and when FOP remained in consistent location on the food package. Faster processing with Choices logo than GDA schemes (p 0.001). | 2.5 |
Studies cited in Table 5-2: Bialkova, S., & van Trijp, H. (2010). What determines consumer attention to nutrition labels? Food Quality and Preference, 21(8), 1042 1051. doi:10.1016/j.foodqual.2010.07.001 Feunekes, G. I. J., Gortemaker, I. A., Willems, A. A., Lion, R., & van den Kommer, M. (2008). Front-of-pack nutrition labelling: Testing effectiveness of different nutrition labelling formats front-of-pack in four European countries. Appetite, 50(1), 57-70. doi:10.1016/j.appet.2007.05.009 Jones, G., & Richardson, M. (2007). An objective examination of consumer perception of nutrition information based on healthiness ratings and eye movements. Public Health Nutrition, 10(03), 238 244. doi:10.1017/S1368980007258513 Kelly, B., Hughes, C., Chapman, C., Louie, Jimmy C-Y, Dixon, H., Crawford, J.,... Slevin, T. (2009). Consumer testing of the acceptability and effectiveness of front-of-pack food labelling systems for the Australian grocery market Health Promotion International, 24(2), 120 129. Möser, A., Hoefkens, C., Van Camp, J., & Verbeke, W. (2010). Simplified nutrient labelling: Consumers' perceptions in Germany and Belgium. Journal für Verbraucherschutz und Lebensmittelsicherheit, 5(2), 169 180. doi:10.1007/s00003-009-0531-0 Synovate. (2005a). Quantitative evaluation of alternative food signposting concepts: Report of findings. COI on behalf of the Food Standards Agency. Which? (2006). Healthy signs? Campaign Report. London, United Kingdom.
Study Details
Factors Affecting Attention
One study, conducted in the Netherlands found that logo type did not affect consumers' attention, as measured by eye movements on a test that exposed subjects to the presence versus absence of FOP labels (Bialkova & van Trijp, 2010). FOP labeling formats studied were the Choices logo, a "check-mark" stamp displayed on healthier food choices, and two variants of GDA labeling schemes (e.g., monochrome and colored). Although the study found that label type did not have an effect on attention for the first test, the second test where subjects were asked to identify one versus two logos on food packages found that attention capture was faster for the Choices logo compared with GDA schemes. In addition, larger display size, a monochromatic color scheme, familiarity with label location on the food package, and location of the label on the top right of the package received greater attention. A limitation to this study was that it did not assess the background color of the packaged used (e.g., green) and its effects on attention. A recent experimental study conducted in the United States indicated that nutrition FOP symbols compete with other elements on the front of food packages for consumers' attention (Lin & Levy, 2010).
Perceived Processing Time
Three studies reported survey results regarding which FOP labeling schemes consumers believed were the quickest to understand or perceived to have the fastest processing time. Among these, several studies found that consumers perceive the TL label as easier to process than other labeling schemes such as the GDA.
Participants in a British study who were presented with one of four labeling schemes (i.e., TL, pastel-colored GDA, monochrome GDA, or GDA incorporating TL colors) believed that TLs were quicker and easier to use to compare products than other labels (Which?, 2006). Another study conducted in Germany and Belgium examining consumers' perceptions of simplified nutrition information found that adults rated reading TLs as less time consuming than reading labels with GDAs (Möser et al., 2010).
A third experimental study presented Australian consumers with mock food packages displaying the TL and TL plus overall systems, as well as monochrome and color-coded %DI systems (Kelly et al., 2009). The TL plus overall scheme is the standard TL scheme with the addition of an overall product rating displayed inside a larger TL color-coded circle located to the left of the four nutrient circles on the label. Overall ratings are based on proposed FSANZ nutrient profiling criteria. Products with overall rating scores less than 4 are displayed in green, scores ranging from 4 to 10 are shown in amber, and scores greater than 10 are displayed in red. The study found that subjects who were presented with the TL systems were significantly more likely to perceive that they could compare the healthiness of products "at a glance" than those presented with monochrome and color-coded %DI. Among these variants, subjects gave the highest rating to the TL system that also included an overall rating (39%) and gave the lowest rating to the color-coded %GDA system (20%).
Measured Processing Time
When considering measured processing time (to interpret nutrition information), the TL allowed subjects to quickly interpret nutrition information (Jones & Richardson, 2007; Synovate, 2005a). After closer inspection of the studies, when subjects were asked to compare products using FOP labels, such as in an actual grocery store setting, one study found that icons such as stars (e.g., as used in hotel ratings) and ticks (or check marks) required less time to process than the GDA (Feunekes, Gortemaker, Willems, Lion, & van der Kommer,2008Study 2). However, another study found that the colored GDA took less time to interpret than the TL scheme (Synovate, 2005a).
One eye-tracking study in the UK examined participants' fixation time to compare a standard nutrition label (e.g., standard EU nutrition label format including the addition of the energy nutrient in kilojoules) versus the standard nutrition label including the TL and found participants examined the nutrients on the TL most often (Jones & Richardson, 2007). In an earlier UK study where subjects were asked to identify nutrients as being "high," "medium," or "low," multiple TLs took the least time to interpret (5.1 seconds) followed closely by the colored GDA (5.4 seconds) and other schemes (Synovate, 2005a).
However, another study conducted in Italy and the UK compared consumers' processing time to complete tasks to identify the more nutritious of a pair of products using stars (53.2 seconds) and a tick (55.6 seconds) finding that they took less time to evaluate than the GDA (64.0 seconds) (Feunekes et al., 2008Study 2). The comparability of the two measures of processing time observed measures of eye tracking and the amount of time to complete ratings of a series of pairs of products may contribute to the apparent discrepancy of findings in these studies.
Eye-Tracking Assessments
A study of eye movements among UK consumers exposed to both a multiple TL label system and the back of the package label found that the nutrient components of TL labels that drew the greatest attention on the FOP label were the same components on which a consumer focused on the back-of-package nutrition label (Jones & Richardson, 2007). This could indicate that FOP labels can help focus consumers' attention on critical nutrients.
Amount of Information Presented
Marketers and policy makers have debated how much stimuli is too much for consumers to process, but no agreement on this issue emerges from the literature (Scheibehenne, Greifeneder, & Todd, 2010). One review article assessing consumer behavior in the context of information disclosure found little evidence of significant effects of buyer behavior (Day, 1976). However, the review also found that as consumers are presented with more information before making a purchase decision, confidence in their choice increases. An experimental study asked subjects to view commercials and identify the healthier of two brands when nutrition information was superimposed over products. Subjects were divided into groups exposed to different formats (e.g., adjectival formats, such as, good, fair or percentage formats) and amounts of information (e.g., four or eight nutrients). The study found a significant difference between groups exposed to different formats, suggesting that the adjectival formats as opposed to percentage formats lead consumers to more easily identify healthier foods. Results also suggest that as consumers were presented with more information their processing was divided among the information, causing "information overload" (Scammon, 1977).
Consumer Response to Color
Colors elicit different moods or responses from consumers. Research has found that warm colors, such as reds and yellows, lead to increased activity or excitement, while cool tones, such as greens and blues, have a calming effect, suggesting they may be better suited for decision making (Hoyer & MacInnis, 2007). It is possible for consumers to associate colors or symbols with certain meanings, causing interference effects (Lidwell, Holden, & Butler, 2010). For instance, because Americans have learned when driving that green means "go" and red means "stop," they may associate the colors on the TL label to have the same meaning.
Additional References Not Included in Evidence Tables:
Day, G. S. (1976). Assessing the effects of information disclosure requirements. The Journal of Marketing, 40(2), 42 52.
Hoyer, W. D., & MacInnis, D. J. (2007). Consumer behavior (4th ed.). Boston, Massachusetts: Houghton Mifflin Company.
Lidwell, W., Holden, K., & Butler, J. (2010). Universal Principles of Design. Beverly, Massachusetts: Rockport Publishers.
Scammon, D. L. (1977). "Information load" and consumers. The Journal of Consumer Research, 4(3), 148 155.
Scheibehenne, B., Greifeneder, R., & Todd, P. M. (2010). Can there ever be too many options? A meta-analytic review of choice overload. The Journal of Consumer Research, 37(3), 409 425.
5.1.2 Liking, Satisfaction, and Preferences
Overview
Section Highlights
- Consumers generally have favorable opinions regarding FOP nutrition labels, believing that they are helpful in making healthy food selections at the supermarket.
- Consumers tend to like labels that they believe are easy to understand quickly, visually appealing, credible, and/or trustworthy.
- A common theme in the studies reviewed is that consumers prefer labels that display TL color-coding as opposed to labels that emphasize numeric information.
- Consumers also prefer labels that incorporate TL color-coding with check-mark symbols (e.g., the Heart Foundation Tick).
- One study indicated that consumer preferences for specific FOP labeling schemes may be influenced by the complexity of the task: the more complex the task (e.g., the more products' nutrition information being compared) the more likely consumers prefer simple labels (e.g., labels incorporating graphic elements like TL colors), as opposed to labels incorporating detailed numeric information.
- Several studies in Europe and New Zealand found that audiences with lower income or education or less health-conscious individuals tended to prefer less complex FOP labels.
- A study of shelf labels found that many consumers prefer a labeling system to be displayed on both a shelf label and the food package.
Key Finding
The majority of studies comparing consumer liking of different labeling schemes revealed that consumers prefer nutrient-specific labels that display TL color-coding such as TL or colored GDA symbols compared with binary summary formats such as the Heart Foundation Tick or numeric-based nutrient-specific formats such as %DI or %GDA schemes. However, it should be noted that only one study compared consumer liking of TLs with graded summary concepts including multiple stars and smileys.
This section describes findings on consumer liking, satisfaction, and preferences and consumers' attitudes toward FOP nutrition labels and shelf labels, as well as consumers' preferences for specific labeling schemes and what factors determine those preferences. The literature review identified 14 articles on this topic, including 11 experimental and survey studies (7 published articles, 3 studies in the grey literature, and 1 study presented at a conference) and 3 studies reporting results of focus groups or in-depth interviews (2 published articles, 1 study in the grey literature). Additionally we found 4 studies regarding consumer liking of nutrition shelf labels, including 2 published articles and 2 studies in the grey literature. For more detail on the empirical studies described in this section, Table 5-3 summarizes studies regarding consumer liking of, satisfaction with, and preferences for nutrition FOP labels, and Table 5-4 summarizes shelf-labeling studies on these topics.
| Study | Labels | Study Design | Sample Population | Results | Quality Score |
| a The simple TL was a concept tested that displayed one of the following symbols on a food package: a red circle and text indicating "Less healthy choice," amber circle and text indicating "Ok choice," or a green circle and text indicating "Healthier choice." The Multiple TL symbol displayed on the front of food packages, indicated levels of four negative nutrients as shown by color-coded circles and text (e.g., high, medium, or low). The color red represented "high," amber represented "medium," and green represented "low." | |||||
| Scott & Worsley, 1994 New Zealand |
| Five independent sample questionnaires to test consumer attitudes and knowledge of four nutrition labels. Survey was self-administered unless participant had difficulty reading, in which case a trained interviewer read the questionnaire to the participant. | 1,500 randomly selected consumers in 28 supermarkets in New Zealand (28% female, aged 16 to 60+ years). | Liking: Traditional back-of-pack nutrition label disliked; other designs liked more. Older (35%) and less educated (35%) consumers would most like to see the Tick logo on food packages compared with younger and more educated consumers, respectively (p 0.001). | 3.5 |
| Synovate, 2005a UK |
| Five FOP food label formats (four signposting concepts and a no-label scheme) were applied to five food categories. Subjects were interviewed and shown food cards with photographs of front and back of products (subjects allowed to refer to both sides of products during testing). Interview consisted of 3 sections: performance of signposting concepts without signposting, preference of signposting concepts without signposting and diagnostics of preference, and application of signposting and background information on respondents' current nutritional awareness/diet. | Representative sample of 2,676 UK consumers aged 16 to 70 (69% female), and quotas on age, working status, and socioeconomic group. | Liking: Most participants (65%) liked the color-coded GDA the best.Perceived Helpfulness: 96% of respondents believed FOP labels would be useful in making healthier choices. | 3.5 |
| Which?, 2006 UK |
| Each subject interviewed and presented with one of four labeling schemes for a healthier and less healthy version of the following products: breakfast cereal, pasta sauce, and ready meal. | 636 participants 18 to 65 years of age and representative of shoppers in UK (included booster sample of lower socioeconomic groups); 150 participants per scheme. | Reported Ease of Use: FSA TLs (90%) > Tesco with TLs (87%) > manufacturer's GDA (82%) > Tesco GDA (81%). | 2.5 |
| Feunekes et al., 2008 UK, Germany, Italy, Netherlands | Study 1:
| Online experimental presentation of three of eight formats; for a healthier and less healthy choice in each of three food types. | 1,630 18- to 55-year-old adults from Internet panel in UK, Germany, Italy, and the Netherlands. | Reported ease of understanding: Multiple TLs, stars, smileys > others (p 0.01). Shield others (p 0.01) Least knowledgeable found smileys > Wheel of Health (p 0.05).Credibility: Wheel of Health and multiple TLs > other (p 0.01). Smileys more credible if officially (e.g., WHO) endorsed (p 0.01).Liking of formats: Multiple TLs and Wheel of Health > others (p 0.01). | 4.0 |
| Feunekes et al., 2008 Italy, UK | Study 2:
| Online experiment but presented in a collage of products and comparisons of healthier and less healthier rated pre and post for either (a) paired choice of two categories or (b) market basket (e.g., shopping basket of products). | 776 Internet panel 18 to 55 years of age Italy and UK. | Reported ease of understanding: Stars > GDA (p 0.01).Liking: Pair of products: GDA > others (p 0.01). Basket of products: Stars > GDA > Ticks (p 0.01). | 4.0 |
| Malam et al., 2009 UK |
| Qualitative Part 1: Accompanied shoppers in store, and in-home shopping bag audits.Quantitative Part 1: Survey designed to test subjects' understanding; administered via face-to-face interview in subjects' home using computer-assisted personal interviewing (CAPI).Quantitative Part 2: Multiple signposting survey to test impact of comparing products using different combinations of signposting schemes; administered via face-to-face interview in subjects' home using CAPI. Full-factorial design used for 3 elements: %GDA/no %GDA, TL/no TL, and interpretive text (high, medium, low)/no interpretive text; eight combinations of three elements were tested. Two groups of food (main meal portion and small portion or snack). Two additional labels were tested (Sainsbury's Wheel of Health-TL, circular presentation and Tesco pastel colored %GDA-%GDA, nonsignposting color).Qualitative Part 2: In depth interviews where subjects presented with different label types. Explored how people deal with different info. in the marketplace | Qual. Part 1: 113 shops, 56 in-store audits, 56 in-home audits.Quan. Part 1: 2,932 shoppers in UK (primary responsibility for shopping in their household) selected using random probability sampling; Response rate 58%.Quan. Part 2: 1,062 shoppers (primary responsibility for shopping in their household) in UK selected using random location sampling approach.Qual. Part 2: 50 shoppers participated in in-depth interviews; participants recruited via quotas to ensure spread across geographic areas. | Overall conclusions: strongest FOP formats combine text (high, medium, low), TL colors, and %GDA information.Perceived ease of understanding: Text, TL, %GDA: perceived easiest to understand for 44% shoppers, 32% shoppers preferred the circular TL. | 3.5 |
| National Heart Foundation of Australia, 2009 Australia |
| Online experimental survey and a few in-depth interviews to gain insights. Each respondent asked to choose the healthier of two products in each of 10 food categories. The labeling scheme differed for each of 4 groups of respondents. Group 1-TL, Group 2-%DI, Group 3-one product HFT and the other did not, Group 4-both products have %DI plus one has the HFT. | 600 Australian consumers (four matched samples: n = 150 per group); Data weighted by experiment, gender, age, and household income to reflect the Australian population. | Liking: Perceived usefulness: 44% preferred TL vs. 32% for %DI and 24% for HFT. | 3.5 |
| Möser et al., 2010 Germany, Belgium | GDA vs. TL | Self-administered survey to determine consumers' preferences for different nutrient profile labeling and determinants affecting preferences. | Convenience sample of consumers aged 17 to 81 in Germany (n = 147, 52% female) and Belgium (n = 128, 53% female). | Liking: Although in both countries the GDA is the most used FOP nutrition label, in Belgium prefer GDA and in Germany prefer TL. In Belgium, there was a lower preference for GDA compared with TL with increasing age (p = 0.004) and BMI (p = 0.009). | 3.0 |
| Kim & Kim, 2009 Korea | FOP labels in Korea | Survey administered by face-to-face interview. Collected information regarding frequency of checking nutrition labeling, degree of understanding, and attitudes and preferences for FOP labeling. | 1,019 Korean adults aged 20 to 40 years (59.9% females). | Preference: For FOP in general, Korean consumers prefer four to five nutrients (55.8%) listed on label and prefer nutrient contents to be distinguished by color (58.3%). | 1.5 |
| Vyth et al., 2009 The Netherlands | Choices logo | Quantitative process evaluation of Choices logo via online questionnaire; initial survey administered 4 months after introduction of logo and follow-up administered 1 year later. | Random sample of 1,400 Dutch Internet panelists for each of two surveys; initial survey: 1,032 responded (and follow-up: 1,127 responded). Sample 18+ year-old member of household who most often visited a supermarket. For the initial survey, mean age was 46.4 (+ 13.2) years, 80.8% female, mean BMI 25.6 (+ 5.1); For the follow-up survey, mean age was 49.1 (+ 15.0) years, 86.5% female, mean BMI 25.4 (+ 5.1). | Liking: Women liked the logo more than men and perceived as more attractive (diff = 0.23, p 0.01), eye-catching (diff = 0.20, p 0.05), and credible (diff = 0.30, p 0.01); more educated adults liked logo more than less educated adults (diff = 0.23, p 0.05 and diff = 0.18, p 0.05). | 3.5 |
| Lin & Levy, 2010 U.S. | Study 1:
Summary FOP:
Controls:
| Experimental tasks included choice between two products, product judgment and nutrient level ratings, and FOP scheme ratings. Three product categories tested, including snacks, cereals, and main meals. | 2,424 participants recruited from convenience sample of U.S. online consumers. | Liking: All nutrient-specific symbols tested were equally helpful and trustworthy. However, Nutrition Highlights (a nutrient-based system) was rated significantly higher than Smart Choices (a summary system), when healthy products tested (p 0.05). Mean rating for healthy foods by labeling scheme: Nutrition Facts = 3.93, Nutrition Highlights = 3.84, Nutrition Tips = 3.74, Smart Choices = 3.43, Front only = 3.41. | 4.0 |
Studies cited in Table 5-3: Feunekes, G. I. J., Gortemaker, I. A., Willems, A. A., Lion, R., & van den Kommer, M. (2008). Front-of-pack nutrition labelling: Testing effectiveness of different nutrition labelling formats front-of-pack in four European countries. Appetite, 50(1), 57-70. doi:10.1016/j.appet.2007.05.009 Kim, W. K., & Kim, J. (2009). A study on the consumer's perception of front-of-pack nutrition labeling. Nutrition Research and Practice, 3(4), 300 306. Lin, C-T. J., & Levy, A. (2010). Food and Drug Administration front-of-pack consumer research. Paper presented at the Institute of Medicine, Food and Nutrition Board. Malam, S., Clegg, S., Kirwan, S., McGingal, S., & British Market Research Bureau (BMRB). (2009). Comprehension and use of UK nutrition signpost labelling schemes. Prepared for Food Standards Agency. Möser, A., Hoefkens, C., Van Camp, J., & Verbeke, W. (2010). Simplified nutrient labelling: Consumers' perceptions in Germany and Belgium. Journal für Verbraucherschutz und Lebensmittelsicherheit, 5(2), 169 180. doi:10.1007/s00003-009-0531- National Heart Foundation of Australia. (2009). Australians and front of pack labelling: What we want, what we need. Retrieved from http://www.heartfoundation.org.au/SiteCollectionDocuments/Tick%20HeartFoundation%20Research%20Summary%20FOPL.pdf Scott, V., & Worsley, A. F. (1994). Ticks, claims, tables and food groups: A comparison for nutrition labelling. Health Promotion International, 9(1), 27 37. doi:10.1093/heapro/9.1.27 Synovate. (2005a). Quantitative evaluation of alternative food signposting concepts: Report of findings. COI on behalf of the Food Standards Agency. Vyth, E., Steenhuis, I., Mallant, S., Mol, Z., Brug, J., Temminghoff, M., ... Seidell, J. (2009). A front-of-pack nutrition logo: A quantitative and qualitative process evaluation in the Netherlands. Journal of Health Communication, 14(7), 631 645. Which? (2006). Healthy signs? Campaign Report. London, United Kingdom.
| Study | Labels | Study Design | Sample Population | Results | Quality Score |
| Affinnova, 2007 (NuVal, 2010) U.S. | NuVal (Overall score 1 to 100) | Messaging and communication of NuVal brand. (No additional information presented regarding study design.) | 454 female respondents, aged 35 to 64 years; all respondents expressed interest in healthy lifestyle. | Preference: Consumers were asked if the NuVal system was available at the grocery store, where would they prefer to find it. 37% said on the products themselves and 55% said both on the price tags located on the front-of-store shelves and on the products themselves. | 1.0 |
| Berning et al., 2007 U.S. | Shelf labels with detailed information vs. shelf labels with summary information | Choice experiment where each survey respondent was shown 16 sets (4 per set) of shelf labels. The fourth set was the same in all the choice sets (a label with high prominence price/unit price and no nutrition information). The full factorial design was 2 x 2 x 3 x 2. Shelf labels had varying displays of price (low vs. high prominence), per-unit price (low vs. high prominence), and nutrition formats (written nutrition information: no information, low prominence, high prominence or summary [star-rating] nutrition information none and present). | 410 shoppers (mean age 42.4 + 16.6 years, 62% female) intercepted in stores: part of a California supermarket chain. | Preference: Used different models to determine that less nutrition-conscious consumers prefer the summary labels and require less time to process them, while nutrition-conscious consumers and consumers who do most of their households' shopping prefer the detailed labels. | 3.0 |
| Affinnova, 2009 (NuVal, 2010) U.S. | NuVal (Overall score of 1 to 100) | Consumers reviewed eight different products within six categories; first comparison showed product images and prices and second showed same product images and prices and NuVal scores. | Panel of 1,611 consumers, aged 18 to 59 years, 78% female. | Liking: 82% of consumers had positive view of NuVal. 32% indicated the system is "easy." | 2.0 |
| Katz et al., 2009 U.S. | ONQI system (NuVal) | Internet surveys to assess validation of NuVal | Group 1: 454 female respondents, aged 35 to 64 years (e.g., same study as the Affinnova, 2007, study). Group 2: 350 male and female respondents aged 18 to 64 years. | Liking:Group 1: 93% said system would be helpful in making purchase decisions.Group 2: 85% of respondents agreed the NuVal system is unique and 87% believable. Compared the numeric ONQI system (scale 1 to 100) to a system that reports nutritional quality using one, two, and three stars. 75% of the respondents preferred the ONQI system. | 2.0 |
Studies cited in Table 5-4:
Berning, J. P., Chouinard, H., & McCluskey, J. J. (2008). Consumer preferences for detailed versus summary formats of nutrition information on grocery store shelf labels. Journal of Agricultural and Food Industrial Organization, 6, 1 20.
Katz, D. L., Njike, V. Y., Faridi, Z., Rhee, L.Q., Reeves, R. S., Jenkins, D.J.A., & Ayoob, K.T. (2009). The stratification of foods on the basis of overall nutritional quality: The overall nutritional quality index. American Journal of Health Promotion, 24(2), 133 143.
NuVal. (2010). [Response to Docket FDA-2010-N-0210].
Study Details
General Opinions Concerning FOP Labeling
Consumers generally have favorable opinions regarding FOP labeling. For example, the majority of consumers (96%) in a UK study believed that FOP labels would be helpful in making healthier decisions (Synovate, 2005a). Results of a survey of Korean consumers found that, on average, consumers agreed that FOP labeling is quite necessary and helpful when selecting foods at the supermarket (Kim & Kim, 2009). Results of a focus group found that although consumers believed nutrition symbols on the front of food packages can assist in choosing healthy products they may not always use nutrition logos such as the Keyhole symbol to make food purchase decisions. Other factors such as price and taste sometimes take precedence over nutrition (Lando & Labiner-Wolfe, 2007). The Keyhole symbol functions much like a tick icon, in that it is only displayed on healthy foods in the grocery store that meet specific criteria.
Specific FOP Labels Liked or Preferred
Several studies surveyed consumers to find that they like labels that include TL color-coding. For example, studies conducted among UK consumers revealed a preference for the color-coded GDA, the TL, the Wheel of Health, or circular TL format and a scheme that combined text, the TL, and %GDA (Malam, Clegg, Kirwan, McGingal, & British Market Research Bureau, 2009; Synovate, 2005a; Which?, 2006). A four-country European study exposed each study participant to three out of the following six labeling formats: a Wheel of Health, TLs, stars, smileys, a health protection shield, and a healthier choice tick (Feunekes et al., 2008-Study 1). Stars and smileys are similar to hotel ratings, displaying one to five stars or smileys to rank the healthiness of the foods tested. The health protection shield is a symbol often displayed on sunscreens. The concept tested included a numeric rating inside the "shield" symbol to rank the healthiness of the foods tested. After subjects viewed the labels, they were asked to rate the FOP format on liking among other attributes. The study found that consumers liked the Wheel of Health and TL scheme more than the other formats studied. Another study conducted by the National Heart Foundation of Australia found that 44% of Australian consumers preferred the TL labeling scheme versus 32% for the %DI and 23% for the Heart Foundation Tick (National Heart Foundation of Australia, 2009).
Determinants of Liking and/or Preferences
Some evidence suggests that consumers prefer different labeling schemes depending on the number of product choices. For instance, one study conducted in Europe revealed that when consumers were asked to identify the healthier of two food products they preferred the GDA more than icons such as ticks or stars. However, when participants had to choose the healthier food among a grocery basket of products they liked stars followed by the GDA and tick (Feunekes et al., 2008-Study 2). Consumers tend to like labels that they deem as more credible or trustworthy (Möser et al., 2010; Feunekes et al., 2008-Study 1; Vyth et al., 2009). They also like labels that they perceive are easy to understand, are appealing, or can be interpreted quickly at a glance (Malam, Clegg, Kirwan, McGingal, & British Market Research Bureau, 2009; Möser et al., 2010; Synovate, 2005a; Vyth et al., 2009; Which?, 2006). Aspects of labels that consumers found appealing included color codes and detailed numeric information such as those found on the colored GDA label (Synovate, 2005a). Another study revealed that consumers would prefer an FOP label that lists four to five nutrients that are distinguishable by color (Kim & Kim, 2009).
In some cases, consumers with different demographic characteristics have different label preferences. Differences have been found among consumers with regard to nationality, gender, education level, age, and BMI. Interestingly, a study found that consumers in Belgium and Germany have different labeling format preferences. This study found that even though in Belgium and Germany the GDA is the most-used FOP nutrition label, in Belgium subjects preferred the GDA and in Germany subjects preferred the TL scheme (Möser et al., 2010). Regarding the Choices logo, a Dutch study found that women liked the logo more than men, and medium- and high-education respondents liked the logo more than low-education respondents liked it (p .05) (Vyth et al., 2009). Consumers aged 45 or older (35%) and less-educated (35%) consumers in New Zealand would most like to see the Tick logo on food packages compared with younger and more-educated consumers, respectively (p .001) (Scott & Worsley, 1994). Finally, in a Belgium study, increasing age (p = 0.004) and BMI (p = 0.009) indicated a preference for the TL compared with the GDA (Möser et al., 2010).
Liking May Not Indicate Understanding
It is important to note that a study found that liking an FOP labeling scheme did not necessarily indicate understanding of that scheme for making nutrition decisions. For example, in a British study, although 32% of shoppers preferred the circular TL, testing indicated participants were more likely to give correct responses for the label that combined text, TL, and %GDA (Malam et al., 2009).
Focus Group/In-depth Interview Studies on FOP Liking/Preferences
Many of the same themes were found in the focus group studies as the experimental and nonexperimental studies discussed in the previous section. FOP labels that were preferred most among focus group participants were those labels that participants believed were easiest to understand, more appealing, or credible. For instance, a focus group study conducted in the Netherlands discussed eight executions of FOP calorie flags with consumers finding that simpler flags depicting the number of calories per serving or 100 grams were most preferred as opposed to more complex flags, including references to daily needs or exercise or a flag including a phrase referring to a balanced lifestyle (van Kleef, van Trijp, Paeps, & Fernández-Celemín, 2008).
Participants liked the TL scheme because of its graphics and color-coding, believing it is easy to interpret. Parents in a New Zealand study had different preferences for specific label formats but agreed that labels with graphics (e.g., TL) were easier to process than labels with numeric information (e.g., %DI) (Maubach & Hoek, 2010). In a UK qualitative study to further investigate consumer preferences of the multiple TL versus the colored GDA (CGDA) label, consumers said the multiple TL was easy to understand. Color-coding was seen as an ideal method to convey information quickly, but text indicating high, medium, and low within the TLs was also important for quick decisions. Other consumers who preferred the colored GDA format believed it to be more credible, suggesting that geometric-shapes may symbolize authority (Synovate, 2005b).
Shelf-Labeling Studies Liking and Preferences
We also reviewed studies of consumer response to shelf labeling systems with regard to liking and preferences. Table 5-4 summarizes these studies.
NuVal is a nutrition scoring system displayed on shelf tags indicating a product's nutrition rating on a scale of 1 to 100; the higher the NuVal nutrition rating, the more nutritious the product. Two studies surveyed consumers to determine whether they liked the NuVal system. A study conducted by Affinnova, a market research firm, on behalf of NuVal found that 82% of consumers had a "positive impression" of NuVal (NuVal, 2010). In another study, 93% of Group 1 respondents (e.g., 454 females) believed the system would be helpful in making purchase decisions. In Group 2 (e.g., 350 male and female respondents), 87% perceived the system was believable, and when they were asked whether they preferred the Overall Nutritional Quality Index system (ONQI) (NuVal system) to a system that reports nutritional quality using a one to three stars rating system (e.g., Guiding Stars), 75% preferred the ONQI system (Katz et al., 2009). Consumers were asked if the NuVal system was available at the grocery store, where they would prefer to find it. Interestingly, 55% would prefer the information to be presented on both the price tags located on the front of store shelves and on the products themselves, while 37% said only on products themselves (NuVal, 2010).
One shelf-labeling study found that different types of consumers prefer different labeling formats. Researchers in this U.S. study created shelf labels with varying displays of price, per-unit price, and nutrition information formats to determine that less nutrition-conscious consumers prefer summary labels requiring less time to process while nutrition-conscious consumers and consumers who do most of their households' shopping prefer detailed labels (Berning, Chouinard, & McCluskey, 2007).
Additional References Not Included in Evidence Tables:
Lando, A. M., & Labiner-Wolfe, J. (2007). Helping consumers make more healthful food choices: Consumer views on modifying food labels and providing point-of-purchase nutrition information at quick-service restaurants. Journal of Nutrition Education & Behavior, 39(3), 157 163.
Maubach, N., & Hoek, J. (2010). A qualitative study of New Zealand parents' views on front-of-pack nutrition labels. Nutrition & Dietetics, 67(2), 90 96. doi:10.1111/j.1747-0080.2010.01425.x
Synovate. (2005b). Qualitative signpost labelling refinement research: Report of findings. COI on behalf of the Food Standards Agency.
van Kleef, E., van Trijp, H., Paeps, F., & Fernández-Celemín, L. (2008). Consumer preferences for front-of-pack calories labelling. Public Health Nutrition, 11(02), 203 213. Doi:10.1017/S1368980007000304
5.1.3 Understanding
Overview
Section Highlights
- Our systematic review identified 18 empirical studies across Europe, Australia, New Zealand, and the United States that assessed the effects of different types of FOP labels on consumers' understanding and ability to identify healthier food choices.
- Overall, the evidence suggests that nutrient-specific FOP systems, such as TL FOP nutrition labels, are easier for consumers to understand than binary summary FOP systems displayed by "check-mark" or "tick" symbols on healthier foods at the supermarket.
- Specific labels that consumers perceived as easy to understand were labels that contained color or graphic elements such as multiple TL nutrition labels and icons such as stars and smileys.
- Labels relying more heavily on numeric information such as the %GDA (the percentage of a recommended dietary amount or Guideline Daily Amount) and the Health Protection Shield (e.g., summary FOP nutrition label concept that included a numeric rating similar to the NuVal system) were perceived as more difficult to understand.
- Nine of 11 studies comparing FOP labels incorporating TL colors with less interpretive nutrient-specific labeling schemes found that consumers' understanding was better in response to labels incorporating TL colors compared with % GDA or %DI nutrition labeling systems.
- The proportion of consumers who identified the healthier food choices tended to be about 10 to 20% higher when they were presented with a label displaying TL colors compared with labels presenting GDA or %DI information.
- Five of seven experimental studies comparing nutrient-specific schemes incorporating TL colors to summary FOP schemes found that consumers were better able to identify a healthier food choice in response to a label incorporating TL color-coding than to summary symbols such as "check-mark" or "tick" symbols. (Note that only a couple of studies reviewed compared a TL label system with a graded or continuous summary system such as multiple stars or the health protection shield.)
- In most, but not all, studies that included a no-label condition, consumers performed better at understanding nutrition information (by 10 to 15%) in response to a product package with any FOP nutrition label system than to a product package without a label.
- Four studies also suggested that schemes incorporating TL colors are easier to understand among consumers who were older or of lower socioeconomic status. When considering FOP nutrition label design, a study indicated that more consumers most clearly understand text indicating "high," "medium," and "low" levels of nutrients compared with %GDA information and TL colors. However, the addition of colors further increased consumers' performance by about 15%.
Key Finding
The studies reviewed suggest that consumers most easily understand simplified FOP nutrition information on a label that incorporates TL color-coding and corresponding text indicating "high," "medium," or "low" levels of nutrients compared with "check-mark" symbols and symbols relying solely on numeric information. This is especially true for older consumers or consumers with lower socioeconomic status. This review identified few studies that compared a TL label system with a more continuous or graded summary rating system such as multiple stars.
Table 5-5 summarizes findings from 18 studies regarding consumer understanding of FOP nutrition labels. Among the 18 studies are 8 published articles, 4 studies in the grey literature, and 6 studies presented at conferences and/or meetings. We did not find any literature regarding consumers' understanding of nutrition shelf-labeling systems. In addition to the 18 studies discussed in the evidence tables, one additional study presenting results from a focus group is discussed in this section.
| Study | Labels | Study Design | Sample Population | Results | Quality Score |
| a The simple TL was a concept tested that displayed one of the following symbols on a food package: a red circle and text indicating "Less healthy choice," amber circle and text indicating "Ok choice," or a green circle and text indicating "Healthier choice." The Multiple TL symbol displayed on the front of food packages indicated levels of four negative nutrients as shown by color-coded circles and text (e.g., high, medium, or low). The color red represented "high," amber represented "medium," and green represented "low." | |||||
| Scott & Worsley, 1994 New Zealand |
| Five independent sample questionnaires to test consumer attitudes and knowledge of four nutrition labels. Survey was self-administered unless participant had difficulty reading, in which case a trained interviewer read the questionnaire to the participant. | 1,500 randomly selected consumers in 28 supermarkets in New Zealand (28% female, aged 16 to 60+ years). | Understanding: The Tick logo, food pyramid, and Heart Foundation nutrition claim misled some participants. For instance, 50% of shoppers thought they should only eat foods with labels to help prevent heart disease and one-third believed they can eat as much of foods with Tick logo and the claim as they would like. More of the older and less- educated respondents misinterpreted the labels compared with younger and more-educated respondents (p 0.05). | 3.5 |
| Synovate, 2005a UK |
| Five FOP food label formats (four signposting concepts and a no-label scheme) were applied to five food categories. Subjects were interviewed and shown food cards with photographs of front and back of products (subjects allowed to refer to both sides of products during testing). Interview consisted of three sections: performance of signposting concepts without signposting, preference of signposting concepts without signposting and diagnostics of preference, and application of signposting and background information on respondents' current nutritional awareness/diet. The performance section of the interview consisted of individual product evaluations and comparison of two similar products. For the individual task, consumers were asked about their perceptions of the amount of nutrients contained in the product as high/medium/low. For the comparison task, respondents were asked which of two products contained the higher amount of "negative" nutrients (e.g., fat, saturated fat, salt, and sugar). | Representative sample of 2,676 UK consumers aged 16 to 70 (69 % female), and quotas on age, working status, and socioeconomic group. | Overall, multiple TLs and colored GDA performed strongest.Understanding: For the individual product evaluations, the multiple TLs scheme produced the greatest proportion of correct responses (79%) across all ages and socioeconomic subgroups with a level of correct response significantly higher than the other schemes (p 0.05). When comparing products, the colored GDA produced the greatest percentage of correct responses (88%), performing significantly higher than other signposting schemes (p 0.05). Multiple TLs and monochrome GDA also performed strongly, but color-coded GDA performed best for most demographic segments. | 3.5 |
| Which?, 2006 UK |
| Each subject interviewed and presented with one of four labeling schemes for a healthier and less healthy version of the following products: breakfast cereal, pasta sauce, and ready meal. | 636 participants 18 to 65 years of age and representative of shoppers in UK (included booster sample of lower socioeconomic groups); 150 participants per scheme. | Understanding: FSA TL scheme (97%) > Tesco with TLs (89%) > Other manufacturers' GDA (87%) > Tesco's GDA (86%). The FSA TL scheme led to a significantly higher level of correct comparisons (97% were able to correctly compare using the FSA scheme compared with 86% for the Tesco GDA scheme). 90% of those in lower socioeconomic groups were more likely to identify the healthier choice with the FSA TL scheme compared with 75% for Tesco's GDA scheme. | 2.5 |
| Jones & Richardson, 2007 UK | Standard UK nutrition label (standard eight nutrients plus energy nutrient) vs. standard UK including the TL (standard eight nutrients plus energy nutrient) | Participants' eye movements recorded while they made healthiness ratings for two types of nutrition labels; 2 (nutrition labels) x 9 (nutrients) repeated measures design = 18 sets of labels were presented to each participant. | 92 university staff and students (mean age 31.5 years, 72% female) in UK. | Understanding: Less error in perceived healthiness with TL. Mean error perceived healthiness rating (difference between perceived and actual healthiness) was 1.77 SD 0.76 for the TL with standard label, and 2.22 (SD 0.77) for the standard label alone (p 0.01); an effect size of 0.54. | 3.5 |
| Feunekes et al., 2008 UK, Germany, Italy, Netherlands | Study 1:
| Online experimental presentation of three of eight formats; for a healthier and less healthy choice in each of three food types. | 1,630 18- to 55-year-old adults from Internet panel in UK, Germany, Italy, and the Netherlands. | Reported ease of understanding: Multiple TLs, stars, smileys > others (p 0.01). Shield others (p 0.01) Least knowledgeable found smileys > Wheel (p 0.05).Perceived healthiness of foods: Smileys and stars > others (p 0.01). Health shield others (p 0.01). | 4.0 |
| Feunekes et al., 2008 Italy, UK | Study 2:
| Online experiment but presented in a collage of products and comparisons of healthier and less healthier rated pre and post for either (a) paired choice of two categories or (b) market basket (e.g., shopping basket of products). | 776 Internet panel 18 to 55 years of age Italy and UK. | Reported ease of understanding: Stars > GDA (p 0.01).Perceived healthiness: FOP label > no FOP label (but no consistent difference by format). | 4.0 |
| Malam et al., 2009 UK |
| Qualitative Part 1: Accompanied shoppers (e.g., observation of participants while shopping), in store, and in-home shopping bag audits.Quantitative Part 1: Survey designed to test subjects' understanding; administered via face-to-face interview in subjects' home using CAPI.Quantitative Part 2: Multiple signposting survey to test impact of comparing products using different combinations of signposting schemes; administered via face-to-face interview in subjects' home using CAPI. Full-factorial design used for three elements: %GDA/no %GDA, TL/no TL, and interpretive text (high, medium, low)/no interpretive text; eight combinations of three elements were tested. Two groups of food (main meal portion and small portion or snack). Two additional labels were tested (Sainsbury's Wheel of Health-TL, circular presentation and Tesco pastel colored %GDA-%GDA, nonsignposting color).Qualitative Part 2: In-depth interviews where subjects presented with different label types. Explored how people deal with different information in the marketplace. | 113 shops, 56 in-store audits, 56 in-home audits. 2,932 shoppers in UK (primary responsibility for shopping in their household) selected using random probability sampling; response rate 58%. 1,062 shoppers (primary responsibility for shopping in their household) in UK selected using random location sampling approach 50 shoppers participated in in-depth interviews; participants recruited via quotas to ensure spread across geographic areas. | Overall conclusions: Strongest FOP formats combine text (high, medium, low), TL colors, and %GDA information.Perceived ease of understanding: Text, TL, %GDA were perceived easiest to understand for 44% of shoppers, 32% of shoppers preferred the circular TL.Understanding: When tested, shoppers were more likely to give correct response for the TL, text, %GDA label (70%), and the TL-text label (71%) compared with the other schemes (e.g., for %GDA alone the percentage correct was 57%). When consumers were asked to evaluate levels of nutrients in products, inclusion of text increased proportion of correct answers from 63 to 70% for first product tested and from 65 to 68% for second product tested. When evaluating the healthiness of single product, inclusion of text increased proportion of correct answers from 59 to 68% for first product tested and from 61 to 70% for second product tested.Consistency of label format: There were no significant differences in selecting the healthier product where there were different style labels rather than a consistent product system. However, some respondents reported that they would be frustrated by different systems.Understanding diverse subpopulations: Less-educated shoppers had more difficulty with all signposting methods. Shoppers aged 65 + had more difficulty making healthiness judgments for all labels (most difficulty with %GDA). Nonwhite and those in lower social grades had more difficulty comprehending all label formats. | 3.5 |
| Borgmeier & Westenhoefer, 2009 Germany |
| Randomized controlled trial using five experimental conditions of labels. Each subject participated in two tasks: Task 1: Subjects were shown photographed food cards and asked to identify the healthier food item in 28 pair-wise comparisons; Task 2: Simulated grocery shopping experience where subjects were shown 72 food cards simultaneously and asked to select foods and drinks they would like to consume the next day (Task 2 results are discussed in Table 5-8). | Convenience sample of 420 adults (mean age 36, 53.6% female) in Germany; 84 adults per condition. | Task 1: Average number of correct choices differed significantly among the experimental conditions (p 0.001); TL yielded the highest average of correct choices (88.6%; 24.8 + 2.4) > CGDA (82.5%; 23.1 + 3.1), GDA (81.4%; 22.8 + 3.2) > tick label (76.8%; 21.5 + 2.7) > No label (72.1%; 20.2 + 3.2). The mean number of correct choices did not differ significantly in monochrome GDA vs. colored GDA format, but all other label comparisons differed significantly (p 0.01) major difference by label by BMI or education status. | 4.0 |
| National Heart Foundation of Australia, 2009 Australia |
| Online experimental survey and a few in-depth interviews to gain insights. Each respondent asked to choose the healthier of two products in each of 10 food categories. The labeling scheme differed for each of four groups of respondents. Group 1: TL; Group 2: %DI; Group 3: one product HFT and the other did not; Group 4: both products have %DI plus one has the HFT. | 600 Australian consumers (4 matched samples-n = 150 per group); data weighted by experiment, gender, age, and household income to reflect the Australian population. | Understanding: Overall, the percentage of healthier choices was higher for the TL (75.4%) and %DI (74.7%), compared with the HFT (71.7%). Across individual food categories the TL performed significantly better than the HFT for 6 of 9 nutrients. Differences among other systems were mixed. Labeling was equally effective among socioeconomic groups. | 3.5 |
| Kelly et al., 2009 Australia |
| Experimental study with three food product categories and four label conditions (monochrome % daily intake, color-coded % daily intake, TL, TL + overall rating). Participants divided into 12 groups and each group shown two-dimensional mock food packages with one labeling scheme for two sets of food products. Participants completed questionnaire to assess nutrient levels and healthiness. | Quota sample of 790 adults (= 18 years) in Southern Australia, who had primary or shared responsibility for grocery shopping in their household. Participants recruited via shopping center intercept. Quotas established for equal distribution of respondents by socioeconomic status and age (median age group 50 to 59); (68% female). | Understanding: Customers significantly more frequently identified the healthier of two products when the package contained the TL (either version of the label) compared with when the package contained the %DI label (p 0.001). Participants were more likely to identify healthier foods for the TL system compared with the M %DI system (OR = 0.2; 95% CI 0.1 0.5, p 0.001) and the CC %DI system (OR = 0.3; 95% CI 0.1 0.9, p 0.05); No significant difference in ability to identify healthier food between the TL and TL +. Participants from least socially economically disadvantaged areas were more likely to be able to identify the healthier food products using the M-%DI than those who were from most socially disadvantaged areas (OR = 6.3; 95% CI 1.4 29.2). | 3.5 |
| Maubach et al., 2009 New Zealand | Study 1:
| 2x3x2 factorial experiment, testing the effect of two FOP formats and three levels of product claims (no claim, nutrition claim, and health claim), across two nutrition profiles (e.g., better or worse). The nutrition claim stated "a good source of Calcuim-25% RDI per serve" while the health claim stated "High in Calcium for increased bone mineral density-25% RDI per serve." One breakfast cereal was chosen as the product used in tests. Supermarket environment simulated by allowing consumers to click and read the Nutrition Information Panel, ingredients list, and allergen information. | Random sample from online panel of 1,334 parents aged 2 to 12 years in New Zealand who shopped for food. 428 responses obtained (Response rate = 32%). Sample was 53.3% female; mean age 37.7 years, (SD = 4.1.) | Respondents who viewed the nutritionally poorer cereal content had a significantly more negative attitude when shown the TL rather than %DI (F = 13.57, p 0.001). No main effects on product claims and attitudes. | 5.0 |
| Maubach et al., 2009 New Zealand | Study 2:
| Experiment to test the effect of Study 1 variables (e.g., nutrition format and claim types) on consumers' choice behavior. A different cereal was used as the test product for this study. Fifteen combinations of nutrition information (NIP, %DI, and TL), nutritional profile (better or worse), and label claim (no claim, nutrient, and health). Complete row design, respondents were shown 3 subsets of 10 pairs. The order of pairs shown to participants was randomized. Health claims were only placed on better nutrition profile. | Random sample of 2,400 using same parameters as Study 1. 801 responses obtained (56.4% female, mean age 37.7 years, SD = 8.9). | Perceived benefit of FOP labels compared with no FOP labels but magnitude of effect differed in better versus worse nutritional profiles. %DI label led consumers to evaluate label more positively than nutrition profile suggested (mean score change in utility relative to NIP on effect of adding %DI 0.55 and TL 0.22 for worse nutrition profile (significant) versus mean score change in utility on effect of adding %DI 1.01 and TL 1.04 for better nutrition profile (not significant). Product claims had greatest effect on choice behavior (F statistic 620.0; p 0.001) suggesting numeric information is less relied on than text. However, claims had less effect when the TL was present compared with %DI and the NIP. (Change in utility from worse to better product profile NIP 0.07, %DI 0.80, TL 1.21). | 5.0 |
| Andrews & Burton, 2010 U.S. |
| A 3 FOP icon (no FOP icon control, Smart Choices icon, and TL-GDA) x 2 (NFP; 1) control with no Facts Panel and 2) Facts Panel available). The objective of the study was to measure how TL-GDA icons impact consumers' perceptions of nutrient levels, overall healthfulness, nutrition accuracy, etc. | 521 participants (mean and median age 47 years, 51% female). Sample designed to balance gender and four age quotas (18 to 31, 32 to 44, 45 to 57, 58+) used to match census data for U.S. Median household income category was $35,000 to $50,000 and median education level was "some college." | Understanding: In the absence of the NFP, a significantly higher proportion of consumers picked the healthier food product if the package contained a TL label (about 81%) than the Smart Choices check (61%) or no FOP label (56%). However, among consumers who were shown the NFP in addition to the FOP label, the effects of FOP labels were modest (78% for TL; 74% for Smart Choices, and 72% for no FOP label).Smart Choices icon can lead to positive and potentially misleading nutrient evaluations and product healthfulness. For example, for a moderately healthy product containing 20% of daily value for sodium and cholesterol, evaluations of the Smart Choices summary icon were significantly more favorable than TL-GDA or no FOP control (p 0.05). Nutrition-conscious consumers perceive product's nutrient and overall healthfulness more favorably for moderately healthy products compared with other consumers. When comes to weight and heart disease risk perception, there is no difference for nutrition-conscious vs. other consumers. | 4.0 |
| Edge, 2010 U.S. |
| Online survey, followed by pilot study to test consumer understanding of nutrition using different FOP labeling schemes. Unbranded products used in tests: 3 products within each category representing high, medium, and low levels of nutrients/calories. No claims or ingredient lists shown on food packages. | 7,363 consumers aged 18 to 70 years reflecting 07 08 U.S. Census demographic estimates for household income, age group, and education level (67% female). | In general, increasing information on the package strengthened understanding. In particular, it should be noted that the presence of positive nutrients did not interfere with ability to comprehend negative nutrients. However, fewer participants were able to identify positive nutrients when only negative nutrients were displayed on the label. | 4.0 |
| Grunert, Wills, 2010 UK, Sweden, France, Germany, Poland, Hungary | FOP labels in European marketplace including:
| In-store observation, in-store interview, and in-home questionnaire in six European countries. In UK and Sweden, 3 retailers x 3 locations x 6 product categories. In France, Germany, Poland, and Hungary, 2 retailers x 3 locations x 6 product categories. Use and understanding of GDA FOP nutrition labels measured via in-home questionnaire. Regarding understanding, subjects were presented with GDA and asked to indicate healthier food. When respondents were asked to choose the healthiest product for 3 ready-to-eat meals, all products tested for all countries included the GDA label except Sweden. (In Sweden tested Keyhole label.) | For in-store observations and interviews, 2,019 shoppers recruited in UK, 1,858 Sweden, 2,337 France, 1,963 Germany, 1,800 Poland, and 1,804 Hungary. Subjects recruited via retail store intercept. Same respondents for the in-home questionnaires. However, return rates were 46% UK, 65% Sweden, 36% France, 42% Germany, 83% Poland, and 39% Hungary. Mix of social grades and ages. | Understanding: Differences in understanding by country for GDA. In Sweden, 56.9% ranked product with Keyhole symbol as healthiest even though 95% aware of symbol. Understanding also increases with social grade (several p-values listed for different grades) and interest in healthy eating (p .0001). | 3.0 |
| Grunert, Fernández-Celemín, 2010 UK |
| In-store observation of participant in aisle to determine if looked at nutrition label and time spent choosing product. After observation, subjects participated in store interview to query about their determinants of choice, which nutrition information they were looking for, etc. In-home self-administered questionnaire regarding nutritional knowledge, understanding of FOP labeling (GDA, TL, TL-CGDA), background variables (demographics, etc.). | 2,019 shoppers (74% female) recruited via retail store intercept (3 stores selected for different labeling schemes) participated in-store observations and interviews in UK; 921 who were observed returned the in-home questionnaire (81% female, mix of ages). | Understanding: For all label formats, most respondents did not have difficulties making inferences about the healthiness of food products; however, consumers may over interpret the severity of the red and amber colors. For GDA, number of correct answers rises with social grade. | 2.0 |
| Lin & Levy, 2010 U.S. | Study 1: Nutrient-specific FOPs :
Summary FOP:
Controls:
| Experimental tasks included choice between two products, product judgment and nutrient level ratings, and FOP scheme ratings. Three product categories tested including snacks, cereals, and main meals. | 2,424 participants recruited from convenience sample of U.S. online consumers. | Understanding: Nutrient-specific symbols more likely than summary symbols to result in selection of healthy product. Among the specific symbols, Nutrition Facts is most helpful. Nutrition Tips (a nutrient-based TL system) is more helpful than Smart Choices (a summary check-mark system), particularly for cereals. For example, cereals: 73% of respondents chose the healthier cereal using Nutrition Tips versus 51% for Smart Choices. | 4.0 |
| Lin & Levy, 2010 U.S. | Study 2: Nutrient-specific FOPs:
Summary FOPs:
Calorie count symbols:
Controls:
| Experimental tasks included two product choice tasks, product judgment, and nutrient level ratings, and FOP scheme ratings; Experimental factors included 4 food categories, 3 products in each category, objective nutrition profile (e.g., high, medium, low nested within category), product nutrition profile expectations: easy vs. hard choice, and choice scenario: health cued vs. no health cued. | 4,901 participants recruited from convenience sample of U.S. online consumers. | Understanding: FOP systems not able to inspire consumers to focus on nutrition when making product decisions. However, the Nutrition Facts label was able to do this. Performance scores on key dependent measures for percent healthy choices: mean 0.68 for NFP (p 0.05). This effect may be due to the prominence of the NFP in supermarkets compared with FOP labels. | 4.0 |
Studies cited in Table 5-5:
Andrews, C., & Burton, S. (2010). Are we making "smart choices" in evaluating front-of-package nutrition icons? Assessing effects of smart choices vs. traffic light-guideline daily amounts. Paper presented at the Marketing and Public Policy Conference, Chicago.
Borgmeier, I., & Westenhoefer, J. (2009). Impact of different food label formats on healthiness evaluation and food choice of consumers: A randomized-controlled study. BMC Public Health, 9, 184.
Edge, M. S. (2010). International Food Information Council Foundation front of pack labeling consumer research project. Consumer behavior research and front of package nutrition rating systems and symbols: What do consumers know, understand, and use? [PowerPoint Presentation]. Washington, DC.
Feunekes, G. I. J., Gortemaker, I. A., Willems, A. A., Lion, R., & van den Kommer, M. (2008). Front-of-pack nutrition labelling: Testing effectiveness of different nutrition labelling formats front-of-pack in four European countries. Appetite, 50(1), 57-70. doi:10.1016/j.appet.2007.05.009
Grunert, K., Fernández-Celemín, L., Wills, J., Storcksdieck genannt Bonsmann, S., & Nureeva, L. (2010). Use and understanding of nutrition information on food labels in six European countries. Journal of Public Health, 18(3), 261 277. doi:10.1007/s10389-009-0307-0
Grunert, K. G., Wills, J. M., & Fernández-Celemín, L. (2010). Nutrition knowledge, and use and understanding of nutrition information on food labels among consumers in the UK. Appetite, 55(2), 177 189. doi:10.1016/j.appet.2010.05.045
Jones, G., & Richardson, M. (2007). An objective examination of consumer perception of nutrition information based on healthiness ratings and eye movements. Public Health Nutrition, 10(03), 238 244. doi10.1017/S1368980007258513
Kelly, B., Hughes, C., Chapman, C., Louie, Jimmy C-Y, Dixon, H., Crawford, J., ... Slevin, T. (2009). Consumer testing of the acceptability and effectiveness of front-of-pack food labelling systems for the Australian grocery market Health Promotion International, 24(2), 120 129.
Lin, C-T. J., & Levy, A. (2010). Food and Drug Administration front-of-pack consumer research. Paper presented at the Institute of Medicine, Food and Nutrition Board.
Malam, S., Clegg, S., Kirwan, S., McGingal, S., & British Market Research Bureau (BMRB). (2009). Comprehension and use of UK nutrition signpost labelling schemes. Prepared for Food Standards Agency.
Maubach, N., Hoek, J., Gendall, P., & Hedderly, D. (2009). The effect of front-of-package nutrition information and product claims on consumers' attitudinal evaluations and choice behavior. Paper presented at the 2009 Marketing and Public Policy Conference.
National Heart Foundation of Australia. (2009). Australians and front of pack labelling: What we want, what we need. Retrieved from http://www.heartfoundation.org.au/SiteCollectionDocuments/Tick%20HeartFoundation%20Research%20Summary%20FOPL.pdf
Scott, V., & Worsley, A. F. (1994). Ticks, claims, tables and food groups: A comparison for nutrition labelling. Health Promotion International, 9(1), 27 37. doi:10.1093/heapro/9.1.27
Synovate. (2005a). Quantitative evaluation of alternative food signposting concepts: Report of findings. COI on behalf of the Food Standards Agency.
Which? (2006). Healthy signs? Campaign Report. London, United Kingdom.
Study Details
Perceived Ease of Understanding
Two studies measured consumers' perceived ease of understanding of specific label formats. When a four-country European study asked respondents to rate the ease of comprehension of alternative labels, multiple TL, stars, and smileys were rated most highly. Conversely, a health protection shield was perceived as more difficult to understand than the other labels tested (Feunekes et al., 2008-Study 1). In a two-country European study where respondents were shown pictures of a "shopping basket" of products and asked to rate the healthiest product, stars scored highest on comprehension, while the GDA scored lowest (Feunekes et al., 2008-Study 2).
Identification of Healthier Foods
Eighteen studies we reviewed assessed consumers' ability to understand different labeling schemes. Many studies provided some evidence that consumers were more likely to identify the healthier food product using TL labels compared with other labeling schemes tested. In a study conducted in the UK, participants were significantly more likely to identify correctly all of the nutrient levels for the FSA TL scheme (97%) compared with three variants of the GDA scheme (86 to 89%)(Which?, 2006). Among lower socioeconomic groups, the relative advantage of the FSA TL over a GDA scheme was even greater (90% versus 75%). In another study conducted in the UK where participants' eye movements were recorded while they indicated healthiness ratings, there was less error in perceived healthiness with the standard nutrition label including the TL (the standard refers to the standard EU nutrition label plus energy nutrient in kilojoules) than with just the standard label (Jones & Richardson, 2007).
In a German study, the TL yielded the highest percentage of correct choices (88.6%) when subjects were asked to identify which product was healthier (see Figure 5-1). Following the TL scheme in order of performance was the GDA schemecolor-coded (82.5%) and monochrome (81.4%), and a simple healthy choice tick (76.8%), and a no-label condition (72.1%) (Borgmeier & Westenhoefer, 2009). The relative ranking was similar for men, women, consumers with low and high education, and consumers with BMI below and above 25.
Figure 5-1. Percentage of German Customers Selecting the Healthier Product
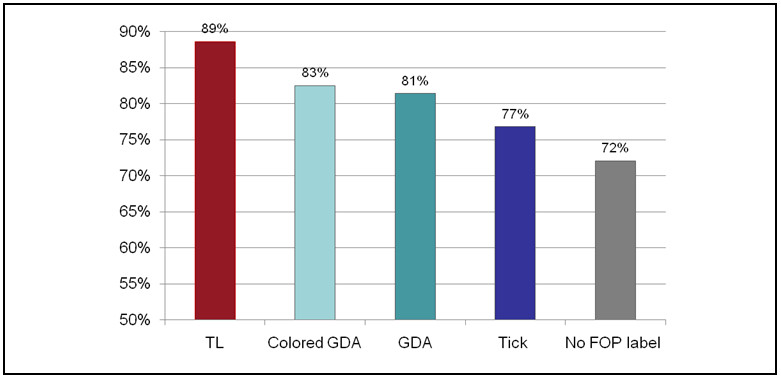 Adapted from: Borgmeier, I., & Westenhoefer, J. (2009). Impact of different food label formats on healthiness evaluation and food choice of consumers: A randomized-controlled study. BMC Public Health, 9, 184.
An Australian study found that consumers were significantly more likely to correctly identify the healthier food products with either of two versions of a TL system (81% and 78%) than with either a colored (70%) or monochrome (64%) %DI system (Kelly et al., 2009).
An experimental study conducted in the UK exposed study participants to images displaying fronts and backs of food products. Subjects were exposed to different FOP nutrition labels on the products and could also refer to the nutrition panel on the back of the products during tests. Subjects were asked whether a single product was high, low, or medium in specific nutrients. They were also asked which of two products contained the higher amount of negative nutrients (e.g., fat, saturated fat, salt, sugar). For an evaluation of the healthiness of an individual product, the multiple TLs scheme produced the greatest number of correct responses (p 0.05) across all ages and socioeconomic subgroups. However, when comparing two products, the colored GDA performed significantly higher than each of the other FOP concepts (p 0.05). Multiple TLs and monochrome GDA also performed strongly, but the color-coded GDA performed best for most demographic segments (Synovate, 2005a). It should be noted that this color-coded GDA scheme included text that corresponded to TL color-coding indicating "high," "medium," or "low" levels of negative nutrients. However, the color-coded GDA scheme tested in the Bogmeier and Westenhoefer (2009) study discussed earlier in this section did not perform as strongly in comparison to a TL label and, interestingly, did not include text.
In addition to the TL and colored GDA, two studies found that consumers were better able to identify the healthiest foods using other labeling schemes. A four-country European study found that smileys and stars were the best differentiators between healthy and less healthy product variants, and a health protection shield was the least (Feunekes et al., 2008-Study 1).
A multiple-part qualitative and quantitative study conducted a series of tests on consumers' comprehension of FOP labels by exposing participants to numerous schemes incorporating different combinations of TL, GDA, and text stating whether food was "high," "medium," or "low" in specific nutrients (e.g., calories, fat, saturated fat, sugar, and salt) (Malam et al., 2009). These results are summarized in Figure 5-2. The study found that the labels tested that incorporated "text" were the easiest to interpret among study participants. Consumers correctly identified the overall healthiness of a product when exposed to either the TL with text (71%) or the TL with text and GDA (70%) than to other labeling systems.
Figure 5-2. Percentage of UK Consumers Selecting the Healthier Product
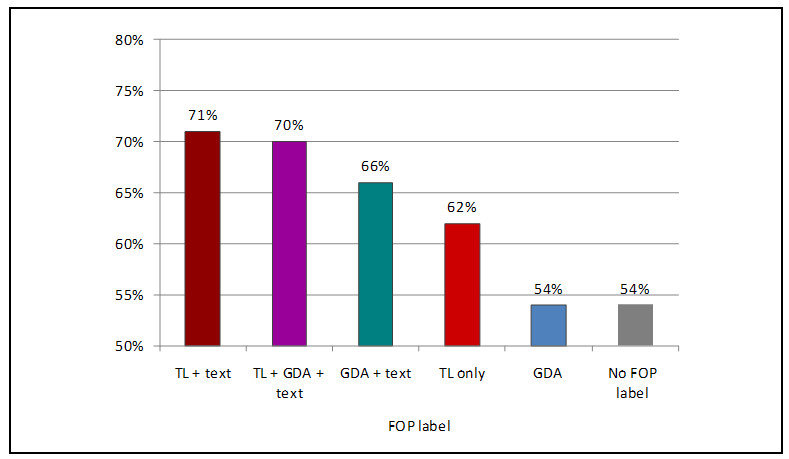 Adapted from: Malam, S., Clegg, S., Kirwan, S., McGingal, S., & British Market Research Bureau (BMRB). (2009). Comprehension and use of UK nutrition signpost labelling schemes. Prepared for Food Standards Agency.
This study also investigated the ability of customers to compare products when each product had a different type of label. Although there were no significant differences in the proportion who could select the healthier product between customers presented with mixed labels compared with customers presented the same label, comments from respondents suggested that customers could be frustrated by being asked to compare across different label formats. One woman said, "It's like speaking different languages...Where we've got different details, it's pretty confusing" (Malam et al., 2009, p. 131).
One study in Australia tested consumer understanding of the TL scheme, the %DI, the Heart Foundation Tick, and a label that used both the GDA plus the Heart Tick. The study found when placing these labeling schemes on food products in over nine food categories that the healthier food product was selected by 75.4% of consumers who viewed the TL label and 74.7% of consumers who saw the GDA system, compared with 71.7% of those who viewed the Heart Foundation Tick. In addition, consumers who saw a combination of the GDA and the Tick correctly identified 77.9% of nutrients on the label. In comparisons across individual food categories, consumers who saw the TL were significantly more accurate in identifying the healthier foods than those who saw only the Heart Foundation Tick for six of the nine nutrients (66.7%), significantly worse for one food (11.1%), and there was no difference for two other foods. The results for comparisons among the other labels, however, were relatively mixed (National Australian Heart Foundation, 2009).
In Zealand two experimental studies were conducted to test the effect of two FOP formats (e.g., %DI and TL) and three product claims (e.g., nutrition claim, health claim, and no claim) on cereal products with better versus worse nutritional content. The second experiment also tested an NIP (e.g., similar to the NFP in the U.S.) as a control for the study (Maubach, Hoek, Gendall, & Hedderley, 2009). An example of a nutrition claim tested stated, "a good source of Calcium-25% RDI per serve" and example of the health claim tested stated, "High in Calcium for increased bone mineral density-25% RDI per serve." The first study found that consumers who saw the TL label had more negative attitudes towards the cereal with worse nutritional content compared with consumers who viewed the %DI label. This study did not find an effect on product claims and consumers' attitudes. The authors speculated that consumers may not consider calcium an important nutrient to be included in cereal because cereal is normally consumed with milk. The second study tested the effects of variables from the first study on consumers' choice behavior to find slightly different results. First, product claims had the greatest effect on consumers' choice behavior. The authors noted that this was particularly the case for the %DI and nutrition information formats, suggesting that consumers rely less on numeric information and more on text to understand nutrition information. The study also found that the %DI label led consumers to evaluate the product more positively than the food label suggested. This finding suggests that the TL format provided greater utility for consumers compared with consumers who saw the %DI or NIP labels.
However, a two-country European study that tested a healthier choice tick, multiple choice ticks, stars, and GDA scores (e.g., %GDA + colors for energy, fat, saturated fat, sugar, and salt) found no consistent pattern in consumers' perceived healthiness of a product by label format (Feunekes et al., 2008-Study 2).
A recent study funded by the Grocery Manufacturers Association (GMA) conducted in the United States tested a series of FOP labeling schemes displaying the following: calories; calories and negative nutrients; calories and positive nutrients; calories, negative and positive nutrients; and no FOP label. The study found that more nutrients displayed on the FOP label did not interfere with consumers' understanding. In particular, positive nutrients displayed on the FOP label did not decrease consumers' understanding of negative nutrients, but fewer study participants were able to identify positive nutrients when only negative nutrients were displayed on the FOP label (Edge, 2010).
Two recent, but unpublished, U.S. studies found that in Internet panels, a nutrient-specific label system resulted in consumers correctly identifying a healthier product with greater accuracy than with a summary system (Lin & Levy, 2010; Andrews & Burton, 2010).
The FDA study by Lin and Levy (2010) found that in a large Internet panel of U.S. consumers, people were significantly more likely to select the healthy food product when they were exposed to a nutrient-specific symbol than a summary system. The system that obtained the highest proportion of correct response was a Nutrition Tips label concept that displayed total calories and four nutrients measured in grams indicated as high, medium, and low by text and corresponding TL colors. This symbol performed better than a Nutrition Highlights symbol that laid out, in various shades of green, both grams and the % RDA of six nutrients. Both nutrient-specific systems performed better than a Smart Choices check that also contained information about the calories and the number of servings per package. When study participants were asked to choose the healthier cereal product, 73% of respondents exposed to the Nutrition Tips TL system and 61% of respondents who viewed the Nutrition Highlights summary symbol made the correct choice. However, only 51% of respondents exposed to the Smart Choices check chose the healthier cereal. Nonetheless, all three FOP labels performed better than a no-label condition in which only 36% of respondents selected the healthier cereal product.
The study by Andrews and Burton (2010) may offer some insight about the conditions in which FOP labels contribute to consumer understanding. As illustrated in Figure 5-3, the study found that in an Internet panel of U.S. consumers whereby respondents were presented both the FOP label and the NFP, consumers exposed to the TL-GDA panel obtained modestly better scores in terms of the percentage of nutrients identified accurately (an increase of 2 to 3 percentage points) than with a Smart Choices check, and that both labels performed modestly better than a no-FOP label condition. However, when the package did not contain the NFP on the back of the package, which may better characterize the experience of a customer who is shopping quickly, there was a dramatic advantage to the TL system. Only about 55% of nutrients were correctly identified by consumers who were not provided the FOP label. The addition of the Smart Choices increased this percentage to about 60%, but the addition of the TL system with GDA raised accuracy to over 80%. The effects of the FOP labels were particularly great among consumers who were below the median in terms of health consciousness; in other words the FOP labels were most effective on the consumers who might be expected to benefit from them the most.
Figure 5-3. Percentage of U.S. Consumers Choosing the Healthier Product
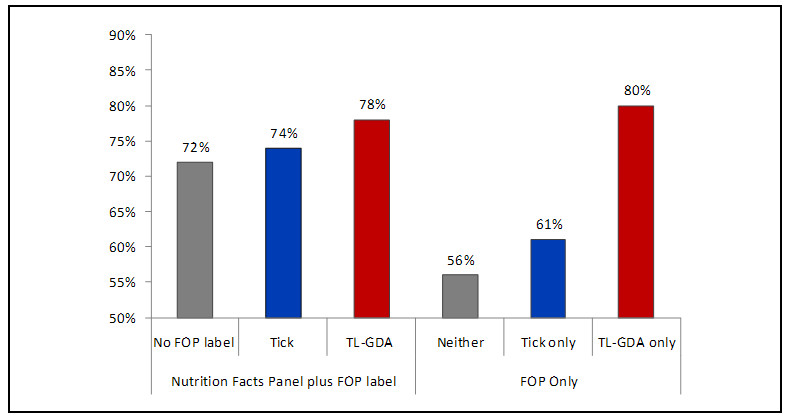 Adapted from: Andrews, C., & Burton, S. (2010). Are we making "smart choices" in evaluating front-of-package nutrition icons? Assessing effects of smart choices vs. traffic light-guideline daily amounts. Paper presented at the Marketing and Public Policy Conference, Chicago.
Understanding among Diverse Subpopulations
Four studies indicated that the TL scheme or schemes with TL colors were easily understood by consumers of low socioeconomic status, low education, or high BMI. For instance, one study found that 90% of those in lower socioeconomic groups were more likely to identify the healthier choice with the FSA TL scheme (Which?, 2006).
A study in Australia tested two variations of the TL and two variations of the %DI schemes (monochrome versus color coded) among customers selected from three tertiles in socioeconomic status. The study found that compared with the highest tertile of socioeconomic status, customers in the lowest tertile were significantly less able to identify healthy foods with the monochrome %DI scheme; in contrast, there was no significant difference between the performance of customers from the lowest and highest tertile with a TL system that also included an overall rating (Kelly et al., 2009).
Another study tested the GDA, TL, and TL-colored GDA and found that for the GDA label without TL colors the number of correct answers increased with social grade (Grunert, Wills, et al., 2010). Finally, a study comparing the TL with GDA variants and a simple tick found that the TL yielded the highest average of correct choices among subjects and there was no difference in understanding by label regarding individuals with different BMI and education status (Borgmeier & Westenhoefer, 2009).
One study did not support that the TL performed best among consumers of low socioeconomic status. An Australian study found that the TL, %DI, and Heart Foundation Tick were equally effective in helping consumers among various socioeconomic groups understand nutrition information (National Heart Foundation of Australia, 2009).
Several studies indicated that consumers among various subpopulations have more difficulty correctly understanding labels than other groups. An Australian study found that more older and less-educated respondents misinterpreted the labels presented (e.g., Heart Foundation Tick, healthy food pyramid, Food Standards Code traditional nutrition label, National Heart Foundation claim) compared with younger and more-educated respondents (p 0.05) (Scott & Worsley, 1994). Another study found that shoppers who were less educated, nonwhite, in lower social grades, or aged 65 or older had more difficulty making healthiness judgments for all labels studied. However, for those aged 65 or older the most difficulty was found in making healthiness judgments with the GDA scheme (Malam et al., 2009). Also regarding the GDA scheme, a study found that when respondents had to choose the healthiest product among three ready-to-eat meals using the GDA scheme the number of correct answers decreased with age and social grade but increased with interest in healthy eating. This same study indicated variation in understanding for the GDA label among consumers from different European countries, while a larger percentage than expected of Swedish consumers (approximately 40%) had difficulty interpreting the Keyhole symbol (Grunert, Wills, et al., 2010).
Evidence of Confusion in Interpreting FOP Labels
One study discussed above also found misinterpretation of the Heart Foundation Tick logo among respondents (although many were older and less educated) (Scott & Worsley, 1994). For instance, 50% of participants believed one should only eat foods indicated by labels to help prevent heart disease and a third believed it healthy to eat as many foods with the Tick logo as desired. Another study indicated that although many consumers easily understand the TL, they may over interpret the severity of the red and amber colors (Grunert, Wills et al., 2010). For example, 73% of respondents believed that they should try not to eat products indicated by red labels, whereas the FSA's definition is that it is fine to have products in red as a treat. A focus group study revealed that consumers in the Netherlands are confused about the meaning of the Choices logo. Participants did not understand why the same logo would be displayed on fresh vegetables as well as snacks (Vyth et al., 2009).
Additional Reference (Not Included in Evidence Tables):
Vyth, E., Steenhuis, I., Mallant, S., Mol, Z., Brug, J., Temminghoff, M., ... Seidell, J. (2009). A front-of-pack nutrition logo: A quantitative and qualitative process evaluation in the Netherlands. Journal of Health Communication, 14(7), 631 645.
5.1.4 Effects of Nutrition Labels on Likely Purchase Behavior
Overview
Section Highlights
- Consumers reported that they mostly use FOP labels to make purchase decisions when comparing products in the supermarket.
- Consumers generally do not find it important to use FOP labels for all food categories. They have already learned that some foods are healthy, and they buy other foods for other reasons such as taste.
- Studies suggest that among the FOP labels in the European marketplace, only a minority of consumers reported actually using FOP labels with most referring to the GDA label.
- Consumers who are less nutrition conscious, have low socioeconomic status, have higher BMI, or have young children living in their households tend to use FOP labels less often than other groups.
- On the contrary, consumers who are most likely to purchase foods with FOP labels tend to be consumers who are most interested in healthy eating.
- Evidence suggests that consumers have a greater preference for foods displaying FOP labels, in particular, the TL and Tick logo, and are willing to pay more for these foods.
- It should be noted that one UK study found a higher level of reported use of FOP labels compared with observed use of FOP nutrition information.
- Consumers are also likely to purchase healthy products indicated by the shelf labels.
- Nutrition-conscious consumers and those who have family members on special diets are more likely to use shelf-labeling systems compared with price-focused consumers.
Key Finding
The literature suggests that nutritious-conscious consumers are more likely than less nutrition-focused consumers, consumers of low socioeconomic status, or consumers with high BMI to purchase products indicated as "healthier" by FOP nutrition labels or shelf tags. There is limited evidence pointing to a specific FOP or shelf-tag design that would be most likely to influence consumers' purchase behavior.
This section reviews studies regarding consumers' reported use of FOP labels or nutrition shelf labels, as well as consumers' intentions to purchase foods indicated as "healthy" by FOP labels or shelf labels. We found six published data articles and one review article regarding effects on likely use and purchase behavior of FOP nutrition labels. In addition, we also found three published data articles and two studies in the grey literature on consumers' reported use and likely purchase behavior related to nutrition shelf labeling. Both studies in the grey literature were found in a response letter to Docket No. FDA-2010-N-0210 (DHHS, FDA, 2010) from the senior director and manager of the NuVal program. Tables 5-6 and 5-7 summarize studies on the effects of nutrition FOP and shelf labels on label use and purchase behavior, respectively.
| Study | Labels | Study Design | Sample Population | Results | Quality Score |
| Reid et al., 2004 Canada | Canada's Health Check logo | Cross-sectional interviewer-administered survey inquiring about grocery shoppers' demographics, diet-related health conditions, attitude toward healthy food purchases, use of food package information, and awareness, perceived value and reported use of Health Check logo. | 200 food shoppers in Ottawa, Canada; interviewer approached shoppers randomly in store. Mean age of shoppers was 44.3 years (SD 11.0); 77% female. | Awareness & use: Strong association between awareness and use of logo (ß = 0.81, p 0.001) and awareness of logo associated with overall use of food package information (ß = 0.14, p 0.05) and attitude toward healthy food purchases (ß = 0.15, p 0.05). | 2.0 |
| Green, 2006 England | FOP labels in UK | National survey conducted online by Harris Interactive from July 20-24, 2006, to inquire about consumer opinions regarding FOP labeling in England. | 2,052 adults. | Likely purchase behavior: 44% believed that FOP labeling has had no effect on their purchase decisions, while 43% of consumers believed that FOP labeling has changed many or some of the products they purchase. | 1.0 |
| Drichoutis et al., 2009 Greece |
| Experimental study where subjects bid on food products; Study consisted of 3 sets: Set 1: training set. Set 2: no label condition for 3 different food-away-from-home sandwiches; subjects shown and asked to taste each product. Set 3: six treatments that included different presentations of nutritional information and reference price information for same 3 food-away-from-home sandwiches (EU back of pack label, label with price, EU back of pack label, label without price, U.S. back of pack label with price, U.S. back of pack label without price, TL with price, TL without price). | 85 graduate and undergraduate students in Athens, Greece. Each subject participated in only one treatment. Size of group per treatment varied from 12 to 17 students. | Effects on likely purchase: Significant differences between different groups of nutritional information; for most models and products, subjects bid more for the EU and TL labels. Results of two models : EU label (p = 0.005; p = 0.005) and TL label (p = 0.011; p = 0.022) | 3.0 |
| Grunert, Fernández-Celemín, et al., 2010 UK, Sweden, France, Germany, Poland, Hungary | FOP labels in Europe including:
| In-store observation, in-store interview, and in-home questionnaire in six European countries. In UK and Sweden, 3 retailers x 3 locations x 6 product categories. In France, Germany, Poland, and Hungary, 2 retailers x 3 locations x 6 product categories. Use and understanding of GDA FOP nutrition labels measured via in-home questionnaire. Regarding understanding, subjects were presented with GDA and asked to indicate healthier food. When respondents were asked to choose the healthiest product for 3 ready meals, all products tested for all countries included the GDA label except Sweden. (In Sweden tested Keyhole label.) | For in-store observations and interviews, 2,019 shoppers recruited in UK, 1,858 Sweden, 2,337 France, 1,963 Germany, 1,800 Poland, and 1,804 Hungary. Subjects recruited via retail store intercept. Same respondents for the in-home questionnaires. However, return rates were 46% UK, 65% Sweden, 36% France, 42% Germany, 83% Poland, and 39% Hungary. Mix of social grades and ages. | Use of nutrition labels: Of 16.8% of shoppers who reported looking for nutrition information across the countries, most use GDA labels (in UK 40.5%, France 39.1%, and GER. 38.6%) or nutrition grid (other countries). Subjects did not consult TL, health logo, specific nutrition claims, or colored-GDA as frequently. Use increases with social grade (several p-values listed for different grades) and interest in healthy eating (p 0.0001). | 3.0 |
| Grunert, Wills, et al., 2010 UK |
| In-store observation of participants in aisle to determine if looked at nutrition label and time spent choosing product. After observation, subjects participated in an in-store interview to query about their determinants of choice, which nutrition information they were looking for, etc. and in-home self-administered questionnaire regarding nutritional knowledge, understanding of FOP labeling (GDA, TL, TL-CGDA), background variables (demographics, etc.). | 2,019 shoppers (74% female) recruited via retail store intercept (3 stores selected for different labeling schemes) participated in-store observations and interviews in UK; 921 who were observed returned the in-home questionnaire (81 % female, mix of ages). | Use among diverse subpopulations: People with less interest in healthy eating, higher BMI, and living with children under 16 years of age had lower uses of the nutrition labels. | 2.0 |
| Vyth, Steenhuis, Vlot, et al., 2010 The Netherlands | Choices logo | Questionnaire regarding familiarity with logo, reported logo use, motives for food choice. Respondents' groceries were also examined for presence of the logo. | 404 shoppers aged 18 to 84 years (79.2 % female, mean age 50 years, (+ 14.2); Subjects recruited in supermarkets located in different socioeconomic areas in the Netherlands. | Awareness: Familiarity with logo significant between different levels of education (p 0.01).Purchase behavior: Those with high and low education purchased fewer products with logo (p 0.01). Individuals who are health-conscious or weight conscious are more likely to purchase food with the logo. | 2.0 |
Studies cited in Table 5-6:
Drichoutis, A. C., Lazaridis, P., & Nayga Jr., R. M. (2009). Would consumers value food-away-from-home products with nutritional labels? Agribusiness, 25(4), 550 575.
Green, R. (2006). Green for go? Food Manufacture, 81(9), 48.
Grunert, K., Fernández-Celemín, L., Wills, J., Storcksdieck genannt Bonsmann, S., & Nureeva, L. (2010). Use and understanding of nutrition information on food labels in six European countries. Journal of Public Health, 18(3), 261 277. doi:10.1007/s10389-009-0307-0
Grunert, K. G., Wills, J. M., & Fernández-Celemín, L. (2010). Nutrition knowledge, and use and understanding of nutrition information on food labels among consumers in the UK. Appetite, 55(2), 177 189. doi:10.1016/j.appet.2010.05.045
Reid, R. D., Slovinec D'Angelo, M. E., Dombrow, C. A., Heshka, J. T., & Dean, T. R. (2004). The Heart and Stroke Foundation of Canada's Health Check Food Information ProgramModelling program effects on consumer behaviour and dietary practices. Canadian Journal of Public Health-Revue, 95(2), 146 180.
Vyth, E. L, Steenhuis, I. H. M., Vlot, J. A, Wulp, A., Hogenes, M. G, Looije, D. H, ... Seidell, J. C. (2010). Actual use of a front-of-pack nutrition logo in the supermarket: Consumers' motives in food choice. Public Health Nutrition, 13(11), 1882 1889. doi:10.1017/S1368980010000637
| Study | Labels | Study Design | Sample Population | Results | Quality Score |
| Hunt et al., 1990 U.S. | Brand-specific shelf labels (original multi-colored shelf labels were replaced in 1986 with labels of uniform color presenting messages: "low-fat," "low-sodium," "low-fat," low sodium," and "fat ratio OK") | Awareness of shelf labels for the Four Heart community program (consisting of shelf labels and supporting collateral) and their effect on likely purchase behavior was studied by conducting consumer interviews in yearly intervals over 4 years (1984 1988) | 1,807 individuals 18+ years of age recruited in store who had made purchases. | Likely purchase: Over the 4-year period, the percentage who reported being encouraged to purchase identified foods increased from 36 to 54%. | 1.0 |
| Schucker et al., 1992 U.S. | Brand-specific nutrition shelf tags identifying brands that have low levels of sodium, fat, and cholesterol | Evaluation of a 2-year (1984 1986) nutrition education program in Baltimore supermarket chain which included point of purchase brand-specific shelf labels and an explanatory booklet available in the supermarket check-out aisle. Effects evaluated in two parts: Part 1: Purchase behavior for 16 original food categories Part 2: Purchase behavior for 25 newly added food categories | All Baltimore-area Giant stores (n = 20, only 19 used for second evaluation). Previous to Baltimore, the program was carried out in Washington, DC, Giant stores treated as a control for this study (n = 20). Convenience sample of 100 shoppers per store through in-store interviews to collect information about shoppers who used labels. | Reported likely use of labels: Age and income weakly correlated with purchase behavior; reported label reading highest among those who were concerned about nutrition (52%) and those whose family members were on special diets (62%). | 2.0 |
| Lang et al., 2000 U.S. | M-Fit Supermarket Shelf-Labeling Program that uses color-coded shelf labels to identify foods as green "Best Choice" and yellow "Acceptable Choice"; foods identified by labels were low in total fat, saturated fat, cholesterol, sodium, and fiber | Cross-sectional study of consumers exiting 18 supermarkets in the Detroit area; 20 surveys from each store. M-Fit Supermarket program was also supported by promotional materials in the store including banners, posters, etc. | 361 participants (238 female, 241 African-Americans, mean age 51.6 +18.5 years). | Likely use: Reported use "often or always" by 17% of participants, "a little or sometimes" by 39%. | 1.0 |
| Affinnova, 2007 (NuVal, 2010) U.S. | NuVal (Overall score 1 to 100) | Messaging and communication of NuVal brand. (No additional information on study design presented.) | 454 female respondents, ages 35 to 64 years; all respondents expressed interest in healthy lifestyle. | Likely purchase: 75% of respondents who were surveyed believed that if they noticed a product they intended to purchase had a low rating that they thought should be higher, they would welcome higher-scoring alternatives suggested by information on a shelf label. | 1.0 |
| Affinnova, 2009 (NuVal, 2010) U.S. | NuVal (Overall score 1 to 100) | Consumers reviewed 8 different products within six categories; 1st comparison showed product images and prices and 2nd showed same product images and prices and NuVal scores. | Panel of 1611 consumers, ages 18 to 59, 78% female? | Likely Use: Consumers with health focus much more likely to be influenced by NuVal than those with a price focus. | 2.0 |
Studies cited in Table 5-7:
Hunt, M. K., Lefebvre, R. C., Hixson, M. L., Banspach, S. W., Assaf, A. R., & Carleton, R. A. (1990). Pawtucket Heart Health Program point-of-purchase nutrition education program in supermarkets. American Journal of Public Health, 80(6), 730 732. doi:10.2105/ajph.80.6.730
Lang, J. E., Mercer, N., Tran, D., & Mosca, L. (2000). Use of a supermarket shelf-labeling program to educate a predominately minority community about foods that promote heart health. Journal of the American Dietetic Association, 100(7), 804 809. doi:10.1016/s0002-8223(00)00234-0
NuVal (2010). [Response to Docket FDA-2010-N-0210].
Schucker, R. E, Levy, A. S., Tenney, J., & Mathews, O. (1992). Nutrition shelf-labeling and consumer purchase behavior. Journal of Nutrition Education, 24(2), 75 81.
Study Details
Use of FOP Food Labels When Shopping
Results of a UK study employing mixed methods, including observations of shoppers and in-store and in-home shopping bag audits, found a low level of observed use of FOP labels in the supermarket compared with reported use. Interestingly, the study also found that most shoppers using FOP labels use them to compare products, while fewer shoppers use FOP labels to make decisions regarding single products. This study also found that consumers were less likely to use FOP labels in their homes compared with when they are shopping. FOP users do not refer to information on FOP labels when purchasing food products they consider to be treats, repeat food purchases, or foods regarded as "healthy" (e.g., unprocessed vegetables) (Malam et al., 2009).
A Canadian study reporting the results of a survey of shoppers found a significant association between awareness and reported use of Canada's Health Check logo, an FOP symbol created by the Heart and Stroke Foundation of Canada (p 0.001) (Reid, Slovinec D'Angelo, Dombrow, Heshka, & Dean, 2004). Two European studies used a combined methods approach incorporating in-store observations, in-store interviews, and in-home questionnaires to learn about consumer use of FOP nutrition labels. One of these studies observed that 62.6% of shoppers looked at the front of food packages while shopping. However, only 16.8% of those shoppers reported they actually looked for nutrition information, most referring to the GDA label, nutrition grid (e.g., back-of-pack nutrition information), and ingredients list. Subjects did not consult the TL, health logo, colored GDA, or specific nutrition claims as frequently. Regarding consumer subgroups, reported use of nutrition information increased with social grade and interest in healthy eating (Grunert, Fernández-Celemín, et al., 2010). Another study found that consumers with higher BMI or who have children less than 16 years of age living in their homes had used the labels studied less frequently, which included the GDA, TL, and colored GDA. Interestingly, the study found that individuals in these groups were also those who had less interest in healthy eating (Grunert, Wills, et al., 2010).
FOP Labels Reported Use and Likely Purchase
Two empirical studies reported findings regarding consumers' likely purchase of products displaying FOP labels. A Dutch study evaluating the Choices logo found health-conscious or weight-conscious individuals to be more likely to purchase food with the logo (Vyth, Steenhuis, Vlot, et al., 2010). In a Greek experimental study, subjects were willing to pay more for sandwiches displaying the EU back-of-pack nutrition label and TL labeling scheme compared with products displaying the U.S. NFP or "no label" (Drichoutis, Lazaridis, & Nayga, 2009).
One article also reported evidence supporting consumers' likely purchase of products with FOP labels. Research conducted in Australia to evaluate the effect of the National Heart Foundation Tick program on sales showed that consumers' intentions to purchase a brand of cereal increased by 10% when the Tick logo was added to the label (Fear, Gibbons, & Anderson, 2004). When the full meaning of the label was explained to study participants, intent to purchase increased to 33%. Another article reporting results of a British poll conducted by Harris Interactive did not report as strong a finding. The poll found that 43% of consumers indicated that FOP labeling has changed many or some of the products they purchase, while 44% of consumers polled indicated FOP food labeling has not had an effect on the products they purchase (Green, 2006).
Shelf Labeling Reported Use and Likely Purchase
Two shelf-labeling studies found that many consumers are likely to purchase products marked as healthy or nutritious. For instance, one study conducted in the United States over a 4-year period found the percentage who reported being encouraged to purchase foods identified by brand-specific shelf tags increased from 36 to 54% (Hunt, Lefebvre, Hixson, Banspach, Assaf, & Carleton, 1990). Another study reported that 75% of respondents believed that if they noticed that a product they intended to purchase had a low nutrition rating they would welcome higher-scoring alternatives suggested by information on the shelf label (NuVal, 2010).
One study evaluated the effectiveness of the M-Fit Supermarket Shelf-Labeling Program, a system developed by dietitians at the University of Michigan Community Nutrition Education program for point-of-purchase interventions, that identified foods as green indicating "best choice" or yellow indicating "acceptable choice" (Lang, Mercer, Tran, & Mosca, 2000). This evaluation study took place in 20 Detroit-area supermarkets and found that 17% of participants reported using the system "often or always" and 39% reported using the system "a little or sometimes." A large portion of the subjects studied were African Americans.
Two studies analyzed consumers' demographic characteristics to determine if they were correlates of purchase behavior in response to nutrition shelf labels. One study found that age and income are weak correlates of purchase behavior, but that label reading was highest among those people who were concerned about nutrition (52%) and whose family members were on special diets (62%) (Schucker, Levy, Tenney, & Matthews, 1992). Finally another study reported that health-focused consumers are more likely to be influenced by the NuVal system than price-focused consumers (NuVal, 2010).
Additional Reference (Not Included in Evidence Tables):
Fear, T., Gibbons, C., & Anderson, S. (2004). The Heart Foundation's Tick Program. Driving innovation for a healthier food supply. Food Australia, 56(12), 599 600.
5.1.5 Effects on Purchases and Consumption
Overview
Section Highlights
- Studies on the effects of different types of FOP labels on purchase behavior are relatively limited and show mixed results.
- An industry study indicated that consumers who use FOP labels purchase products with less sodium and fat.
- However, another study found that the TL system did not lead consumers to purchase healthier foods.
- One study found that consumers who are more likely to purchase healthy foods indicated by FOP nutrition labels were more likely to be those consumers who are concerned about weight control and product information or have a medium education level.
- Four of five studies analyzing sales of shelf-tagged products also reported on consumers' purchase behavior, indicating increased sales of healthier food products.
- In terms of consumption:
- One study reported that consumers' consumption of fat decreased as a result of awareness of the Keyhole symbol, although this result was not true for less-educated consumers.
- Another study compared the healthy choice tick, multiple TL, monochrome daily amount, and colored %GDA labels to find that consumers' food consumption did not differ by labeling scheme.
- However, consumers with higher education, but not those with lower education, consumed more sodium when packages were labeled with the TL label and colored %GDA conditions.
- Canada's Health Check logo, Sweden's Keyhole symbol, and the Guiding Stars system in the United States were found to reduce consumers' consumption of negative nutrients (e.g., fat, calories, and sugar).
- However, a shelf-labeling study in the Netherlands failed to detect an effect of FOP labels on consumption of dietary fat, and another FOP study conducted in Germany did not find a difference in food consumption by study participants exposed to different labeling formats.
- Nonetheless, articles on aggregate sales of products receiving healthier scores on the basis of FOP labels suggest that labels can effect change, as discussed in a subsequent section on effects on producers and retailers.
Key Finding
As there were limited and mixed results of studies reporting on the effect of nutrition FOP or shelf labels on consumers' purchase behavior and consumption habits, there is not enough evidence to suggest whether or not simplified nutrition information leads consumers to decrease their consumption of negative nutrients or increase their consumption of positive nutrients.
This section reviews studies on consumers' purchase behavior and food consumption as a result of nutrition FOP labels and shelf tags. Our literature review uncovered five published data articles and two commentary articles regarding FOP effects on sales and consumption. Additionally, we found four published data articles and two studies in grey literature related to consumers' purchase behavior and consumption of products indicated by nutrition shelf labeling systems. Tables 5-8 and 5-9 summarize studies of the effects of nutrition FOP and shelf labeling, respectively, on purchases and consumption.
| Study | Labels | Study Design | Sample Population | Results | Quality Score |
| Larsson et al., 1999 Sweden | Keyhole symbol | Questionnaire collecting information on reported intakes of Keyhole-labeled low-fat and fiber-enriched foods. | Random sample of 1,591 Swedish participants aged 25 to 64 years (859 female). | Reported consumption: Those who had knowledge of the Keyhole symbol had significantly higher intakes of low-fat foods than those who did not have knowledge of the Keyhole. (males p = 0.044, females p 0.001). Interaction between education and knowledge of the symbol found for reported intake of low-fat marked foods. (p = 0.0088), meaning that the least educated consumers' knowledge of the Keyhole symbol did not have an effect on consumption of low-fat foods. | 2.5 |
| Reid et al., 2004 Canada | Canada's Health Check logo | Cross-sectional interviewer-administered survey inquiring about grocery shoppers' demographics, diet-related health conditions, attitude toward healthy food purchases, use of food package information, and awareness, perceived value and reported use of Health Check logo. | 200 food shoppers in Ottawa, Canada; interviewer approached shoppers randomly in store; mean age 44.3 years (SD 11.0); 77% female. | Effects on consumption: Individuals who purchased products with logo had lower fat diet (30.4% vs. 33.9% calories from fat; p 0.05). Strong association between awareness and use of logo (ß = 0.81, p 0.001) and awareness of logo associated with overall use of food package information (ß = 0.14, p 0.05) and attitude toward healthy food purchases (ß = 0.15, p 0.05). | 2.0 |
| Borgmeier & Westenhoefer, 2009 Germany |
| Randomized controlled trial using 5 experimental conditions of labels. Each subject participated in two tasks: Task 1-Subjects were shown photographed food cards and asked to identify the healthier food item in 28 pair-wise comparisons. Task 2-Simulated grocery shopping experience where subjects were shown 72 food cards simultaneously and asked to select foods and drinks they would like to consume the next day. | Convenience sample of 420 adults (mean age 36, 53.6% female) in Germany; 84 adults per condition. | Task 2: Envisioned daily food consumption (e.g., foods participants would like to consume the next day) did not differ significantly between the label formats. Significant interaction between label format and education for sodium intake (p 0.05). Higher sodium intake was associated with higher education in the TL label and colored GDA but lower education in the simple tick. | 4.5 |
| Sacks et al., 2009 UK | FOP TL | Sales data from major UK retailer examined to assess healthiness of foods purchased after introduction of TL label. Examined two product categories (ready-to-eat meals and sandwiches) sales 4 weeks before and after the introduction of the labeling scheme taking into account seasonality, product promotions, and product life cycle. Six ready-to-eat meal products and 12 sandwich lines were eligible for analysis. | NA | Effects on sales: Overall no effect on healthiness of food purchases; even though sales of ready-to-eat meals increased 2.4% after the introduction of the label, there was no association between the healthiness of the product and change in sales (p = 0.69). Cause of increased sales cannot necessarily be attributed to the TL label since products examined were also reformulated and the packaging and manufacturer changed. Sales of sandwiches did not change significantly. | 3.5 |
| Vyth, Steenhuis, Vlot, et al., 2010 The Netherlands | Choices logo | Questionnaire regarding familiarity with logo, reported logo use, motives for food choice; Respondents groceries were also examined for presence of the logo. | 404 shoppers aged 18 to 84 years (79.2% female, mean age 50 years, (+ 14.2). Subjects recruited in supermarkets located in different socioeconomic areas in the Netherlands. | Actual purchase of food with logo: Weight control (p = 0.017) and product information (p = 0.002) positive association with use of logo. Hedonism negatively associated with purchasing products with logo (p = 0.01).Purchase behavior: Those with high and low education purchased fewer products with logo (p 0.01). Individuals who are health-conscious or weight conscious are more likely to purchase food with the logo. | 2.0 |
Studies cited in Table 5-8:
Borgmeier, I., & Westenhoefer, J. (2009). Impact of different food label formats on healthiness evaluation and food choice of consumers: A Randomized-controlled study. BMC Public Health, 9, 184.
Larsson, I., Lissner, L., & Wilhelmsen, L. (1999). The "Green Keyhole" revisited: Nutritional knowledge may influence food selection. European Journal of Clinical Nutrition, 53(10), 776 780.
Reid, R. D., Slovinec D'Angelo, M. E., Dombrow, C. A., Heshka, J. T., & Dean, T. R. (2004). The Heart and Stroke Foundation of Canada's Health Check Food Information Program-Modelling program effects on consumer behaviour and dietary practices. Canadian Journal of Public Health-Revue, 95(2), 146 180.
Sacks, G., Rayner, M., & Swinburn, B. (2009). Impact of front-of-pack "traffic-light" nutrition labelling on consumer food purchases in the UK. Health Promotion International, 24(4), 344 352. 10.1093/heapro/dap032
Vyth, E. L, Steenhuis, I. H. M., Vlot, J. A, Wulp, A., Hogenes, M. G, Looije, D. H, ... Seidell, J. C. (2010). Actual use of a front-of-pack nutrition logo in the supermarket: Consumers' motives in food choice. Public Health Nutrition, 13(11), 1882 1889. doi:10.1017/S1368980010000637
| Study | Labels | Study Design | Sample Population | Results | Quality Score |
| Schucker et al., 1992 U.S. | Brand-specific nutrition shelf tags identifying brands that have low levels of sodium, fat, and cholesterol | Evaluation of a 2-year (1984 to 1986) nutrition education program in Baltimore supermarket chain that included point of purchase brand-specific shelf labels and an explanatory booklet available in the supermarket check-out aisle. Effects evaluated in two parts: Part 1: Purchase behavior for 16 original food categories Part 2: Purchase behavior for 25 newly added food categories | All Baltimore-area Giant stores (n = 20, only 19 used for second evaluation). Prior to Baltimore, the program was carried out in Washington, DC, Giant stores treated as a control for this study (n = 20). Convenience sample of 100 shoppers per store through in-store interviews to collect information about shoppers who used labels. | Impact on sales: Part 1: Market shares of shelf-tagged products increased 12% on average in 8 of 16 product categories (p 0.01). Part 2: Market shares of 10 of 25 categories had significant increases in market share of labeled products (only 4 categories with significant losses and 8 categories with stable market share p 0.05). | 2.0 |
| Steenhuis et al., 2004 The Netherlands | Shelf label indicating low-fat products (label consisted of logo, name of item, and indication that the product was a good low-fat choice) | 3-group randomized, pretest-posttest, experimental control group design. Total fat intake and behavioral determinants of eating less fat measured. Conditions included: no intervention control, educational program without labeling, and an extended with labeling program. | 2,203 consumers of 13 supermarkets (mean age 46 years, 80% female) in the Netherlands. Each supermarket assigned to one of the 3 conditions and participants recruited via store-intercept. | Reported consumption: No significant differences on total fat intake and behavioral determinants of eating less fat among the 3 conditions. Using individuals as unit for analysis, educational program without labeling had a significant effect on intention to eat less fat compared with the control (p 0.01). If used supermarkets as units, did not remain significant (p = .53). | 3.5 |
| Freedman & Connors, 2010 U.S. | "Fuel Your Life" shelf tag | 11-week quasi-experimental study to evaluate the Eat Smart point of purchase nutrition education program. Program material included the "Fuel Your Life" shelf tags, promotional poster in store window, and brochures describing the program. Seven food categories tagged; tagged foods had arbitrary nutritional criteria. | Studied one on-campus convenience store at a university in the U.S. | Impact on sales: No significant difference in sales between baseline and intervention. | 1.0 |
| Hannaford 12-month sales trends (Guiding Stars Licensing Company, 2010) U.S. | Guiding Stars (3-tiered star icon shelf label) | Analysis of Hannaford Supermarkets' sales from Sept. 2006 Sept. 2007 | NA | Within the first year of the program, sales of starred frozen dinners (increased by 56%) outsold frozen dinners without stars (increased only 5%), lean ground beef (increased 18%) versus fattier ground beef (decreased 5%), starred yogurts (increased 8%) versus nonstarred yogurts (decreased 5%), and skim milk (increased 1%) relative to whole milk (decreased 4%). | 1.0 |
| IRI, 2010 (NuVal, 2010) U.S. | NuVal (Overall score of 1 to 100) | Analysis of store purchase data (2008 2009) to assess the impact of the NuVal scores on shopper's buying behavior. | 2 retailer chains and 3 product categories. | Impact on Sales: For all product categories studied for retailer A: Volume sales grew more in products with better fitting nutrition. Among products with NuVal scores 50 100; volume sales % change 2008 vs. 2009 increased 29.2% yogurt, 20% bread/rolls, 5.2% cold cereal. It should be noted that the 3 product categories sales increased as a whole during the study period (10.4% yogurt, 6.2% bread/rolls, 2.2% cold cereal). For retailer B, sales volume also increased for higher rated NuVal products in all categories except cold cereal (decrease 1.63%, although closer inspection revealed that a cereal was discontinued and if excluded from the dataset healthier product sales volume increased 3.1%). Retailer A had larger sales volume increases for higher rated NuVal products compared with retailers who did not implement the NuVal system. (yogurt: 29% increase retailer A vs. 6.8% increases other retailers; bread/rolls: 20% increase vs. 13.8% other retailers; cold cereal: 5.2% increase vs. 13% decrease other retailers). Retailer B also surpassed competitors in healthier sales. | 1.0 |
| Sutherland et al., 2010 U.S. | Guiding Stars (3-tiered star icon shelf label) | Analysis of grocery store purchase data (2006 2008) at 1- and 2-year follow-up periods. Explored whether or not sales of portion of foods with shelf label increased and used ready-to-eat cereals data to explore effect on consumers' dietary intake. | 168 supermarkets in the Northeastern, U.S. which first implemented the Guiding Stars program. | Impact on sales: Purchase of starred items increased from 24.5% to 24.98% and 25.89% at the 1- and 2-year follow-up periods, respectively; 2-year difference = 1.39% increase. Sales of 1-star products increased significantly (p > 0.0001) from 9.54% to 10.37%, and sales of 2-star (+0.22%; p 0.05) and 3-star (+0.34%; p 0.01) products also significantly increased over the 2-year period. Regarding ready-to-eat cereal, for the second year studied (2008) products with stars increased by 1.67% (p > 0.001) and products without stars declined 2.21% (p > 0.001). It should be noted that between 2007 and 2008 the number of boxes of cereal purchased increased by 6.08%.Consumption effects: If take into consideration the shift of starred products versus no-star products purchased from 2007 2008, then changes in purchases result in significant decrease in added sugars (net decrease > 60,000 g) and increase in fiber (net increase > 19,474 g). | 3.0 |
Studies cited in Table 5-9:
Freedman, M. R., & Connors, R. (2010). Point-of-purchase nutrition information influences food-purchasing behaviors of college students: A pilot study. Journal of the American Dietetic Association, 110(8), 1222-1226. doi:10.1016/j.jada.2010.05.002
Guiding Stars Licensing Company (2010). [Response to Docket FDA-2010-N-0210].
NuVal (2010). [Response to Docket FDA-2010-N-0210].
Schucker, R. E, Levy, A. S., Tenney, J., & Mathews, O. (1992). Nutrition shelf-labeling and consumer purchase behavior. Journal of Nutrition Education, 24(2), 75 81.
Steenhuis, I., Assema, P. van, Breukelen, G. van, & Glanz, K. (2004). The effectiveness of nutrition education and labeling in Dutch supermarkets. American Journal of Health Promotion, 18(3), 221 224.
Sutherland, L. A, Kaley, L. A, & Fischer, L. (2010). Guiding Stars: The effect of a nutrition navigation program on consumer purchases at the supermarket. The American Journal of Clinical Nutrition, 91(4), 1090S-1094S. doi:10.3945/ajcn.2010.28450C
Study Details
FOP Effects on Purchases
Several studies in the literature reported findings on effects of FOP labels on purchases. Results of an empirical study analyzing a UK retailer's sales data found no effect on the healthiness of foods purchased after the introduction of the TL label (Sacks et al., 2009). One commentary article reported on an evaluation of a 6-week trial conducted by the Co-operative Group's food retail chain in six stores; it found that point-of-sale information indicating foods as high, medium, or low in fat and salt influenced consumers to purchase foods that were low in salt and fat. Specifically, the article reported that sales of low-sodium products were boosted by 10%, but the article did not report data on the effect of FOP labels on sales of low-fat products (Marketing, 2004). Another commentary article reported that Tesco, a grocery retailer in the UK, found that the GDA label led consumers to purchase low-fat ready-to-eat meals as opposed to high-fat ready-to-eat meals. The article did not report, however, on how these data were measured (Schor, Maniscalco, Tuttle, Alligood, & Kapsak, 2010).
Another study reported psychographic and demographic determinants affecting or not affecting purchases of foods with the Choices logo. This Dutch study observed shopper purchases to find that weight control and product information positively affected actual purchase of foods with the Choices logo, while hedonism is negatively associated with purchasing products with the logo. This study also reported that consumers with medium education levels purchased more foods with the Choices logo than consumers with high and low education levels (p 0.01) (Vyth, Steenhuis, Roodenburg, et al., 2010).
Shelf-Labeling Effects on Purchases
Four empirical studies indicated that shelf-labeling systems have positive effects on consumers' food purchases. One study measuring the effect of a brand-specific nutrition shelf-tags system found significant increases of market shares of many healthier shelf-tagged products (Schucker et al., 1992). Another study conducted by Hannaford supermarkets to evaluate the Guiding Stars program by analyzing 12-month sales trends found that sales of starred foods increased while sales of nonstarred foods decreased. Some of the foods that consumers had switched to as a result of the program included lean ground beef versus fattier ground beef and skim milk versus whole milk (Guiding Stars Licensing Company, 2010). The NuVal system was also found to change consumers' purchase behavior leading to healthier food choices. NuVal products scoring 50 to 100 outsold products with low scores (NuVal, 2010). Another study that analyzed the effect of purchases as a result of the Guiding Stars program found a 0.5 percentage point increase in sales of starred foods after 1 year and a 1.4 percentage point increase in sales of starred foods after 2 years (Sutherland, Kaley, & Fischer, 2010).
Although four studies indicated that nutrition shelf-labeling programs have positive effects on consumer purchase behavior, one study did not find this effect. The Eat Smart point-of-purchase nutrition program using the "Fuel Your Life" logo was implemented in a university convenience store, incorporating shelf tags and promotional materials such as posters, to find no significant difference in sales of healthier foods between baseline and intervention (Freedman & Connors, 2010).
FOP Effects on Consumption
One study reported a labeling scheme that positively affected consumers' food consumption, leading them to eat healthier foods. The study found that consumers who had knowledge of the Keyhole symbol had significantly higher intakes of low-fat foods than those who did not have knowledge of the symbol (Larsson et al., 1999). However one exception was reported awareness of the Keyhole symbol among the least educated consumers did not affect their reported consumption of low-fat foods. Another study conducted in Germany simulated a shopping experience where consumers were asked to select foods and drinks that they would like to consume the next day (Borgmeier & Westenhoefer, 2009). The study found that participants' envisioned daily food consumption or food that they had planned to eat the next day did not differ significantly among the label formats (simple healthy choice tick, multiple TL, monochrome GDA, colored GDA, and "no label"). However, when considering different demographic factors, higher sodium intake was associated with higher education in the TL label and colored GDA conditions.
Regarding Canada's Health Check logo, Canadian individuals who purchased products with the logo had lower fat diets than those individuals who did not purchase products with the logo (30.4% vs. 33.9% calories from fat; p 0.05) (Reid et al., 2004).
Shelf-Labeling Effects on Consumption
One study reported analysis of 4 weeks of ready-to-eat cereal sales data from one supermarket chain to find that the Guiding Stars program reduced grocery shoppers' consumption by more than 240,000 calories and 60,000 grams of sugar while increasing their intake of fiber to over 19,000 grams (Guiding Stars Licensing Company, 2010; Sutherland et al., 2010). Another unnamed shelf-labeling system that indicated low-fat products did not prove as successful as the Guiding Stars system. An experimental study evaluating this system measured consumers' total fat intake and their behavioral determinants of eating less fat but found no significant differences among the three conditions (e.g., educational program without labeling, educational program with labeling, and a no intervention control). Fat intake was measured by asking respondents about the frequency and quantity of food consumed (Steenhuis, van Assema, van Breukelen, & Glanz, 2004).
Additional References Not Included in Evidence Tables:
Marketing. (2004). Signposting set to hit food sale. Marketing (00253650). Retrieved from http://search.ebscohost.com/login.aspx?direct=true&db=bch&AN=15542715&site=ehost-live
Schor, D., Maniscalco, S., Tuttle, M. M., Alligood, S., & Reinhardt Kapsak, W. (2010). Nutrition facts you can't miss: The evolution of front-of-pack labeling: Providing consumers with tools to help select foods and beverages to encourage more healthful diets. Nutrition Today, 45(1), 22 32. doi:10.1097/NT.1090b1013e3181cb4561
5.1.6 Effects of FOP Labels on Diverse Subpopulations
Overview
Section Highlights
- It will be important to further assess the effects of FOP labels on diverse subpopulations, such as older adults, minority populations, groups lower in education or health literacy, consumers who are overweight or have other chronic conditions, and consumers with children.
- Many of the studies reviewed in earlier sections assessed effects on subpopulations.
- Results often indicated that older adults, less-educated consumers, and consumers with higher BMI have a preference for FOP labels that contain graphic elements or color-coding, such as the National Heart Foundation Tick logo and the TL label.
- Older adults, consumers with low-socioeconomic status, and nonwhite consumers had more difficulty understanding FOP labels than other groups.
- For consumers of low socioeconomic status and high BMI, labeling incorporating TL colors proved to be the easiest schemes to understand compared with other labels tested.
Key Finding
Although studies are somewhat limited, consumers among diverse subpopulations including older adults, consumers with low socioeconomic status, and consumers with high BMI, appear to more easily understand nutrition information on an FOP label that incorporates TL colors such as a TL or colored GDA. Text indicating "high," "medium," and "low" levels of nutrients is also an important FOP label element, in particular, for the color-blind population. Because many diverse subpopulations discussed in this section had more difficulty understanding FOP labels compared with other groups, it may be most effective to couple FOP labels with educational outreach programs targeting these populations.
Many of the studies reviewed above presented findings regarding various diverse subpopulations' response to FOP nutrition labels but only one shelf-labeling study reported on this topic. These studies were also presented in the respective sections above. Refer to the evidence tables in the respective sections above for specific details regarding diverse subpopulations.
Study Details
Liking and Preferences
Older Consumers
Older consumers like a tick logo and the TL scheme. A study in New Zealand found that more consumers aged 45 or older would like to see the National Heart Foundation's Tick logo on food packages compared with consumers younger than age 45 (Scott & Worsley, 1994). Another study in Belgium found that increasing age indicated a preference for the TL label compared with the GDA (Möser et al., 2010).
Less Well-educated Consumers
A New Zealand study revealed that less-educated consumers prefer the National Heart Foundation's Tick logo compared with more-educated consumers (Scott & Worsley, 1994).
Consumers with High BMI
A study in Belgium found that consumers with higher BMI indicated a preference for the TL compared with the GDA (Möser et al., 2010).
Understanding
Two studies found evidence of labels performing well for all demographic segments. One study indicated that the TL and colored-GDA performed well for all ages and socioeconomic subgroups, depending on the task performed (Synovate, 2005a). When consumers had to evaluate the healthiness of a single product, the TL produced the greatest number of correct responses, but when comparing two products, the color-coded GDA performed better for most demographic segments. Another study found that the TL, %DI, and the National Heart Foundation Tick were significantly equally effective in helping consumers among various socioeconomic groups choose healthier foods (National Heart Foundation of Australia, 2009).
Older Consumers
Three studies indicated that older respondents have more difficulty interpreting the GDA or National Heart Foundation Tick labels compared with younger respondents. For instance, one Australian study found that more respondents aged 45 or older misinterpreted the labels presented (e.g., National Heart Foundation Tick, healthy food pyramid, Food Standards Code traditional nutrition label, National Heart Foundation claim) compared with respondents younger than 45 (Scott & Worsley, 1994). Another study found that when respondents had to choose the healthiest product among three ready-to-eat meals using the GDA scheme, the number of correct answers decreased with age (Grunert, Wills, et al., 2010). Another study found that shoppers aged 65 or older had more difficulty than younger consumers in making healthiness judgments for all labels studied, but had the most difficulty in making healthiness judgments with the GDA scheme (Malam et al., 2009).
Consumers with Low Education Level/Low Socioeconomic Status
For those consumers in lower socioeconomic groups or who have lower education levels, two studies found that the TL label was the easiest label to understand compared with other labels (Borgmeier & Westenhoefer, 2009; Which?, 2006). Many other studies found that less-educated consumers or consumers from low social grades had more difficulty understanding FOP labels than consumers who were highly educated or from higher social grades. Labels that were difficult to interpret by these populations included the National Heart Foundation Tick, GDA scheme (particularly schemes without TL colors), and monochrome %DI scheme (Grunert, Wills et al., 2010; Kelly et al., 2009; Scott & Worsley, 1994).
Consumers with High BMI
A study comparing the TL to GDA variants and a simple tick found that the TL yielded the highest average of correct choices among subjects and there was no difference in understanding by label regarding BMI (Borgmeier & Westenhoefer, 2009).
Color-blind Consumers
A focus-group study conducted in the UK found that including text indicating high, medium, and low within TLs was necessary for understanding among color-blind consumers (Synovate, 2005b.).
Nonwhite Consumers
One study found that nonwhite consumers had more difficulty understanding FOP label formats compared with other consumers (Malam et al., 2009).
Effects on Likely Purchase and Use
Consumers with Low Education Level/Low Socioeconomic Status
A European study used a combined methods approach incorporating in-store observations, in-store interviews, and in-home questionnaires to learn about consumer use of FOP nutrition labels (Grunert, Fernández-Celemín, et al., 2010). Regarding consumer subgroups, reported use increased with social grade and interest in healthy eating.
Consumers with High BMI and Other Consumer Subgroups
Another study found that consumers with higher BMI or who have children younger than 16 years of age living in their homes had lower uses of labels studied (e.g., GDA, TL, and colored GDA) compared with those consumers who had an interest in healthy eating (Grunert, Wills et al., 2010). Another study evaluating the effectiveness of the M-Fit Supermarket Shelf-Labeling System, a color-coded shelf labeling system in the Detroit area, found that 56% of participants used the shelf labeling system at least a little or sometimes, and many of these participants were African Americans (although this study took place in an area where a large portion of the population was African American) (Lang et al., 2000).
Effects on Purchases and Consumption
Low-educated and High-educated Consumers
One study reported that consumers with low and high education levels purchased fewer foods with the Choices logo than consumers with medium education levels (Vyth, Steenhuis, Roodenburg, et al., 2010). Another study found that awareness of the Keyhole symbol among the least educated consumers' did not affect their reported consumption of low-fat foods (Larsson et al., 1999).
5.2 Studies of Producer and Retailer Response
Studies on producer and retailer response to nutrition FOP labels and shelf labels provided results on implementation experience and benefits to the producers and retailers as a result of the labels. Other studies analyzed sales data to discover how these nutrition systems affect sales and to discover effects on product reformulation and formulation that may or may not benefit producers and retailers. It should be noted that when reviewing the studies of producer and retailer response economic incentives vary depending on which group is discussed. These groups include branded food manufacturers that sell their products in a variety of grocery stores, private-label food manufacturers that sell their products in specific grocery stores, contract food manufacturers (sometimes called co-packers) that produce products for branded food companies under their branded labels and for retailers using their private-label brands, and retailers who sell branded and private-label products in their stores. Studies on producer and retailer response to FOP labels and shelf labels are summarized in Tables 5-10 and 5-11, respectively. The evidence tables present six empirical studies regarding FOP effects on producers and retailers and seven empirical studies regarding nutrition shelf-labeling effects on producers and retailers. Four of the shelf-labeling studies were obtained from the grey literature. In addition to the studies summarized in evidence tables in Section 5.2.2, Effects on Product Introduction and Reformulation, we discuss two additional commentary articles. In Section 5.2.3, Studies of Combined Consumer and Producer/Retailer response, we discuss one additional review article and two commentary articles.
| Study | Labels | Study Design | Sample Population | Results | Quality Score |
| Young & Swinburn, 2002 New Zealand | Pick the Tick logo (National Heart Foundation) | Evaluation of the impact of the Pick the Tick program on food reformulation. Food product reformulation records from July 1, 1998, to June 30, 1999, analyzed and changes in sodium levels multiplied by volume of sales and converted to salt in tons. | 55 food companies and 390 food products (15 breakfast cereals, 26 breads, and 12 margarines). | Reformulation: 10 out of 390 food products were reformulated (4 breakfast cereals, 3 breads, and 3 margarines). Breakfast cereals had the largest reduction of sodium (average of 378 mg/100 g or 61%), followed by bread (123 mg/100 g or 26%) and margarine (53 mg/100 g or 11%). In 1 year, Pick the Tick influenced companies to eliminate 33 tons of salt through reformulation and formulation of breads, breakfast cereals, and margarine. | 3.5 |
| Williams et al., 2003 Australia | Pick the Tick logo (National Heart Foundation) | Analysis of Kellogg's sales volume data (1997) to learn about the effect of the Pick the Tick program on food reformulation. | NA | Reformulation: 12 breakfast cereals reformulated (two-thirds of Kellogg's ready-to eat sales volume), reductions ranged from 85 to 479 mg sodium per 100 g (average reduction 40%). | 1.0 |
| Sacks et al., 2009 UK | FOP TL | Sales data from major UK retailer examined to assess healthiness of foods purchased after introduction of TL label. Examined two product categories' sales (ready-to-eat meals and sandwiches) 4 weeks before and after the introduction of the labeling scheme, taking into account seasonality, product promotions, and product life cycle. Six ready-to-eat meal products and 12 sandwich lines were eligible for analysis. | NA | Effects on sales: Overall no effect on healthiness of food purchases; Even though sales of ready-to-eat meals increased 2.4% after the introduction of the label, there was no association between the healthiness of the product and change in sales (p = 0.69). Cause of increased sales cannot necessarily be attributed to the TL label since products examined were also reformulated and the packaging and manufacturer changed. Sales of sandwiches did not change significantly. | 3.5 |
| Cobiac et al., 2010 Australia |
| Evaluated cost-effectiveness and health benefits of four salt reduction interventions including: 1) Voluntary Tick program; 2) Legislation requiring Tick; 3) Dietary advice for those at increased risk for cardiovascular disease (systolic blood pressure >115 mm Hg); 4) Dietary advice for those at high risk for cardiovascular disease (systolic blood pressure >140 mm Hg). | NA | Reformulation: The dietary advice interventions are not cost-effective strategies compared with programs to reduce sodium content in foods (both dietary interventions would avert less than 0.5% of disease burden associated with high sodium intake). The current voluntary Tick program in Australia is effective in reducing estimated sodium consumption from reductions in sodium content of foods (averting less than 1%DIsease burden) but government intervention to regulate salt content would achieve 20 times the health benefits for the Australian population (avert 18% of disease burden). | 1.0 |
| Van Camp et al., 2010 UK |
| Global New Products Database used to analyze packaged food products in the UK from 2002 to 2008; Foods were classified into groups as to whether targeted by FSA for FOP labeling or not and adoption of FOP labeling was compared between each group. | NA | Use: Increase in use of GDA and TL, and decline in other labels after 2005. GDA had a higher percentage of adoption in both targeted and nontargeted groups than other labels. | 4.0 |
| Vyth, Steenhuis, Roodenburg et al., 2010 The Netherlands | Choices logo | Questionnaire sent to producers regarding their products which carry the Choices logo. Asked to list products with logo and corresponding food categories and to answer questions regarding product compositions and reasons products had the logo. | 47 food companies (includes 1 retailer and 2 caterers) who were part of the Choices program in the Netherlands. All members of the program were contacted to participate (39.5% response rate). | Reformulation: Sodium significantly reduced in processed meats (p 0.01), sandwiches (p 0.05), soups (p 0.01), and sandwich fillings (p 0.05). Saturated fatty acids were significantly decreased in processed meats (p 0.05), dairy products (p 0.05), and sandwich fillings (p 0.01). Calories decreased significantly in dairy products (p 0.05) and sandwich fillings (p 0.01). Newly developed products also had healthier compositions; for example, sodium reduced in newly developed processed meats (p 0.01) and saturated fatty acids reduced in new dairy products (p 0.01). However, caloric values unchanged. | 3.5 |
Studies cited in Table 5-10:
Cobiac, L. J, Vos, T., & Veerman, J. L. (2010). Cost-effectiveness of interventions to reduce dietary salt intake. Heart. doi:10.1136/hrt.2010.199240
Sacks, G., Rayner, M., & Swinburn, B. (2009). Impact of front-of-pack "traffic-light" nutrition labelling on consumer food purchases in the UK. Health Promotion International, 24(4), 344 352. doi:10.1093/heapro/dap032
Van Camp, D. J., Hooker, N. H., & Souza Monteiro, D.M. (2009). UK food manufacturer responses to voluntary front of package nutrition schemes. Ohio State University, Department of Agriculture, Environmental and Development Economics Honor Theses.
Vyth, E. L, Steenhuis, I. H. M., Roodenburg, A. J. C., Brug, J., & Seidell, J. C. (2010). Front-of-pack nutrition label stimulates healthier product development: A quantitative analysis. International Journal of Behavioral Nutrition and Physical Activity 2010. 7(65), doi:10.1186/1479-5868-7-65
Williams, P., McMahon, A., & Boustead, R. (2003). A case study of sodium reduction in breakfast cereals and the impact of the Pick the Tick food information program in Australia. Health Promotion International, 18(1), 51 56. doi:10.1093/heapro/18.1.51
Young, L., & Swinburn, B. (2002). Impact of the Pick the Tick food information programme on the salt content of food in New Zealand. Health Promotion International, 17(1), 13 19. doi:10.1093/heapro/17.1.13
| Study | Labels | Study Design | Sample Population | Results | Quality Score |
| Schucker et al., 1992 U.S. | Brand-specific nutrition shelf tags identifying brands that have low levels of sodium, fat, and cholesterol. | Evaluation of a 2-year (1984 1986) nutrition education program in Baltimore supermarket chain that included point-of-purchase brand-specific shelf labels and an explanatory booklet available in the supermarket check-out aisle. Effects evaluated in two parts: Part 1: Purchase behavior for 16 original food categories, and Part 2: Purchase behavior for 25 newly added food categories. | All Baltimore-area Giant stores (n = 20, only 19 used for second evaluation); Previous to Baltimore, the program was carried out in Washington, DC, Giant stores treated as a control for this study (n = 20). Convenience sample of 100 shoppers per store through in-store interviews to collect information about shoppers who used labels. | Impact on sales: Part 1: Market shares of shelf-tagged products increased 12% on average in 8 of 16 product categories (p 0.01). Part 2: Market shares of 10 of 25 categories had significant increases in market share of labeled products (only 4 categories with significant losses and 8 categories with stable market share) (p 0.05). | 2.0 |
| Affinnova, 2007 (NuVal, 2010) U.S. | NuVal (Overall score 1 to 100) | Messaging and communication of NuVal brand. (No additional information presented regarding study design). | 454 female respondents, aged 35 to 64 years; all respondents expressed interest in healthy lifestyle. | Benefits to retailers: 65% completely or somewhat agree that they are more likely to shop at store with NuVal system. | 1.0 |
| Affinnova, 2009 (NuVal, 2010) U.S. | NuVal (Overall score 1 to 100) | Consumers reviewed 8 different products within six categories; 1st comparison showed product images and prices and 2nd showed same product images and prices and NuVal scores. | Panel of 1,611 consumers, aged 18 to 59 years, 78% female. | Benefits to retailers/producers: NuVal affects the choice of retailer. 32% all consumers studied and 43% health conscious consumers prefer to shop at store that uses NuVal. Private-label products are more sensitive to NuVal than national products (share lifts in preference or intent to buy for private label products with NuVal had scores 3 5 points higher than national brand equivalent). | 2.0 |
| Freedman & Connors, 2010 U.S. | "Fuel Your Life" shelf tag | 11-week quasi-experimental study to evaluate the Eat Smart point-of-purchase nutrition education program. Program material included the "Fuel Your Life" shelf tags, promotional poster in store window, and brochures describing the program. Seven food categories tagged; tagged foods had arbitrary nutritional criteria. | Studied one on-campus convenience store at a university in the U.S. | Impact on sales: No significant difference in sales between baseline and intervention. | 1.0 |
| Hannaford's 12-month sales trends (Guiding Stars Licensing Company, 2010) U.S. | Guiding Stars | Analysis of Hannaford Supermarkets' sales from Sept. 2006 to Sept. 2007. | NA | Within the first year of the program, sales of starred frozen dinners (+56%) out sold frozen dinners without stars (+5%), lean ground beef (+18%) relative to fattier ground beef (-5%), starred yogurts (+8%) compared with nonstarred yogurts (-5%), and skim milk (1%) relative to whole milk (-4%). | 1.0 |
| IRI, 2010 (NuVal, 2010) U.S. | NuVal (Overall score of 100) | Analysis of store purchase data (2008 2009) to assess the impact of the NuVal scores on shoppers' buying behavior. | 2 retailer chains (A and B) and 3 product categories. | Impact on sales: For retailer A: for all product categories studied, volume sales grew more in products with scores 50 to 100 compared with lower scoring products. Among products with NuVal scores 50 100, volume sales increased from 2008 to 2009 by 29.2% for yogurt, 20% for bread/rolls, and 5.2% for cold cereal. The sales of the 3 product categories increased as a whole during the study period (10.4% yogurt, 6.2% bread/rolls, 2.2% cold cereal). For retailer B, sales volume also increased for higher rated NuVal products in all categories except cold cereal (decrease of 1.63%, although a cereal had been discontinued but if this was excluded from the dataset then healthier product sales volume increased by 3.1%). Retailer A had larger sales volume increases for higher rated NuVal products compared with retailers who did not implement the NuVal system (yogurt: 29% increase retailer A vs. 6.8% increases other retailers; bread/rolls: 20% increase vs. 13.8% other retailers; cold cereal: 5.2% increase vs. 13% decrease other retailers). Retailer B also surpassed competitors in healthier sales. | 1.0 |
| Sutherland et al., 2010 U.S. | Guiding Stars (3-tiered star icon shelf label) | Analysis of grocery store purchase data (2006 2008) at 1- and 2-year follow-up periods. Explored whether sales of portion of foods with shelf label increased and used ready-to-eat cereals data to explore effect on consumers' dietary intake. | 168 supermarkets in the Northeastern U.S., which first implemented the Guiding Stars program. | Impact on sales: Purchase of starred items increased from 24.5% to 24.98% and 25.89% at the 1- and 2-year follow-up periods, respectively; the 2-year increase was 1.39%. Sales of 1-star products increased significantly (p > 0.0001) from 9.54% to 10.37%, and sales of 2-star (+0.22%; p 0.05) and 3-star (+0.34%; p 0.01) products also significantly increased over the 2-year period. Regarding ready-to-eat cereal, for the second year studied (2008) products with stars increased by 1.67% (p > 0.001) and products without stars declined 2.21% (p > 0.001). It should be noted that between 2007 and 2008 the number of boxes of cereal purchased increased by 6.08%. | 3.0 |
Studies cited in Table 5-11:
Freedman, M. R., & Connors, R. (2010). Point-of-purchase nutrition information influences food-purchasing behaviors of college students: A pilot study. Journal of the American Dietetic Association, 110(8), 1222-1226. doi:10.1016/j.jada.2010.05.002
Guiding Stars Licensing Company (2010). [Response to Docket FDA-2010-N-0210].
NuVal (2010). [Response to Docket FDA-2010-N-0210].
Schucker, R. E, Levy, A. S., Tenney, J., & Mathews, O. (1992). Nutrition shelf-labeling and consumer purchase behavior. Journal of Nutrition Education, 24(2), 75 81.
Sutherland, L. A, Kaley, L. A, & Fischer, L. (2010). Guiding Stars: The effect of a nutrition navigation program on consumer purchases at the supermarket. The American Journal of Clinical Nutrition, 91(4), 1090S-1094S. doi:10.3945/ajcn.2010.28450C
5.2.1 Producer and Retailer Implementation Experience and Marketing
Overview
Section Highlights
- Two studies of the NuVal system suggested that summary shelf-tag systems are beneficial to producers and retailers:
- Both studies found that consumers, particularly health-conscious consumers, reported that they prefer to shop at stores with summary shelf-tag systems.
- One study found that a summary shelf-tag system provides private-label brands with increased brand equity (e.g., increased value). This finding would be very enticing for many retailers offering private-label brands since they are a significant portion of their profits (Brandchannel, 2010).
- Under a voluntary system in the UK, a study conducted in 2008 found that 55% of products targeted by the FSA had some type of FOP labeling scheme. For producers who incorporated FOP schemes, they chose schemes they perceived as the least costly and/or least confusing for their customers.
Key Finding
Nutrition shelf tags appear to enhance the value of the products that carry them and the stores which carry these products, leading to increased sales for the producer and retailer. However, it should be noted that studies are limited regarding producer/retailer implementation experience; in particular, only one study in our review discussed producer FOP label implementation experience as opposed to experience with nutrition shelf tags.
We found one empirical study regarding producers' FOP labeling implementation experience in the UK. Two other studies were found in the grey literature that presented potential benefits to producers and retailers regarding the NuVal system. Studies in the grey literature were reported in a response letter to Docket FDA-2010-N-0210 (DHHS, FDA, 2010) from the senior director and manager of the NuVal program.
Study Details
One study conducted in the UK analyzed the response of producers after a call for voluntary FOP labeling (Van Camp, Hooker, & Souza Monteiro, 2010). The results of the study found that 55% of "targeted" products released in 2008 had some type of FOP labeling compared with 27% of "nontargeted" products. Targeted products refer to products targeted by the FSA for TL labeling. The study also found that among companies using FOP nutrition labeling, GDA labeling was more widely adopted than the TL system. The author believed that the decision for companies adopting this scheme may be because the EU commission supports a scheme similar to the GDA scheme. Producers wanted to eliminate extra costs and consumer confusion. However, the author also suggested that the TL scheme may put more pressure on food companies to reformulate products compared with GDA, which could be more costly.
Two studies suggested that retailers who implement the NuVal system in their stores will have a competitive advantage. One study conducted in 2007 by Affinnova, a market research company, found that 65% of consumers completely or somewhat agree that they are more likely to shop at stores with the NuVal system (NuVal, 2010-Affinnova 2007). Affinnova also conducted another study in 2009 on behalf of NuVal and reported that 32% of all consumers studied and 43% of health-conscious consumers prefer to shop at a store that uses NuVal (NuVal, 2010-Affinnova 2009).
The Affinnova 2009 study also found that the NuVal system may be beneficial to retailers who offer private-label brands and other producers of private-label products. One study found that private-label products are more sensitive to NuVal score changes than national-brand products; when consumers were given a choice between a national brand without a NuVal score and the private-label equivalent with a NuVal score 3 to 5 points higher, their intent to buy the private-label option increased relative to the national-brand option (NuVal, 2010-Affinnova 2009).
5.2.2 Effects on Product Introduction and Reformulation
Overview
Section Highlights
- Although the number of studies is limited, analysis of products before and after implementing FOP labeling suggests that the introduction of FOP labeling has led producers to reformulate foods and formulate new food products that have healthier nutrient composition.
- In the Netherlands, these changes have had considerable effects in prompting the introduction of products that are lower in sodium and saturated fat.
- In Australia and New Zealand, new or reformulated products were substantially lower in sodium.
Key Finding
All of the studies we reviewed that report findings on new product introductions or reformulations after the introduction of FOP labeling in several countries found that FOP labeling leads producers to reformulate existing products or formulate new products to have healthier compositions. Most of these studies analyzed product compositions after the introduction of check-mark symbols.
Five articles we reviewed provide evidence that FOP labeling schemes have led producers to reformulate existing products or formulate new products to offer healthier food products (Three of these studies provide empirical evidence and two are commentary articles). Another empirical study uncovered in our literature review considered potential health benefits because of reformulation or introduction of healthier products as a result of a voluntary versus required participation in an FOP labeling program.
A study conducted in the Netherlands found that when manufacturers implemented the Choices logo, they reduced sodium, saturated fats, and calories significantly in many products (Vyth, Steenhuis, Roodenburg, Brug, & Seidell, 2010). Figures 5-4 and 5-5 demonstrate the reduction of sodium and saturated fatty acids in 11 processed meats, and Figure 5-6 demonstrates the reduction of caloric content in dairy products as a result of product reformulations in response to the Choices logo.
Figure 5-4. Mean Sodium Content for Processed Meats Before and After Implementing the Choices Logo (mg/100 g)
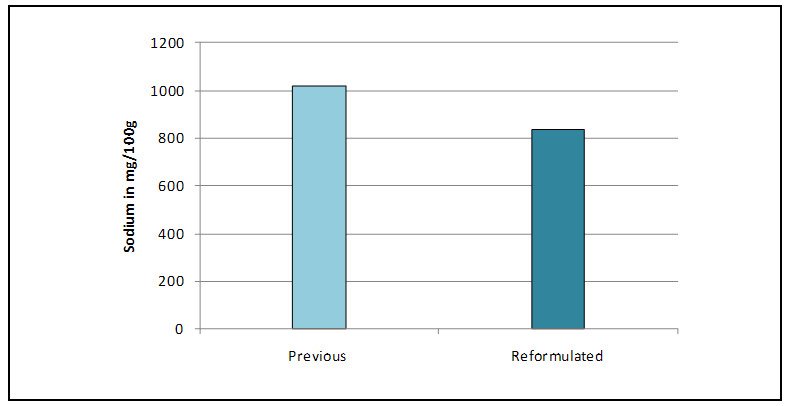 Adapted from: Vyth, E. L, Steenhuis, I. H. M., Roodenburg, A. J. C., Brug, J., & Seidell, J. C. (2010). Front-of-pack nutrition label stimulates healthier product development: a quantitative analysis. International Journal of Behavioral Nutrition and Physical Activity 2010, 7(65), doi:10.1186/1479-5868-7-65
Figure 5-5. Mean Saturated Fatty Acid Content for Processed Meats Before and After Implementing the Choices Logo (g/100 g)
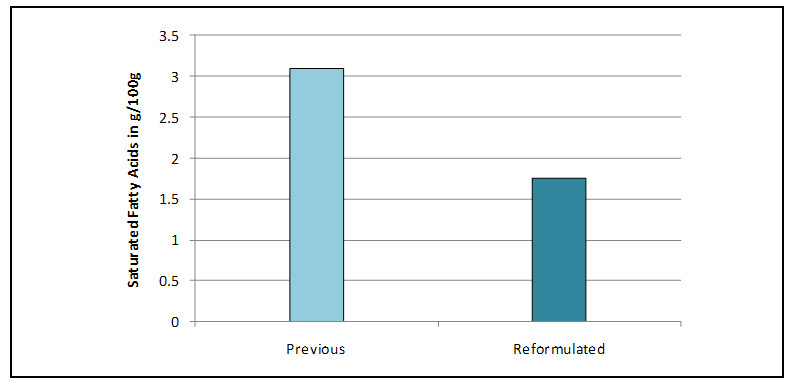 Adapted from: Vyth, E. L, Steenhuis, I. H. M., Roodenburg, A. J. C., Brug, J., & Seidell, J. C. (2010). Front-of-pack nutrition label stimulates healthier product development: a quantitative analysis. International Journal of Behavioral Nutrition and Physical Activity 2010, 7(65), doi:10.1186/1479-5868-7-65
Figure 5-6 Mean Caloric Content for Dairy Products Before and After Implementing Choices Logo (kcal/100 g)
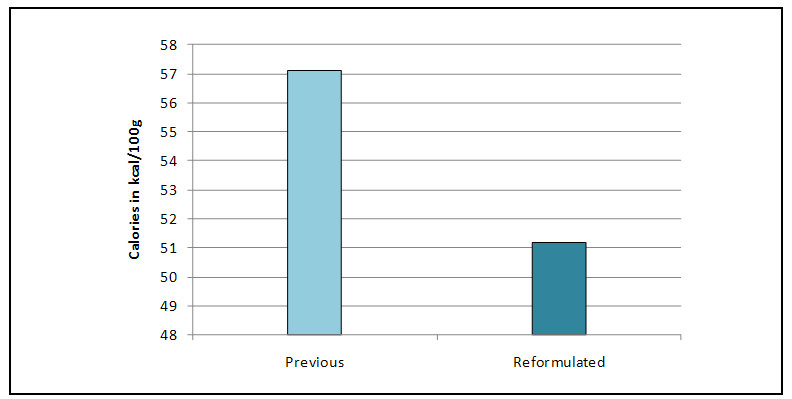 Adapted from: Vyth, E. L, Steenhuis, I. H. M., Roodenburg, A. J. C., Brug, J., & Seidell, J. C. (2010). Front-of-pack nutrition label stimulates healthier product development: a quantitative analysis. International Journal of Behavioral Nutrition and Physical Activity 2010, 7(65), doi:10.1186/1479-5868-7-65
In addition to food reformulations as a result of the introduction of the Choices logo, newly developed products also had healthier compositions. For example, sodium was reduced in newly developed processed meats, and saturated fats were reduced in newly developed dairy products (Vyth, Steenhuis, Roodenburg, et al., 2010).
Another study conducted in New Zealand measuring the effectiveness of the National Heart Foundation's Pick the Tick program found it led producers to eliminate 33 tons of salt in newly formulated and reformulated foods (Young & Swinburn, 2002). Ten products were reformulated, and 13 products were estimated to be formulated after implementing the Tick logo. Regarding the reformulated products, breakfast cereals had the largest reduction of sodium (average of 378 mg/100 g or 61%), followed by bread (123 mg/100 g or 26%) and margarine (53 mg/100 g or 11%). Another study also assessed the impact of the Pick the Tick program, but this time in Australia (Williams et al., 2003). Kellogg's ready-to-eat cereal sales data were analyzed to find that 12 breakfast cereals were reformulated (approximately two-thirds of their ready-to-eat cereal sales volume), to have reduced sodium content, ranging from 85 to 470 mg of sodium per 100 g or an average reduction of 40%.
Two commentary articles describe instances of product reformulation as a result of FOP labels. One article mentioned the Tick program in Australia discussed above, suggesting it led to a 50% reduction of sodium in the lunch meat category. The logo has led to increased market competition for healthier products in the mayonnaise and salad dressing category; now this food category in Australia has 18 products with two-thirds of products containing less than 1,000 mg/100 g of sodium (Fear et al., 2004). In the UK, color-coded labeling schemes such as Sainsbury's Wheel of Health are stimulating retailers to reformulate products to be healthier. For example, a retailer's "Chicken and Bacon Pasta Bake" changed from three red signals to one signal, increasing the amount of chicken and reducing the amount of sauce in the product (Lobstein & Davies, 2008).
A study in Australia analyzed and compared the cost-effectiveness and health benefits of four interventions including the current voluntary Tick program, a legislation requiring all Australian producers to follow Tick program requirements, and dietary advice for those at increased risk (e.g., systolic blood pressure >115 mm Hg) and high risk for cardiovascular disease (e.g., systolic blood pressure >140 mm Hg). Interestingly, programs to reduce sodium content of foods were more cost-effective than the dietary advice interventions. Additionally, this study suggested that a government intervention requiring producers to meet Tick program sodium requirements would avert 18% of the disease burden associated with high sodium intake compared with averting 1% for the voluntary tick program in Australia (Cobiac, Vos, & Veerman, 2010).
Additional References Not Included in Evidence Tables:
Fear, T., Gibbons, C., & Anderson, S. (2004). The Heart Foundation's Tick Program. Driving innovation for a healthier food supply. Food Australia, 56(12), 599 600.
Lobstein, T, & Davies, S. (2008). Defining and labelling "healthy" and "unhealthy" food. Public Health Nutrition, 12(03), 331 340. doi:10.1017/S1368980008002541
5.2.3 Studies of Combined Consumer and Producer/Retailer Response
Overview
Section Highlights
- The combined effects of FOP nutrition labels and shelf labels on both consumers and producers and retailers can, perhaps, most clearly be seen in terms of product sales.
- Six of eight empirical studies suggest that food products indicated as "healthy" by FOP nutrition schemes or shelf labels will likely increase product sales, implying that producers implementing these systems will probably profit.
- Although this increase is modest, perhaps in the range of 1 to 2%, the effect was greater after 2 years than after 1 year, suggesting the effects of nutrition labeling may increase over time.
Key Finding
Although the number of studies on consumer and producer/retailer response to nutrition FOP and shelf tags is somewhat limited, most of the studies reviewed on this topic reported that nutrition FOP labels and shelf tags encourage consumers to purchase healthier products; thus, these types of systems may be beneficial to the producers and retailers who implement them.
This section discusses nutrition FOP and shelf labels' effects on sales from the combined perspective of consumers, producers, and retailers. Since many of the studies discussed in this section also indicate effects on consumers' purchase behavior, they were also discussed in Section 5.1.5 of the report, and to avoid repetition, those findings were earlier summarized in Tables 5-9 to 5-11. Indeed, because sales reflect an effect on both consumers and on retailers and producers, some researchers have placed them in a framework of joint effects on consumers and producers and retailers (Grunert & Wills, 2007).
Information on changes in sales of traditional, new, and reformulated products also addresses the combined effects of FOP labels (discussed earlier in Section 5.2.2) on the response of consumers, producers, and retailers. However, most experimental studies have tended to isolate specific components or effects of FOP labeling to study. As a result, broader combined studies still need to be conducted.
Study Details
FOP Nutrition Labeling Effects on Purchases and Sales
One empirical study reported on FOP labels' effects on sales, while one review article and two commentary articles also reported findings on this topic. Results of an empirical analysis of a UK retailer's sales data indicated no effect on healthy food sales after the introduction of the TL label (Sacks et al., 2009). However, a review article (Grunert & Wills, 2007) reported that in two studies in UK supermarket chains, sales of healthy food increased after the introduction of FOP labels, indicating positive implications for producers of these products. Another study found that by introducing FOP labels, sales of low-sodium products increased 10%, while sales of high-sodium products decreased by 5% (Marketing, 2004). A retailer in the UK discovered that by introducing the GDA labeling scheme, sales of low-fat, ready-to-eat meals increased significantly, and sales of higher fat ready-to-eat meals declined (Schor et al., 2010).
Shelf Labeling Effects on Purchases and Sales
Four of five studies reported that retailers and producers who offer products indicated as healthy by nutrition shelf-labeling systems will likely profit. However, one of five evaluation studies did not find a change in sales of products marked as healthy by shelf labels between baseline and intervention. This study evaluated the Eat Smart point-of-purchase nutrition program, incorporating shelf tags with the phrase "Fuel Your Life" that indicated healthy foods. It should be noted that this program was only tested in one convenience store on a college campus (Freedman & Connors, 2010).
Four studies conducted in the United States measured the effect of sales of products indicated with a positive rating on an FOP shelf label. Pairs of related studies conducted with two retailers indicated that products scoring highly (50 to 100) by the NuVal rating system produce higher sales (NuVal, 2010-IRI). Similarly, a study measuring the effect of a brand-specific nutrition shelf-tags system found significant increases in market shares of many healthier shelf-tagged products (Schucker et al., 1992).
Finally, two U.S. studies assessed the effects of the Guiding Stars program on increased sales. One study found that within the first year of the program sales of starred frozen dinners and starred yogurts had outsold products without stars (Guiding Stars Licensing Company, 2010-Hannaford's 12-month sales trends). A second study found a 0.5 percentage point increase in sales of starred foods after 1 year and a 1.4 percentage point increase in sales of starred foods after 2 years (see Figure 5-7) (Sutherland et al., 2010).
Figure 5-7. Percentage Change in Sales of Starred Foods After the Introduction of Guiding Stars in Hannaford's Supermarkets
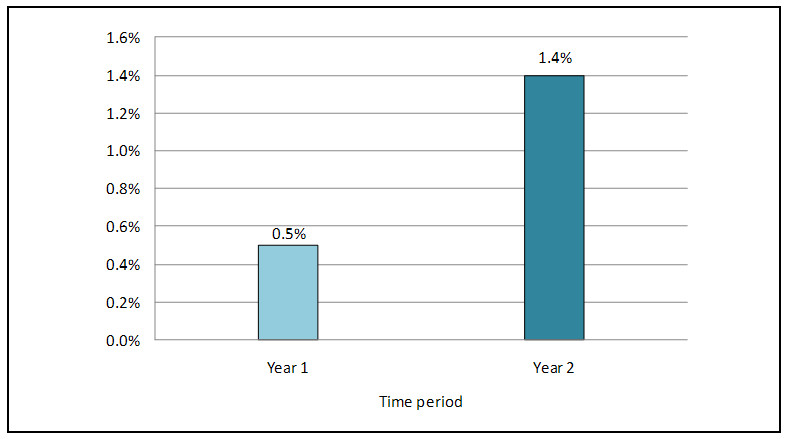 Adapted from: Sutherland, L. A, Kaley, L. A, & Fischer, L. (2010). Guiding Stars: the effect of a nutrition navigation program on consumer purchases at the supermarket. The American Journal of Clinical Nutrition, 91(4), 1090S-1094S. doi:10.3945/ajcn.2010.28450C
Additional References Not Included in Evidence Tables:
Grunert, K., & Wills, J. (2007). A review of European research on consumer response to nutrition information on food labels. Journal of Public Health, 15(5), 385 399. doi:10.1007/s10389-007-0101-9
Marketing. (2004). Signposting set to hit food sale. Marketing (00253650), Retrieved from http://search.ebscohost.com/login.aspx?direct=true&db=bch&AN=15542715&site=ehost-live
Schor, D., Maniscalco, S., Tuttle, M. M., Alligood, S., & Reinhardt Kapsak, W. (2010). Nutrition Facts You Can't Miss: The evolution of front-of-pack labeling: Providing consumers with tools to help select foods and beverages to encourage more healthful diets. Nutrition Today, 45(1), 22 32. doi:10.1097/NT.1090b1013e3181cb4561
6. DISCUSSION AND SYNTHESIS
6.1 Description of Study and General Findings
This report describes and synthesizes the literature reviewed on consumer and producer/retailer responses to FOP nutrition and shelf labels in addition to the knowledge and opinions of seven nutrition, marketing, and consumer behavior experts interviewed on these topics. Following a conceptual framework developed by Grunert and Wills (2007), our assessment of the effects of FOP nutrition labels and shelf tags describes their effects on consumer processing, liking, understanding, use, and purchases. We find using this framework helpful because FOP nutrition labels and/or shelf tags have to attract consumers' attention and aid their processing of nutrition information if they are to be effective. Consumers need to like FOP nutrition and/or shelf labels or they will not continue to use them. FOP nutrition labels and/or shelf tags need to enable consumers to make healthier food choices. FOP nutrition and/or shelf labels need to influence consumers' purchase behavior and sales if producers and retailers are to continue being motivated to provide simplified nutrition information or to develop new products or reformulate existing products to improve their nutritional content.
This review covered the two main types of FOP nutrition label systems:
- Summary systems use an algorithm based on a variety of nutrients that portray a food's overall nutritional value. Summary systems can be graded in the form of a single number (e.g., 1 to 100) or a small number of stars, or binary (e.g., present or absent on foods) such as symbols using a single check mark to indicate healthier foods. Examples of summary systems include NuVal, Guiding Stars, and the Choices logo.
- Nutrient-specific systems depict a small number of specific nutrients (e.g., calories, total fat, saturated fat, sugar, and sodium) in a summary fashion such as on a TL that includes red-yellow-green color codes and text indicating "high," "medium," or "low" levels of nutrients. Other types of nutrient-specific systems are the GDA and the %DI schemes, which list nutrients per portion and include the amount in grams and as a percentage of a person's GDA for each nutrient.
Nutrient-specific versus Summary systems. Nine studies we reviewed tested differences in consumer response between the two main types of systems: summary and nutrient-specific systems. One of these was an eye-tracking study that compared consumers' attention capture when viewing two variations of GDA schemes (e.g., monochrome and colored-coded GDAs) and the Choices logo. The study found that consumers' attention capture was faster using a binary summary system (Choices logo) (Bialkova & van Trijp, 2010). Eight studies tested consumer understanding of summary versus nutrient-specific systems. Five of eight studies found that FOP nutrient-specific systems incorporating TL color-coding, such as the TL or colored GDA, led consumers to more easily identify healthy foods compared with binary summary systems such as check-mark or tick symbols (Andrews & Burton, 2010; Borgmeier & Westenhoefer, 2009; Lin & Levy, 2010-Study 1; Synovate, 2005a; National Heart Foundation of Australia, 2009). Two studies found no difference in consumers' understanding among the nutrient-specific versus summary formats studied (Lin & Levy, 2010-Study 2; Feunekes et al., 2008-Study 2), while one study found that graded summary formats (e.g., stars and smileys) were easier to interpret than nutrient-specific schemes (e.g., Wheel of Health and Multiple TLs) (Feunekes et al., 2008-Study 1). Although differences were reported in consumer understanding for nutrient-specific versus summary formats, three of the studies reporting on consumer liking of these two main formats found that consumers like nutrient-specific formats, in particular, TL schemes (Feunekes et al.-Study 1, 2008; National Heart Foundation of Australia, 2009; Lin & Levy, 2010-Study 1). However, we should note that these comparisons are incomplete; we only identified two studies in which a TL system was compared with a type of graded summary system such as multiple stars (Feunekes et al., 2008-Study 1; Lin & Levy, 2010-Study 2).
6.2 Data Limitations
As is the case with any systematic review, we identified limitations in individual studies and found considerable variability in outcome measures across the studies. In addition, many of the studies we reviewed only reported differences between groups in terms of statistical significance (rather than reporting both means and variances). Hence, it was difficult to compare findings across studies in a way that can easily identify the magnitude of effects.
The bigger limitation was the coverage of studies that have been conducted. Although there is a growing body of evidence about consumer response to FOP labels in experimental situations (such as presentations in mall-intercept studies or Web-based panels), this review identified relatively few studies of the use and effects of FOP labels in the actual context of food shopping.
Another limitation is the lack of empirical studies on consumer response to the presence of FOP labels along with other nutrition claims. One experimental study conducted in the United States indicated that nutrition FOP symbols compete with other elements on the front of food packages for consumers' attention (Lin & Levy, 2010), and another article described results of two studies on this topic, but the results were mixed. One study found that product claims have the greatest effect on purchase behavior, while the other study found that product claims have no such effect (Maubach et al., 2009).Many of the experts we interviewed emphasized that these type of studies are necessary to determine how consumers will respond to an FOP or shelf-labeling system. Qualitative studies with consumers revealed dissatisfaction with multiple label systems in the U.K. and the Netherlands.
We also identified a relatively limited number of studies of the effects of FOP labels on producers and retailers. Advocates of FOP labels hope that using these labels might encourage producers to develop new food products or reformulate products to improve their nutritional value. In fact, some FOP systems were designed with this goal in mind, and experts we spoke with stated this factor has the potential to have a major impact on public health. We identified several examples in other countries that provide evidence that considerable reformulation can occur.
In some areas, this review was better able to identify issues than to resolve them. For instance, several of the experts we talked with indicated that retailers and producers are interested in developing their own supermarket-specific FOP labeling systems, because this could help them brand their chain as a place to purchase nutritious products and increase sales and build customer loyalty. Only a couple of studies provided evidence that nutrition shelf-label systems lead to brand or retailer loyalty (NuVal, 2010).
Nonetheless, despite these limitations the body of evidence provides much information that can help address issues regarding FOP labeling.
6.3 Primary Findings
6.3.1 Effects on Attention and Processing
Our review on consumers' processing of FOP labels identified two studies that asked consumers which type of FOP symbol would be quicker to read. We identified several studies that measured the amount of time it took to complete a task of identifying the more nutritious food choice on packages with alternative types of FOP labels, and we identified two studies that tracked the eye movements of consumers as they read different types of labels. Although we identified studies that observed the average time shoppers spent looking at food products before purchasing (Grunert, Fernández-Celemín, et al., 2010; Grunert, Wills, et al., 2010), we did not identify studies that measured the amount of time it takes for consumers to process FOP labels in actual shopping situations.
Perceived Processing Time. An Australian study (Kelly et al., 2009) and a study conducted in Belgium and Germany (Möser et al., 2010) both found that consumers were more likely to report that they could determine the healthfulness of a product if they were presented with TL labels than labels that described the nutritional content of foods as the percentage of a dietary reference intake.
Measured Processing Time. Some studies we reviewed found that measured processing time was influenced by the type of FOP label, and that simpler, more familiar symbols (such as stars or TL systems) were faster to process, but those differences were relatively modest. A study conducted in the UK and Italy found that consumers who saw starred FOP labels completed a comparative rating task 20.3% faster (53.2 seconds), and those who saw multiple Ticks about 13.1% faster (55.6 seconds), than consumers who saw labels that expressed five key nutrients in terms of a percentage of GDA (64.0 seconds) (Feunekes et al., 2008-Study 2). A UK study found that consumers completed a rating task 8.9% faster for the multiple TL system compared with %GDA FOP label systems (Synovate, 2005a). However, results from another comparison task in the same study found that consumers performed faster with the colored GDA system than other label formats.
A third study conducted in the Netherlands found that processing time was significantly faster (5.8%) with an FOP label (584 milliseconds) than without one (620 milliseconds). Additionally, when participants were asked to indicate whether they were presented with one or two logos, they had faster processing times when presented with the Choices logo compared with either a colored or monochrome GDA scheme (Bialkova & van Trijp, 2010). This study also found faster processing time, irrespective of the type of label, when the label was larger in size, positioned in a consistent location, and positioned on the top right of the food package. Study participants viewing a monochromatic label were 4.1% faster (709 milliseconds) at processing than those who viewed a polychromatic one (739 milliseconds). However, it is important to note that the effect of the background color on participants' processing time when viewing different labeling schemes was not considered in this study.
Processing Time by Eye Tracking. One of the more intriguing findings came from a study of eye movements among UK consumers (Jones & Richardson, 2007). This study of a multiple TL label found that the nutritional components that drew the greatest attention to the simplified FOP nutrition label were the same components on which a consumer focused on a more detailed nutrition label (e.g., Standard UK nutrition label). The Standard UK nutrition label is similar in design to the U.S. Nutrition Facts Panel. This suggests that FOP labels can help consumers' focus attention on critical nutrients.
Overall, the majority of literature reviewed on attention and processing seems to suggest that simple FOP labels, such as those incorporating graphic elements or TL color-coding (e.g., TL, stars, and check-mark symbols) enable consumers to more quickly process information than monochrome %GDA schemes. However, when considering which FOP nutrition label design will best attract consumers' attention and be easiest for consumers to process, one must consider how it will interact with different background colors and other such marketing elements on food packages.
6.3.2 Effects on Preference and Liking
The literature suggests that consumers generally have favorable opinions of FOP nutrition labels and like FOP labels that they perceive are easy to understand, find visually appealing, and can interpret quickly at a glance (Malam et al., 2009; Möser et al., 2010; Synovate, 2005a; Vyth et al., 2009; Which?, 2006). Studies that asked consumers which type of FOP labeling they most prefer found that consumers like FOP labels that incorporate TL color-coding such as the TL, Wheel of Health, or colored GDA as opposed to summary formats such as the Heart Foundation Tick or more numeric-based nutrient-specific formats such as the %DI or GDA (Feunekes et al., 2008-Study 1; Malam et al., 2009; Synovate, 2005a; National Heart Foundation of Australia, 2009; Which?, 2006). However, it should be considered that only one study compared consumers' preferences of a TL to graded summary concepts including smileys and stars (Feunekes et al., 2008-Study1). When considering studies on liking of shelf-labeling systems, only one U.S. industry-sponsored study compared consumers' opinions regarding different systems to find that 75% of customers preferred an Overall Nutritional Quality Index system (the NuVal system, which provides a rating from 1 to 100) to a system that reports nutritional quality using a one to three stars rating system (Katz et al., 2009).
Considering a more nuanced assessment of FOP labels suggests that consumer preference may depend on the task; a study found that European customers preferred a TL label that included the %GDA when they were asked to identify the healthier of two food products. However, when asked to choose the healthier food among a grocery basket of products they liked stars more than the GDA label (Feunekes et al., 2008-Study 2). When participants in a study were asked where they would like to see nutrition information displayed, 55% of consumers in a U.S. study said they would prefer the information on the price tags located on the front of store shelves and the price tags on the products themselves, while 37% said only on the products themselves (NuVal, 2010).
6.3.3 Effects on Understanding
The most extensive set of studies we identified provided information about the effects of FOP and shelf nutrition labels in identifying healthier choices.
Nine of 11 experimental studies we identified provided evidence indicating that consumers more frequently identified healthier food choices when they saw nutrient-specific FOP nutrition labels that incorporated TL color-coding compared with less interpretive more numeric-based nutrient-specific schemes such as the %GDA or %DI (Borgmeier & Westenhoefer, 2009; Jones & Richardson, 2007; Kelly et al., 2009; Malam et al., 2009; Maubach et al., 2009-Study 1 & Study 2; Synovate, 2005a; National Heart Foundation of Australia, 2009; Which?, 2006). Jones and Richardson (2007) did not compare consumers' understanding using a TL versus a GDA or %DI but instead tested the standard EU nutrition label versus the EU nutrition label with a TL to find that the TL reduced the errors in perceived healthiness ratings. Although the majority of experimental studies found that consumers more easily understood nutrition information on a TL label compared with less interpretive nutrient-specific schemes, two studies did not find that significantly more consumers were able to choose healthier foods using the TL (Lin & Levy, 2010-Study 1 & Study 2). Both studies determined that consumers most easily understood information presented on the NFP compared with FOP labeling schemes.
Five of seven experimental studies comparing nutrient-specific labels with TL color-coding to summary FOP labels (e.g., the Smart Choices icon, simple healthy choice tick) found that labels incorporating TLs performed better than summary labels such as ticks (Andrews & Burton, 2010; Borgmeier & Westenhoefer, 2009; National Heart Foundation of Australia, 2009;; Lin & Levy, 2010-Study 1; Synovate, 2005a;). Two studies did not find that FOP nutrition labels incorporating TLs were more easily understood by consumers compared with summary FOP systems (Feunekes et al., 2008-Study 1; Lin & Levy, 2010-Study 2). One study reported that summary labels such as smileys and stars performed better than a label with TLs, while another study found that the NFP was the only format that led consumers to focus on nutrition information. These results are summarized in Table 6-1.
Table 6-1. Summary of Findings of Experimental Studies of Effects of Labels on Identifying Healthier Food Choices
Studies in Europe, Australia, and New Zealand:
- A UK study found that consumers who viewed colored TLs were better able to identify healthy products, but consumers performed better on a comparison task when they viewed an FOP package with a colored GDA (Synovate, 2005a).
- A UK study found that consumers who were shown FSA TLs were better able to identify healthier choices than consumers who were shown the GDA system (97% vs. 86%, a relative advantage of 12.7%) (Which?, 2006). Among consumers who were lower in education, the relative advantage of using the TL system compared with the GDA was greater (90% vs. 75%), a relative advantage of 18.4% (Which?, 2006).
- Another UK study found that consumers were better able to identify healthy products when they saw TLs with %GDA and "text" indicating "high," "medium," and "low" or TLs with "text" compared with other labels; TL+ text was 7% higher than GDA + text and 24.5% higher than %GDA only (Malam et al., 2009). Regardless of the type of label, the inclusion of text increased the percentage of consumers who provided correct answers about the healthiness of a product by about 15%.
- A German study found that compared with no label, the proportion of consumers who identified the healthier food choice was 22% higher with the TL, 14.3% higher with a colored GDA, 11.3% higher with the monochrome GDA, and 6.4% higher with a tick label (Borgmeier & Westenhoefer, 2009).
- One Australian study found the TL system enabled consumers to better identify a healthy choice among nine food categories (75.9%) than the Heart Foundation Tick [HFT] (71.7%), and in product-specific comparisons, consumers who saw the TL were significantly more accurate than consumers who saw the HFT on six of nine nutrients. However, there was no clear pattern of difference in accuracy of consumers who saw a %DI label or a label that contained both the %DI label along with the HFT (National Heart Foundation of Australia, 2009).
- Another Australian study found that consumers were significantly more likely to correctly identify the healthier food products with either of two versions of a TL system (81% and 78%) than with either a colored (70%) or monochrome (64%) %DI system (Kelly et al., 2009).
- A European study found that the stars and smileys performed better than other schemes tested (e.g., a healthier choice tick, multiple TLs, a Wheel of Health, and a health protection shield) (Feunekes et al., 2008-Study 1).
- A UK study found that consumers who viewed the TL had 20.3% fewer errors than consumers who viewed a standard nutrition label (Jones & Richardson, 2007).
- A study in New Zealand found that consumers who rated a nutritionally poorer cereal gave significantly more negative ratings if they saw a TL label than a %DI label (Maubach et al., 2009-Study1). A second related study found that consumers more positively rated a cereal product than the nutritional profile suggested when the package contained a %DI label rather than a TL label (Maubach et al., 2009-Study 2).
Studies in the United States:
- A recent FDA study found that the proportion of U.S. consumers who correctly identified the healthier choice for three types of food products was significantly higher for consumers who viewed a multiple TL system (73.3%) or a %GDA system (66.3%) than for consumers who viewed a summary label check (61.0%). By comparison, only half of respondents who viewed a package without a label (49.6%) could identify the healthier food (Lin & Levy, 2010-Study 1). It should be noted that NFP performed better than the FOP labels tested (79%). Another FDA study found that the NFP was the only format that led consumers to focus on nutrition information (Lin & Levy, 2010-Study 2).
- A recent U.S. study found that consumers who were only shown the front of the package information did significantly better in identifying nutrients if they were exposed to a traffic-light GDA panel than to the Smart Choices icon (correctly identifying 80% rather than 60% of nutrients). However, if consumers were also shown the NFP, the additional effects of FOP labels were modest (Andrews & Burton, 2010).
Despite the relative performance of TL systems on identifying healthier food choices, there is limited research on the components of the TL system that result in the effects of this type of FOP nutrition label. TL color-coding has been tested in combination with %GDA information, in combination with text indicating high, medium, and low levels of nutrients, and simply with the amount in grams of a nutrient per serving. One study reviewed suggested that TL colors improved the performance of a %GDA system, but not to the degree of a TL system alone (Borgmeier & Westenhoefer, 2009). Another study in the UK found that text corresponding to the TL color-coding indicating high, medium, and low levels of nutrients further improved consumers' understanding of TL labels (Malam et al., 2009). In our review, we found two studies that tested consumer understanding of TL-GDAs (also known as the colored GDA) versus TL systems (Borgmeier & Westenhoefer, 2009; Synovate, 2005a). For one study the TL-GDA tested incorporated text indicating high, medium, and low levels of negative nutrients, while the TL-GDA tested in the other study did not incorporate text. Interestingly, the study that tested the colored GDA with text found that it performed as well or better than a TL scheme while the study that tested a colored GDA without text found that it came in second to the TL scheme tested. The evidence presented in the studies reviewed suggests that TL color-coding and text are some of the most critical elements of FOP systems.
Qualitative studies with consumers also indicated a more general concern about using multiple labeling systems. A UK study found that 73% of respondents thought it would be confusing if different producers used different types of nutrition labeling schemes (Which?, 2006). A British man in the study expressed this concern when he stated, "If you have different labeling, it would be very confusing; you would tend not to use it at all."
6.3.4 Effects on Diverse Consumer Populations
Findings consistently showed that less-educated consumers, older consumers, and consumers with high BMI were better able to identify nutritious choices correctly when they viewed simple FOP labels (e.g., multiple TLs) (Borgmeier & Westenhoefer, 2009; Which?, 2006). One study in Germany found that consumers higher in education were better able to identify healthier choices when they were shown more complex or numeric-based FOP labels (%GDA information), but consumers with lower education performed better with FOP labels that contained basic information like TL color-codes (Borgmeier & Westenhoefer, 2009). However, the study found that regardless of the label system tested consumers performed better in identifying the healthier choices with an FOP label (whatever labeling alternative) than without one.
6.3.5 Effects on Use, Purchase, and Consumption
Our review identified few studies reporting on consumer use of nutrition FOP and shelf labels. However, those studies suggested that consumers who are most interested in healthy eating are the consumers who reported using FOP nutrition labeling schemes (Grunert, Fernández-Celemín, et al., 2010; Grunert, Wills et al., 2010; Vyth, Steenhuis, Roodenburg, et al., 2010). One study noted that reported use is higher than observed use (Malam et al., 2009). Our review also identified a relatively limited number of studies providing evidence of the effects on FOP nutrition labels on consumers' purchase behavior and consumption habits. One study in Greece found that students reported they would pay more for products that contained a TL FOP label than for products that did not contain a nutrition label (Drichoutis et al., 2009). Two cross-sectional surveys found that consumers who reported being aware of FOP labels were more apt to purchase foods that were lower in saturated fats (Larsson et al., 1999; Reid et al., 2004). However, these study designs made it difficult to identify whether labels led to healthier purchases or whether consumers who were more health conscious, and therefore likely to purchase healthier foods, were more apt to use food labels.
6.3.6 Effects on Producers and Retailers
Research on the effects of FOP systems on producers and retailers are more limited, although we found studies of effects on sales and reformulation of foods.
Effects on Marketing. Two marketing studies and the experts interviewed suggested that introducing an FOP labeling system may convey a competitive advantage. The experts we talked to suggested that the introduction of Hannaford's Guiding Stars was intended "to persuade consumers to purchase more than bread, because they perceived the chain as a healthy place to shop." A market research study found that 65% of consumers agreed they are more likely to shop at stores with the NuVal system (NuVal, 2010-Affinnova 2007). A related study found that 32% of all consumers studied and 43% of health-conscious consumers prefer to shop at a store that uses NuVal (NuVal, 2010-Affinnova 2009). One study found that private-label products are more sensitive to FOP labeling than national brand products. When consumers were given a choice between a national brand and the private-label equivalent their intention to buy increased for private-label products with NuVal scores 3 to 5 points higher than the national brand option (NuVal, 2010).
Effects on Reformulation or Introduction of Healthier Food Products. Advocates of FOP labeling hope that using these systems will motivate producers to develop new products or reformulate existing products to increase their nutritional value. Despite the limitation in the numbers of empirical studies we identified, the studies that have been conducted are encouraging. Analysis of Australia's Pick the Tick program found that, following the introduction of the program, 12 breakfast cereals, comprising two-thirds of the sales volume, of a major manufacturer were reformulated to have reduced sodium content (Williams et al., 2003). A similar study in New Zealand found that 23 products were introduced or reformulated after introduction of the Pick the Tick program, and that these changes may have eliminated 33 tons of salt (Young & Swinburn, 2002).
A more comprehensive study in the Netherlands found that after introducing the Choices logo, products were reformulated to result in significant reductions in sodium, saturated fats, and calories (Vyth, Steenhuis, Roodenburg, et al., 2010). For instance, in processed meats, the amount of sodium in reformulated products was reduced by 18.3% and reduced in new products by 38.5% since introduction of the Netherland's Choices nutrition logo.
6.3.7 Combined Effects on Consumers, Producers, and Retailers
The combined effects of FOP nutrition labels on consumers, producers, and retailers may most clearly be seen in terms of sales data. Six of eight empirical studies found that aggregate sales of products indicated by labels as "healthy" increased following the introduction of FOP nutrition labeling systems.
For instance, analysis of sales data in two UK supermarket chains found that after introduction of their summary label systems, sales of healthier products increased and sales of comparable but less healthy products decreased (Grunert & Wills, 2007). In the United States, analysis of sales data found an increase in the purchase of products highly rated by the NuVal system (NuVal, 2010-IRI). Similarly, the sales of products that earned Hannaford's Guiding Stars showed a modest increase over 2 years (Sutherland et al., 2010).
Effects on sales may be modest, but they may build over time. For instance, Hannaford's Guiding Stars study found that 1 year after introduction of the Hannaford Guiding Stars labeling system, sales of products with stars in 168 stores in the northeastern United States increased by 0.5%, but after 2 years, by the time consumers had had the chance to develop a preference for these products, sales increased by 1.4% (Sutherland et al., 2010).
6.4 Identification of Knowledge Gaps
Our review identified a number of research questions that need to be investigated to help address important knowledge gaps. These questions are described below.
What type of FOP labeling would work best in the United States? Most of the studies on FOP labeling have been conducted outside the United States. One of the few studies that assessed consumer reactions to FOP labels in multiple countries found that results varied by country (Feunekes et al., 2008). Moreover, the United States has a more diverse population than Europe or Australia and New Zealand, and there is less vertical integration of producers and retailers than exists in many European countries. Hence, although the international studies can be informative, it will be important to repeat studies in the United States.
In general, results found that a TL label system performed better than a summary system consisting of a single check. However, there have only been a few studies comparing a TL label to a continuous summary rating system (like NuVal) or a system with multiple stars or checks. Experts we talked with report that producers and retailers prefer a system that includes positive as well as negative nutrients because they think this better characterizes the full nutrient value of a food. A U.S. industry sponsored study found that consumers were better able to identify the healthier food choice using an FOP label that included both positive nutrients as well as negative nutrients (Edge, 2010).
What type of FOP nutrition labeling best serves the needs of diverse consumer populations? Studies in Europe and Australia find that less-educated consumers and older consumers do a better job of identifying healthy food choices when presented with simpler labels (e.g., labels incorporating TLs) rather than more complex formats (such as % of GDA). It will be important to assess the effects of alternative FOP labeling systems on consumers who are less educated and may be lower in health literacy, as well as groups that vary by age, and family circumstances (e.g., women of childbearing age, presence of children in the home). It will also be important to know the impacts on individuals who may have chronic disease conditions such as hypertension or cardiovascular diseases in which limiting sodium is especially important. Similarly it will be important to know the effects on people who are overweight or obese or have conditions such as diabetes for which information on calories and saturated fats are particularly important. It will also be important to know effects by race/ethnicity and non-English speaking consumers. We also want to know effects of FOP labels on both health-conscious consumers and consumers who are not particularly health conscious. Because a goal of an FOP system is to promote health, we especially want to know the impacts on those who are not health conscious or are less educated.
What is the influence of competing nutrition claims on the effects of FOP nutrition labeling? One of the clear gaps in the research we identified was information about the effects of other contextual information. We need to know what characteristics of FOP labels make them stand out in the context of other information on the front of food packages, such as nutritional claims provided by food manufacturers on the front of packages. Many of the "unanswered questions" posed by FDA in their request for public comments (summarized in Appendix C) concerned questions about the broader context of food packaging that have not been systematically studied. Although some research on this issue is underway at FDA (Lin & Levy, 2010), it remains an important area to investigate more deeply.
What is the interrelationship between the Nutrition Facts Panel and FOP labels in the U.S. market? There is little information about the interrelationships between the mandatory NFP and FOP symbols is another limitation, especially for understanding the efficacy of FOP in the U.S. market.
What would minimize possible consumer confusion with multiple FOP label systems? One survey found that 73% of respondents in a UK study thought it would be confusing if different producers used different types of FOP nutrition labels (Which?, 2006). One study found that UK consumers did nearly as well comparing multiple labels as those with a single format (Malam et al., 2009). Nonetheless, at least some respondents in the study indicated that multiple labels might discourage their use; one consumer said, "To put it literally, it gives me a headache, and I just put it down" (Malam et al., 2009, p. 131). It will be important to understand what rules could reduce possible confusion of multiple FOP labeling systems and nutrition claims in the United States.
What are the effects of FOP nutrition labeling on use and purchase? Another gap is the relatively limited number of studies of the effects of FOP labels on actual use of the labels and purchase behavior. Most of the studies have been experimental studies that assessed effects in comparing pairs of food products in the context of an experimental Web panel or mall-intercept type study. A review by Grunert and Wills (2007) reported, "There is an urgent need for more research studying consumer use of nutritional information on food labels in a real world setting" (p. 385). Although there is a clear role for Web-based studies, ultimately we need to understand the effects of FOP labels on purchase behavior in the real-world setting. This may involve a mix of observation and experimental and quasi-experimental studies (e.g., studies of sales after the introduction of new FOP labels).
What is the effect of FOP nutrition labels on influencing consumers to purchase or consume products displaying an FOP symbol? There is little evidence on the likelihood or existence of substitution effects (i.e., whether and how much consumers over-consume/purchase products displaying an FOP symbol, particularly a summary type of symbol or a multiple TL type of symbol with a lot of green lights).
What consumer education best supports appropriate use of FOP labels? It will be useful to better understand the effects of broader social marketing, in-store promotions, and consumer education to encourage the awareness, understanding, and use of FOP labels. Most of the experts we interviewed believe that an educational component is extremely important for the success of nutrition labeling to affect consumer behavior.
What are the effects of FOP labels on new product development and reformulation? From a public health perspective, one of the greatest benefits of FOP labels is that they may motivate the development and reformulation of products to better satisfy nutritional criteria. It would be useful to develop a monitoring system that would enable the assessment of possible changes in the nutritional content of foods that are sold in response to the implementation of FOP nutrition labels.
REFERENCES
Ahold USA, Inc. (2010). [Comment FDA-2010-N-0210-0120 in response to FDA Docket FDA-2010-N-0210 on "Front-of-pack and shelf tag nutrition symbols"]. Retrieved from http://www.regulations.gov/#!searchResults;rpp=10;so=DESC;sb=postedDate;po=0;s=FDA-2010-N-0210
Andrews, C., & Burton, S. (2010). Are we making "smart choices" in evaluating front-of-package nutrition icons? Assessing effects of smart choices vs. traffic light-guideline daily amounts. Paper presented at the Marketing and Public Policy Conference, Chicago.
Berning, J. P., Chouinard, H., & McCluskey, J. J. (2008). Consumer preferences for detailed versus summary formats of nutrition information on grocery store shelf labels. Journal of Agricultural and Food Industrial Organization, 6, 1 20.
Bialkova, S., & van Trijp, H. (2010). What determines consumer attention to nutrition labels? Food Quality and Preference, 21(8), 1042 1051. doi:10.1016/j.foodqual.2010.07.001
Borgmeier, I., & Westenhoefer, J. (2009). Impact of different food label formats on healthiness evaluation and food choice of consumers: A randomized-controlled study. BMC Public Health, 9, 184.
Brandchannel. (2002). Private labels: Does branding matter? Retrieved October 15, 2010, from http://www.brandchannel.com/features_effect.asp?pf_id=94
British Retail Consortium. (2009). British retailing: A commitment to health 23. In British Retail Consortium (Ed.). Retrieved from http://www.brc.org.uk/showDoc04.asp?id = 4077&moid = 6968
Center for Science in the Public Interest. (2006). Petition for advance notice of proposed rulemaking on the use of symbols on the principal display panel to communicate the healthfulness of foods. Retrieved from http://www.cspinet.org/new/pdf/healthy_symbol_petition.pdf
Choiniere, C. J., & Lando, A. (2008). 2008 health and diet survey. Topline frequencies (weighted). Retrieved 2010 from http://www.fda.gov/Food/ScienceResearch/ResearchAreas/ConsumerResearch/ucm193895.htm
Cobiac, L. J, Vos, T., & Veerman, J. L. (2010). Cost-effectiveness of interventions to reduce dietary salt intake. Heart. Advance online publication. doi:10.1136/hrt.2010.199240
Day, G. S. (1976). Assessing the effects of information disclosure requirements. The Journal of Marketing, 40(2), 42 52.
Department of Health and Human Services, Food and Drug Administration (2003). Food labeling: Trans fatty acids in nutrition labeling, nutrient content claims, and health claims. Federal Register, 68(133), 41433 41506.
Department of Health and Human Services, Food and Drug Administration. (2010). Docket No. FDA-2010-N-0210. Front-of-pack and shelf tag nutrition symbols; Establishment of docket; Request for comments and information. Federal Register, 75(82), 22602 22606.
Department of Health Human Services & U. S. Department of Agriculture. (2005). Dietary guidelines for Americans, 2005. Washington, DC: U.S. Government Printing Office. Retrieved from http://www.health.gov/dietaryguidelines/dga2005/document/default.htm
Drichoutis, A. C., Lazaridis, P., & Nayga Jr., R. M. (2009). Would consumers value food-away-from-home products with nutritional labels? Agribusiness, 25(4), 550 575.
Edge, M. S. (2010). International Food Information Council Foundation front of pack labeling consumer research project. Consumer behavior research and front of package nutrition rating systems and symbols: What do consumers know, understand, and use? [PowerPoint Presentation]. Washington, DC.
Fear, T., Gibbons, C., & Anderson, S. (2004). The Heart Foundation's Tick Program. Driving innovation for a healthier food supply. Food Australia, 56(12), 599 600.
Feunekes, G. I. J., Gortemaker, I. A., Willems, A. A., Lion, R., & van den Kommer, M. (2008). Front-of-pack nutrition labelling: Testing effectiveness of different nutrition labelling formats front-of-pack in four European countries. Appetite, 50(1), 57-70. doi:10.1016/j.appet.2007.05.009
Finkelstein, E. A., Trogdon, J. G., Cohen, J. W., & Dietz, W. (2009). Annual medical spending attributable to obesity: Payer-and service-specific estimates. Health Affairs, 28(5), 822 831.
Flegal, K. M., Carroll, M. D., Ogden, C. L., & Curtin, L. R. (2010). Prevalence and trends in obesity among U.S. adults, 1999-2009. Journal of the American Medical Association, 303(3), 235 241.
Food Marketing Institute (FMI). (2010). [Comment FDA-2010-N-0210-0106 in response to FDA Docket FDA-2010-N-0210 on "Front-of-pack and shelf tag nutrition symbols"]. Retrieved from http://www.regulations.gov/#!searchResults;rpp=10;so=DESC;sb=postedDate;po=0;s=FDA-2010-N-0210
Food Standards Agency. (2007). Front of pack nutrition labelling. Retrieved October 22, 2010, from http://www.food.gov.uk/multimedia/pdfs/board/fsa100307.pdf
Freedman, M. R., & Connors, R. (2010). Point-of-purchase nutrition information influences food-purchasing behaviors of college students: A pilot study. Journal of the American Dietetic Association, 110(8), 1222 1226. doi:10.1016/j.jada.2010.05.002
Gorton, D. (2007). Nutrition labeling-update of scientific evidence on consumer use of understanding on nutrition labels and claims Prepared for the New Zealand Food Safety Authority and the Ministry of Health. Auckland, New Zealand: Clinical Trials Research Unit, University of Auckland.
Green, R. (2006). Green for go? Food Manufacture, 81(9), 48.
Grunert, K., Fernández-Celemín, L., Wills, J., Storcksdieck genannt Bonsmann, S., & Nureeva, L. (2010). Use and understanding of nutrition information on food labels in six European countries. Journal of Public Health, 18(3), 261 277. doi:10.1007/s10389-009-0307-0
Grunert, K., & Wills, J. (2007). A review of European research on consumer response to nutrition information on food labels. Journal of Public Health, 15(5), 385 399. doi:10.1007/s10389-007-0101-9
Grunert, K. G., Wills, J. M., & Fernández-Celemín, L. (2010). Nutrition knowledge, and use and understanding of nutrition information on food labels among consumers in the UK. Appetite, 55(2), 177 189. doi:10.1016/j.appet.2010.05.045
Guiding Stars Licensing Company. (2010). [Response to Docket FDA-2010-N-0210].
Havas, S., Roccella, E. J., & Lenfant, C. (2004). Reducing the public health burden from elevated blood pressure levels in the United States by lowering intake of dietary sodium. American Journal of Public Health, 94(1), 19 22. doi:10.2105/ajph.94.1.19
Hersey, J., Anliker, J., Miller, C., Mullis, R. M., Daugherty, S., Das, S., ... Thomas, H. O. (2001). Food shopping practices are associated with dietary quality in low-income households. Journal of Nutrition Education, 33, S16 S26.
Hoyer, W. D., & MacInnis, D. J. (2007). Consumer behavior (4th ed.). Boston, MA: Houghton Mifflin Company.
Hunt, M. K., Lefebvre, R. C., Hixson, M. L., Banspach, S. W., Assaf, A. R., & Carleton, R. A. (1990). Pawtucket Heart Health Program point-of-purchase nutrition education program in supermarkets. American Journal of Public Health, 80(6), 730 732. doi:10.2105/ajph.80.6.730
Institute of Medicine. (2010). Examination of front-of-package nutrition rating systems and symbols: Phase 1 Report. Washington DC: Institute of Medicine. Retrieved from http://www.iom.edu/Reports/2010/Examination-of-Front-of-Package-Nutrition-Rating-Systems-and-Symbols-Phase-1-Report.aspx
Jones, G., & Richardson, M. (2007). An objective examination of consumer perception of nutrition information based on healthiness ratings and eye movements. Public Health Nutrition, 10(3), 238 244. doi:10.1017/S1368980007258513
Kant, A. K., Graubard, B. I., & Schatzkin, A. (2004). Dietary patterns predict mortality in a national cohort: The National Health Interview Surveys, 1987 and 1992. The Journal of Nutrition, 134(7), 1793 1799.
Katz, D. L., Njike, V. Y., Faridi, Z., Rhee, L.Q., Reeves, R. S., Jenkins, D.J.A. & Ayoob, K.T. (2009). The stratification of foods on the basis of overall nutritional quality: The overall nutritional quality index. American Journal of Health Promotion, 24(2), 133 143.
Kelly, B., Hughes, C., Chapman, C., Louie, Jimmy C-Y, Dixon, H., Crawford, J., ... Slevin, T. (2009). Consumer testing of the acceptability and effectiveness of front-of-pack food labelling systems for the Australian grocery market Health Promotion International, 24(2), 120 129.
Kelly, B., Hughes, C., Chapman, C., Louie, Jimmy C-Y, Dixon, H., Crawford, J., ... Slevin, T. (2009). Consumer testing of the acceptability and effectiveness of front-of-pack food labelling systems for the Australian grocery market. Health Promotion International, 24(2), 120 129.
Kim, W. K., & Kim, J. (2009). A study on the consumer's perception of front-of-pack nutrition labeling. Nutrition Research and Practice, 3(4), 300 306.
Kondro, W. (2008). Canada needs paradigm shift in public health nutrition. Canadian Medical Association Journal, 179(12), 1259 1261. doi:10.1503/cmaj.081755
Lando, A. M., & Labiner-Wolfe, J. (2007). Helping consumers make more healthful food choices: Consumer views on modifying food labels and providing point-of-purchase nutrition information at quick-service restaurants. Journal of Nutrition Education & Behavior, 39(3), 157 163.
Lang, J. E., Mercer, N., Tran, D., & Mosca, L. (2000). Use of a supermarket shelf-labeling program to educate a predominately minority community about foods that promote heart health. Journal of the American Dietetic Association, 100(7), 804 809. doi:10.1016/s0002-8223(00)00234-0
Larsson, I., Lissner, L., & Wilhelmsen, L. (1999). The "Green Keyhole" revisited: Nutritional knowledge may influence food selection. European Journal of Clinical Nutrition, 53(10), 776 780.
Levy, A. S., & Fein, S. B. (1998). Consumers' ability to perform tasks using nutrition labels. Journal of Nutrition Education, 30(4), 210 217.
Lidwell, W., Holden, K., & Butler, J. (2010). Universal principles of design. Beverly, MA: Rockport Publishers.
Lin, C-T. J., & Levy, A. (2010). Food and Drug Administration front-of-pack consumer research. Paper presented at the Institute of Medicine, Food and Nutrition Board.
Lobstein, T, & Davies, S. (2008). Defining and labelling "healthy" and "unhealthy" food. Public Health Nutrition, 12(03), 331 340. doi:10.1017/S1368980008002541
Lobstein, T., Landon, J., Lincoln, P., Ash, R., & Press, V. (2007). Misconceptions and misinformation: The problems with Guideline Daily Amounts (GDAs). A review of GDAs and their use for signalling nutritional information on food and drink labels. Paper presented at the National Heart Forum, London, UK. Retrieved from http://www.heartforum.org.uk/resources/nhf-publications/?entryid30=4707&char=M
Malam, S., Clegg, S., Kirwan, S., McGingal, S., & British Market Research Bureau (BMRB). (2009). Comprehension and use of UK nutrition signpost labelling schemes. Prepared for Food Standards Agency.
Marketing. (2004). Signposting set to hit food sale. Marketing (00253650), Retrieved from http://search.ebscohost.com/login.aspx?direct=true&db=bch&AN=15542715&site=ehost-live
Maubach, N., & Hoek, J. (2010). A qualitative study of New Zealand parents' views on front-of-pack nutrition labels. Nutrition & Dietetics, 67(2), 90 96. doi:10.1111/j.1747-0080.2010.01425.x
Maubach, N., Hoek, J., Gendall, P., & Hedderly, D. (2009). The effect of front-of-package nutrition information and product claims on consumers' attitudinal evaluations and choice behavior. Paper presented at the 2009 Marketing and Public Policy Conference.
Mars Incorporated. (2010). [Comment FDA-2010-N-0211-0111.1 in response to FDA Docket FDA-2010-N-0210 on "Front-of-pack and shelf tag nutrition symbols"]. Retrieved from http://www.regulations.gov/#!searchResults;rpp=10;so=DESC;sb=postedDate;po=0;s=FDA-2010-N-0210
McCullum, C., & Achterberg, C. L. (1997). Food shopping and label use behavior among high school-aged adolescents. Adolescence, 125, 32. Retrieved from http://search.ebscohost.com/login.aspx?direct=true&db=rzh&AN=2009475156&site=ehost-live
Möser, A., Hoefkens, C., Van Camp, J., & Verbeke, W. (2010). Simplified nutrient labelling: Consumers' perceptions in Germany and Belgium. Journal für Verbraucherschutz und Lebensmittelsicherheit, 5(2), 169 180. doi:10.1007/s00003-009-0531-0
National Heart Foundation of Australia. (2009). Australians and front of pack labelling: What we want, what we need. Retrieved from http://www.heartfoundation.org.au/SiteCollectionDocuments/Tick%20HeartFoundation%20Research%20Summary%20FOPL.pdf
Navigator. (2007). Front of pack signpost labelling: Exploratory research. Food Standards Agency.
New Nutrition Business. (2006). No black and white in UK food labelling stand off. New Nutrition Business, Edition 83, 7 8.
NuVal. (2010). [Response to Docket FDA-2010-N-0210].
Ogden, C. L., Carroll, M. D., Curtin, L. R., Lamb, M. M., & Flegal, K. M. (2010). Prevalence of high body mass index in US children and adolescents, 2007-2008. JAMA: Journal of the American Medical Association, 303(3), 242 249.
Reid, R. D., Slovinec D'Angelo, M. E., Dombrow, C. A., Heshka, J. T., & Dean, T. R. (2004). The Heart and Stroke Foundation of Canada's Health Check Food Information Program Modelling program effects on consumer behaviour and dietary practices. Canadian Journal of Public Health-Revue, 95(2), 146 180.
Rozin, P., Fischler, C., Imada, S., Sarubin, A., & Wrzesniewski, A. (1999). Attitudes to food and the role of food in life in the U.S.A., Japan, Flemish Belgium and France: Possible implications for the diet-health debate. Appetite, 33(2), 163 180. doi:10.1006/appe.1999.0244
Rubin, P. H. (2004). Regulation of information and advertising. SSRN eLibrary.
Sacks, G., Rayner, M., & Swinburn, B. (2009). Impact of front-of-pack "traffic-light" nutrition labelling on consumer food purchases in the UK. Health Promotion International, 24(4), 344 352. doi:10.1093/heapro/dap032
Scammon, D. L. (1977). "Information load" and consumers. The Journal of Consumer Research, 4(3), 148 155.
Scheibehenne, B., Greifeneder, R., & Todd, P. M. (2010). Can there ever be too many options? A meta-analytic review of choice overload. The Journal of Consumer Research, 37(3), 409 425.
Schor, D., Maniscalco, S., Tuttle, M. M., Alligood, S., & Reinhardt Kapsak, W. (2010). Nutrition facts you can't miss: The evolution of front-of-pack labeling: Providing consumers with tools to help select foods and beverages to encourage more healthful diets. Nutrition Today, 45(1), 22 32. doi:10.1097/NT.1090b1013e3181cb4561
Schucker, R. E, Levy, A. S., Tenney, J., & Mathews, O. (1992). Nutrition shelf-labeling and consumer purchase behavior. Journal of Nutrition Education, 24(2), 75 81.
Scott, V., & Worsley, A. F. (1994). Ticks, claims, tables and food groups: A comparison for nutrition labelling. Health Promotion International, 9(1), 27 37. doi:10.1093/heapro/9.1.27
Smith, S. C., Stephen, A. M., Dombrow, C., & MacQuarrie, D. (2002). Food information programs: A review of the literature. Canadian Journal of Dietetic Practice & Research, 63(2), 55 60.
Steenhuis, I., Assema, P. van, Breukelen, G. van, & Glanz, K. (2004). The effectiveness of nutrition education and labeling in Dutch supermarkets. American Journal of Health Promotion, 18(3), 221 224.
Sutherland, L. A, Kaley, L. A, & Fischer, L. (2010). Guiding Stars: the effect of a nutrition navigation program on consumer purchases at the supermarket. The American Journal of Clinical Nutrition, 91(4), 1090S 1094S. doi:10.3945/ajcn.2010.28450C
Synovate. (2005a). Quantitative evaluation of alternative food signposting concepts: Report of findings. COI on behalf of the Food Standards Agency.
Synovate. (2005b). Qualitative signpost labelling refinement research: Report of findings. COI on behalf of the Food Standards Agency.
The Food Magazine. (2006). Industry divides over nutrition labelling. The Food Magazine, July/Sept(74), 18.
Van Camp, D. J., Hooker, N. H., & Souza Monteiro, D.M. (2009). UK food manufacturer responses to voluntary front of package nutrition schemes. Ohio State University, Department of Agriculture, Environmental and Development Economics Honor Theses.
van Kleef, E., van Trijp, H., Paeps, F., & Fernández-Celemín, L. (2008). Consumer preferences for front-of-pack calories labelling. Public Health Nutrition, 11(02), 203 213. doi:10.1017/S1368980007000304
Vyth, E., Steenhuis, I., Mallant, S., Mol, Z., Brug, J., Temminghoff, M., ... Seidell, J. (2009). A front-of-pack nutrition logo: A quantitative and qualitative process evaluation in the Netherlands. Journal of Health Communication, 14(7), 631 645.
Vyth, E. L, Steenhuis, I. H. M., Roodenburg, A.J.C., Brug, J., & Seidell, J. C. (2010). Front-of-pack nutrition label stimulates healthier product development: A quantitative analysis. International Journal of Behavioral Nutrition and Physical Activity 2010, 7(65), doi:10.1186/1479-5868-7-65
Vyth, E. L, Steenhuis, I. H. M., Vlot, J. A., Wulp, A., Hogenes, M. G, Looije, D. H, ... Seidell, J. C. (2010). Actual use of a front-of-pack nutrition logo in the supermarket: Consumers' motives in food choice. Public Health Nutrition, 13(11), 1882 1889. doi:10.1017/S1368980010000637
Wansink, B. (2003). How do front and back package labels influence beliefs about health claims? Journal of Consumer Affairs, 37(2), 305 316.
Which? (2006). Healthy signs? Campaign Report. London, United Kingdom.
Williams, P. (2005). Nutrition science and policy. Consumer understanding and use of health claims for foods. Nutrition Reviews, 63(7), 256 264.
Williams, P., McMahon, A., & Boustead, R. (2003). A case study of sodium reduction in breakfast cereals and the impact of the Pick the Tick food information program in Australia. Health Promotion International, 18(1), 51 56. doi:10.1093/heapro/18.1.51
Young, L., & Swinburn, B. (2002). Impact of the Pick the Tick food information programme on the salt content of food in New Zealand. Health Promotion International, 17(1), 13 19. doi:10.1093/heapro/17.1.13
APPENDIX A: FOP LABELS SEARCH STRATEGY
FOP Labels Search Strategy 1 August 31, 2010
PubMed 28 records (28 unique records imported into EndNote)
#36 Search ("Food Labeling"[Mesh] OR "Food Packaging"[Mesh]) AND ("Consumer Satisfaction"[Mesh] OR consumer*[Text Word] OR "Consumer Organizations"[Mesh] OR "Consumer Health Information"[Mesh] OR "Evaluation Studies as Topic"[Mesh] OR "Program Evaluation"[Mesh] OR effect*[Text Word] OR "Nutritional Sciences"[Mesh] OR "Child Nutrition Sciences"[Mesh] OR "Nutrition Assessment"[Mesh] OR "Nutrition Surveys"[Mesh] OR "Nutrition Policy"[Mesh] OR "Nutrition Disorders"[Mesh] OR "Nutritive Value"[Mesh] OR nutri*[Text Word] OR "Nutritional Requirements"[Mesh] OR "Maternal Nutritional Physiological Phenomena"[Mesh] OR "Adolescent Nutritional Physiological Phenomena"[Mesh] OR "Infant Nutritional Physiological Phenomena"[Mesh] OR "Child Nutritional Physiological Phenomena"[Mesh] OR "Nutritional Status"[Mesh] OR producer*[Text Word] OR retailer*[Text Word] OR grocer*[Text Word] OR "stores"[Text Word] OR manufacturer*[Text Word] OR "company"[Text Word] OR "companies"[Text Word] OR "Marketing"[Mesh]) AND (front*[Title/Abstract] OR shelf*[Title/Abstract] OR "shelves"[Title/Abstract] OR "fop"[Title/Abstract]) Limits: English, Publication Date from 1990 13:56:34 248
#19 Search ("shelf"[Title] OR "shelves"[Title]) AND label*[Title] Limits: English, Publication Date from 1990 13:32:46 2
#17 Search "front"[Title] AND pack*[Title] AND label*[Title] Limits: English, Publication Date from 1990 13:29:22 7
#15 Search "front"[Title/Abstract] AND pack*[Title/Abstract] AND label*[Text Word] AND (consumer*[Text Word] OR effectiv*[Text Word] OR design*[Text Word] OR nutrition*[Text Word] OR producer*[Text Word] OR retailer*[Text Word]) Limits: English, Publication Date from 1990 13:27:29 16
#14 Search (front of pack*[Text Word] OR "FOP"[Text Word] OR shelf label*[Text Word]) AND (consumer*[Text Word] OR effectiv*[Text Word] OR design*[Text Word] OR nutrition*[Text Word] OR producer*[Text Word] OR retailer*[Text Word]) Limits: English, Publication Date from 1990 13:22:04 56
#0 pubmed clipboard 14:00:10 28
Web of Science - 26 records (10 unique records imported into EndNote)
# 3 26 Topic = ("front of pack*") AND Topic = (consumer* OR effect* OR design* OR nutri* OR producer* OR retailer*) AND Language = (English)
Databases = SCI-EXPANDED, SSCI, A&HCI Timespan = 1990-2010
# 2 10 Topic = ("shelf label*") AND Topic = (consumer* OR effect* OR design* OR nutri* OR producer* OR retailer*) AND Language = (English)
Databases = SCI-EXPANDED, SSCI, A&HCI Timespan = 1990-2010
# 1 12 Title = (fop OR front* OR shelf OR shelves) AND Title = (label*) AND Title = (consumer* OR effect* OR design* OR nutri* OR producer* OR retailer*) AND Language = (English)
Databases = SCI-EXPANDED, SSCI, A&HCI Timespan = 1990-2010
ScienceDirect - 4 records (2 unique records imported into EndNote)
pub-date > 1989 and TITLE-ABSTR-KEY("shelf label" OR "shelf labels" OR "shelf labeling") and TITLE-ABSTR-KEY(consumer* OR effect* OR design* OR nutri* OR producer* OR retailer*)
[All Sources(- All Sciences -)] 4 articles Edit|Delete
pub-date > 1989 and TITLE-ABSTR-KEY("front of pack" OR "front of package" OR "front of packaging") and TITLE-ABSTR-KEY(consumer* OR effect* OR design* OR nutri* OR producer* OR retailer*)
[All Sources(- All Sciences -)] 3 articles Edit|Delete
pub-date > 1989 and TITLE(fop OR front* OR shelf OR shelves) and TITLE(label* AND (consumer* OR effect* OR design* OR nutri* OR producer* OR retailer*) )
[All Sources(- All Sciences -)] 5 articles
CINAHL - 11 records (5 unique records imported into EndNote)
S3 ("shelf label" OR "shelf labels" OR "shelf labeling") and (consumer* OR effect* OR design* OR nutri* OR producer* OR retail*) Limiters - Published Date from: 19900101-20101231; English Language
Search modes - Boolean/Phrase Interface - EBSCOhost
Search Screen - Advanced Search
Database - CINAHL Plus with Full Text 6 Edit S3
S2 ("front of pack" OR "front of package" OR "front of packaging") and (consumer* OR effect* OR design* OR nutri* OR producer* OR retail*) Limiters - Published Date from: 19900101-20101231; English Language; Exclude MEDLINE records
Search modes - Boolean/Phrase Interface - EBSCOhost
Search Screen - Advanced Search
Database - CINAHL Plus with Full Text 3 Edit S2
S1 (fop OR front* OR shelf OR shelves) and label* and (consumer* OR effect* OR design* OR nutri* OR producer* OR retail*) Limiters - Published Date from: 19900101-20101231; English Language; Exclude MEDLINE records
Search modes - Boolean/Phrase Interface - EBSCOhost
Search Screen - Advanced Search
Database - CINAHL Plus with Full Text 33
Business Source Corporate - 24 records (20 unique records imported into EndNote)
S3 ("shelf label" OR "shelf labels" OR "shelf labeling") and (consumer* OR effect* OR design* OR nutri* OR producer* OR retail*) Limiters - Published Date from: 19900101-20101231
Search modes - Boolean/Phrase Interface - EBSCOhost
Search Screen - Advanced Search
Database - Business Source Corporate 76 Edit S3
S2 ("front of pack" OR "front of package" OR "front of packaging") and (consumer* OR effect* OR design* OR nutri* OR producer* OR retail*) Limiters - Published Date from: 19900101-20101231
Search modes - Boolean/Phrase Interface - EBSCOhost
Search Screen - Advanced Search
Database - Business Source Corporate 53 Edit S2
S1 TI (fop OR front* OR shelf OR shelves) and label* and (consumer* OR effect* OR design* OR nutri* OR producer* OR retail*) Limiters - Published Date from: 19900101-20101231
Search modes - Boolean/Phrase Interface - EBSCOhost
Search Screen - Advanced Search
Database - Business Source Corporate 8
PsycINFO - 3 records (3 unique records imported into EndNote)
S3 ("shelf label" OR "shelf labels" OR "shelf labeling") and (consumer* OR effect* OR design* OR nutri* OR producer* OR retail*) Limiters - Publication Year from: 1990-2010; English
Search modes - Boolean/Phrase Interface - EBSCOhost
Search Screen - Advanced Search
Database - PsycINFO 6 Edit S3
S2 ("front of pack" OR "front of package" OR "front of packaging") and (consumer* OR effect* OR design* OR nutri* OR producer* OR retail*) Limiters - Publication Year from: 1990-2010; English
Search modes - Boolean/Phrase Interface - EBSCOhost
Search Screen - Advanced Search
Database - PsycINFO 8 Edit S2
S1 TI (fop OR front* OR shelf OR shelves) and TI label* and TI (consumer* OR effect* OR design* OR nutri* OR producer* OR retail*) Limiters - Publication Year from: 1990-2010; English
Search modes - Boolean/Phrase Interface - EBSCOhost
Search Screen - Advanced Search
Database - PsycINFO 5
AGRICOLA - 17 records (2 unique records imported into EndNote)
S3 ("shelf label" OR "shelf labels" OR "shelf labeling") and (consumer* OR effect* OR design* OR nutri* OR producer* OR retail*) Limiters - Date Published from: 19900101-20101231; Language: english
Search modes - Find all my search terms Interface - EBSCOhost
Search Screen - Advanced Search
Database - Agricola 10 Edit S3
S2 ("front of pack" OR "front of package" OR "front of packaging") and (consumer* OR effect* OR design* OR nutri* OR producer* OR retail*) Limiters - Date Published from: 19900101-20101231; Language: english
Search modes - Find all my search terms Interface - EBSCOhost
Search Screen - Advanced Search
Database - Agricola 7 Edit S2
S1 TI (fop OR front* OR shelf OR shelves) and TI label* and TI (consumer* OR effect* OR design* OR nutri* OR producer* OR retail*) Limiters - Date Published from: 19900101-20101231; Language: english
Search modes - Find all my search terms Interface - EBSCOhost
Search Screen - Advanced Search
Database - Agricola 10
Food Science and Technology Abstracts -16 records (4 unique records imported into EndNote)
S4 "fop label*" Limiters - Publication Date from: 1990-2010; Language: English
Search modes - Find all my search terms Interface - EBSCOhost
Search Screen - Advanced Search
Database - FSTA - Food Science and Technology Abstracts 0 Edit S4
S3 ("shelf label" OR "shelf labels" OR "shelf labeling") and (consumer* OR effect* OR design* OR nutri* OR producer* OR retail*) Limiters - Publication Date from: 1990-2010; Language: English
Search modes - Find all my search terms Interface - EBSCOhost
Search Screen - Advanced Search
Database - FSTA - Food Science and Technology Abstracts 4 Edit S3
S2 ("front of pack" OR "front of package" OR "front of packaging") and (consumer* OR effect* OR design* OR nutri* OR producer* OR retail*) Limiters - Publication Date from: 1990-2010; Language: English
Search modes - Find all my search terms Interface - EBSCOhost
Search Screen - Advanced Search
Database - FSTA - Food Science and Technology Abstracts 13 Edit S2
S1 TI (fop OR front* OR shelf OR shelves) and TI label* and TI (consumer* OR effect* OR design* OR nutri* OR producer* OR retail) Limiters - Publication Date from: 1990-2010; Language: English
Search modes - Find all my search terms Interface - EBSCOhost
Search Screen - Advanced Search
Database - FSTA - Food Science and Technology Abstracts 8
FOP_Labels_2_search strategy- September 8, 2010
PubMed 12 records (5 unique records imported into EndNote)
#27 Search (packag*[Text Word] OR label*[Text Word]) AND nutrition*[Text Word] AND ("icon"[Text Word] OR "icons"[Text Word] OR "logo"[Text Word] OR "logos"[Text Word] OR "scheme"[Text Word] OR "schemes"[Text Word]) Limits: English, Publication Date from 1990 26
#25 Search "front"[Text Word] AND nutrition*[Text Word] AND ("icon"[Text Word] OR "icons"[Text Word] OR "logo"[Text Word] OR "logos"[Text Word] OR "scheme"[Text Word] OR "schemes"[Text Word]) Limits: English, Publication Date from 1990 - 4
#24 Search "front"[Text Word] AND ("icon"[Text Word] OR "icons"[Text Word] OR "logo"[Text Word] OR "logos"[Text Word] OR "scheme"[Text Word] OR "schemes"[Text Word]) AND (consumer*[Text Word] OR effectiv*[Text Word] OR design*[Text Word] OR nutrition*[Text Word] OR producer*[Text Word] OR retailer*[Text Word] OR "Consumer Satisfaction"[Mesh] OR consumer*[Text Word] OR "Consumer Organizations"[Mesh] OR "Consumer Health Information"[Mesh] OR "Evaluation Studies as Topic"[Mesh] OR "Program Evaluation"[Mesh] OR effect*[Text Word] OR "Nutritional Sciences"[Mesh] OR "Child Nutrition Sciences"[Mesh] OR "Nutrition Assessment"[Mesh] OR "Nutrition Surveys"[Mesh] OR "Nutrition Policy"[Mesh] OR "Nutrition Disorders"[Mesh] OR "Nutritive Value"[Mesh] OR nutri*[Text Word] OR "Nutritional Requirements"[Mesh] OR "Maternal Nutritional Physiological Phenomena"[Mesh] OR "Adolescent Nutritional Physiological Phenomena"[Mesh] OR "Infant Nutritional Physiological Phenomena"[Mesh] OR "Child Nutritional Physiological Phenomena"[Mesh] OR "Nutritional Status"[Mesh] OR producer*[Text Word] OR retailer*[Text Word] OR grocer*[Text Word] OR "stores"[Text Word] OR manufacturer*[Text Word] OR "company"[Text Word] OR "companies"[Text Word] OR "Marketing"[Mesh]) Limits: English, Publication Date from 1990 - 100
#23 Search (principle display panel*[Text Word] OR signpost*[Text Word]) AND (consumer*[Text Word] OR effectiv*[Text Word] OR design*[Text Word] OR nutrition*[Text Word] OR producer*[Text Word] OR retailer*[Text Word] OR "Consumer Satisfaction"[Mesh] OR consumer*[Text Word] OR "Consumer Organizations"[Mesh] OR "Consumer Health Information"[Mesh] OR "Evaluation Studies as Topic"[Mesh] OR "Program Evaluation"[Mesh] OR effect*[Text Word] OR "Nutritional Sciences"[Mesh] OR "Child Nutrition Sciences"[Mesh] OR "Nutrition Assessment"[Mesh] OR "Nutrition Surveys"[Mesh] OR "Nutrition Policy"[Mesh] OR "Nutrition Disorders"[Mesh] OR "Nutritive Value"[Mesh] OR nutri*[Text Word] OR "Nutritional Requirements"[Mesh] OR "Maternal Nutritional Physiological Phenomena"[Mesh] OR "Adolescent Nutritional Physiological Phenomena"[Mesh] OR "Infant Nutritional Physiological Phenomena"[Mesh] OR "Child Nutritional Physiological Phenomena"[Mesh] OR "Nutritional Status"[Mesh] OR producer*[Text Word] OR retailer*[Text Word] OR grocer*[Text Word] OR "stores"[Text Word] OR manufacturer*[Text Word] OR "company"[Text Word] OR "companies"[Text Word] OR "Marketing"[Mesh]) Limits: English, Publication Date from 1990 - 77
Web of Science - 14 records (7 unique records imported into EndNote)
# 3 24 Topic = (packag* OR label*) AND Topic = (consumer* OR effect* OR design* OR producer* OR retailer*) AND Language = (English) AND Topic = (icon OR icons OR logo OR logos OR scheme OR schemes) AND Topic = (nutri*)
Databases = SCI-EXPANDED, SSCI, A&HCI Timespan = 1990-2010
# 2 16 Topic = (front) AND Topic = (consumer* OR effect* OR design* OR nutri* OR producer* OR retailer*) AND Language = (English) AND Topic = (icon OR icons OR logo OR logos OR scheme OR schemes) AND Topic = (packag*)
Databases = SCI-EXPANDED, SSCI, A&HCI Timespan = 1990-2010
# 1 78 Topic = ("principle display panel" OR "principle display panels" OR signpost*) AND Topic = (consumer* OR effect* OR design* OR nutri* OR producer* OR retailer*) AND Language = (English)
Databases = SCI-EXPANDED, SSCI, A&HCI Timespan = 1990-2010
ScienceDirect - 5 records (2 unique records imported into EndNote)
pub-date > 1989 and TITLE-ABSTR-KEY((consumer* OR effect* OR design* OR producer* OR retail*) AND (icon OR icons OR logo OR logos OR scheme OR schemes) AND (packag* OR label*) AND nutri*)
[All Sources(- All Sciences -)] 11
pub-date > 1989 and TITLE-ABSTR-KEY((icon OR icons OR logo OR logos OR scheme OR schemes) AND (front AND packag*) and TITLE-ABSTR-KEY(consumer* OR effect* OR design* OR nutri* OR producer* OR retailer*)
[All Sources(- All Sciences -)] 7
pub-date > 1989 and TITLE-ABSTR-KEY("principle display panel" OR "principle display panels" OR signpost*) and TITLE-ABSTR-KEY(consumer* OR effect* OR design* OR nutri* OR producer* OR retailer*)
[All Sources(- All Sciences -)] 14
CINAHL - 9 record (7 unique records imported into EndNote)
S3 (consumer* OR effect* OR design* OR nutri* OR producer* OR retail*) and (icon OR icons OR logo OR logos OR scheme OR schemes) and (packag* OR label*) Limiters - Published Date from: 19900101-20101231; English Language; Exclude MEDLINE records
Search modes - Boolean/Phrase Interface - EBSCOhost
Search Screen - Advanced Search
Database - CINAHL Plus with Full Text 29 Edit S3
S2 (consumer* OR effect* OR design* OR nutri* OR producer* OR retail*) and (icon OR icons OR logo OR logos OR scheme OR schemes) and front Limiters - Published Date from: 19900101-20101231; English Language; Exclude MEDLINE records
Search modes - Boolean/Phrase Interface - EBSCOhost
Search Screen - Advanced Search
Database - CINAHL Plus with Full Text 1 Edit S2
S1 (consumer* OR effect* OR design* OR nutri* OR producer* OR retail*) and ("principle display panel" OR "principle display panels" OR signpost*) Limiters - Published Date from: 19900101-20101231; English Language; Exclude MEDLINE records
Search modes - Boolean/Phrase Interface - EBSCOhost
Search Screen - Advanced Search
Database - CINAHL Plus with Full Text 22
Business Source Corporate - 26 records (20 unique records imported into EndNote)
S3 (consumer* OR effect* OR design* OR nutri* OR producer* OR retail*) and (icon OR icons OR logo OR logos OR scheme OR schemes) and front and (packag* OR label*) Limiters - Published Date from: 19900101-20101231
Search modes - Boolean/Phrase Interface - EBSCOhost
Search Screen - Advanced Search
Database - Business Source Corporate 58 Edit S3
S2 (consumer* OR effect* OR design* OR producer* OR retail*) and ("principle display panel" OR "principle display panels") Limiters - Published Date from: 19900101-20101231
Search modes - Boolean/Phrase Interface - EBSCOhost
Search Screen - Advanced Search
Database - Business Source Corporate 0 Edit S2
S1 (consumer* OR effect* OR design* OR producer* OR retail*) and ("principle display panel" OR "principle display panels" OR signpost*) and (label* OR packag* OR nutri* OR food*) Limiters - Published Date from: 19900101-20101231
Search modes - Boolean/Phrase Interface - EBSCOhost
Search Screen - Advanced Search
Database - Business Source Corporate 30
PsycINFO - 8 records (0 unique records imported into EndNote)
S3 (consumer* OR effect* OR design* OR producer* OR retail*) and (icon OR icons OR logo OR logos OR scheme OR schemes) and (packag* OR label*) and (nutri* OR food*) Limiters - Publication Year from: 1990-2010; English
Search modes - Boolean/Phrase Interface - EBSCOhost
Search Screen - Advanced Search
Database - PsycINFO 20 Edit S3
S2 (consumer* OR effect* OR design* OR nutri* OR producer* OR retail*) and (icon OR icons OR logo OR logos OR scheme OR schemes) and front Limiters - Publication Year from: 1990-2010; English
Search modes - Boolean/Phrase Interface - EBSCOhost
Search Screen - Advanced Search
Database - PsycINFO 18 Edit S2
S1 (consumer* OR effect* OR design* OR nutri* OR producer* OR retail*) and ("principle display panel" OR "principle display panels" OR signpost*) Limiters - Publication Year from: 1990-2010; English
Search modes - Boolean/Phrase Interface - EBSCOhost
Search Screen - Advanced Search
Database - PsycINFO 45
AGRICOLA - 11 records (2 unique records imported into EndNote)
S3 (consumer* OR effect* OR design* OR nutri* OR producer* OR retail*) and (icon OR icons OR logo OR logos OR scheme OR schemes) and (label* OR packag*) Limiters - Date Published from: 19900101-20101231; Language: english
Search modes - Find all my search terms Interface - EBSCOhost
Search Screen - Advanced Search
Database - Agricola 95 Edit S3
S2 (consumer* OR effect* OR design* OR nutri* OR producer* OR retail*) and (icon OR icons OR logo OR logos OR scheme OR schemes) and front Limiters - Date Published from: 19900101-20101231; Language: english
Search modes - Find all my search terms Interface - EBSCOhost
Search Screen - Advanced Search
Database - Agricola 11 Edit S2
S1 (consumer* OR effect* OR design* OR nutri* OR producer* OR retail*) and ("principle display panel" OR "principle display panels" OR signpost*) Limiters - Date Published from: 19900101-20101231; Language: english
Search modes - Find all my search terms Interface - EBSCOhost
Search Screen - Advanced Search
Database - Agricola 11
Food Science and Technology Abstracts -28 records (21 unique records imported into EndNote)
S4 (consumer* OR effect* OR design* OR producer* OR retail*) and (icon OR icons OR logo OR logos OR scheme OR schemes) and (label* OR packag*) and nutri* Limiters - Publication Date from: 1990-2010; Language: English
Search modes - Find all my search terms Interface - EBSCOhost
Search Screen - Advanced Search
Database - FSTA - Food Science and Technology Abstracts 51 Edit S4
S3 (consumer* OR effect* OR design* OR nutri* OR producer* OR retail*) and (icon OR icons OR logo OR logos OR scheme OR schemes) and (label* OR packag*) Limiters - Publication Date from: 1990-2010; Language: English
Search modes - Find all my search terms Interface - EBSCOhost
Search Screen - Advanced Search
Database - FSTA - Food Science and Technology Abstracts 202 Edit S3
S2 (consumer* OR effect* OR design* OR nutri* OR producer* OR retail*) and (icon OR icons OR logo OR logos OR scheme OR schemes) and front Limiters - Publication Date from: 1990-2010; Language: English
Search modes - Find all my search terms Interface - EBSCOhost
Search Screen - Advanced Search
Database - FSTA - Food Science and Technology Abstracts 6 Edit S2
S1 (consumer* OR effect* OR design* OR nutri* OR producer* OR retail*) and ("principle display panel" OR "principle display panels" OR signpost*) Limiters - Publication Date from: 1990-2010; Language: English
Search modes - Find all my search terms Interface - EBSCOhost
Search Screen - Advanced Search
Database - FSTA - Food Science and Technology Abstracts 9
FOP_Labels3_search strategy- September 10, 2010
New York Academy of Medicine Grey Literature Report 1 record (1record imported into EndNote)
"front of package nutrition label*" OR "FOP label*" OR "front of package label*" OR "shelf-label*"
and
consumer* OR effect* OR design* OR nutrit*OR producer*OR retailer*
NTIS - 0 records (0 records imported into EndNote)
"front of package nutrition label" OR "FOP label" OR "front of package label" OR "shelf-labeling"
and
consumer* OR effect* OR design* OR nutrit*OR producer*OR retailer*
AgEcon - 4 records (4 records imported into EndNote)
"front of package nutrition label" OR "FOP label" OR "front of package label" OR "shelf-labeling"
and
consumer* OR effect* OR design* OR nutrit*OR producer*OR retailer*
CAB Abstracts - 21 records (4 unique records imported into EndNote)
S4 "shelf label*" Limiters - Publication Year from: 1990-2010; Language: english
Search modes - Find all my search terms Interface - EBSCOhost
Search Screen - Advanced Search
Database - CAB Abstracts 8 Edit S4
S3 front and pack* and (label* OR food* OR nutrit*) and (consumer* OR effect* OR design* OR nutrit*OR producer*OR retailer*) Limiters - Publication Year from: 1990-2010; Language: english
Search modes - Find all my search terms Interface - EBSCOhost
Search Screen - Advanced Search
Database - CAB Abstracts 44 Edit S3
S2 FOP and label* Limiters - Publication Year from: 1990-2010; Language: english
Search modes - Find all my search terms Interface - EBSCOhost
Search Screen - Advanced Search
Database - CAB Abstracts 2 Edit S2
S1 "front of package" Limiters - Publication Year from: 1990-2010; Language: english
Search modes - Find all my search terms Interface - EBSCOhost
Search Screen - Advanced Search
APPENDIX B: DISCUSSION GUIDE FOR EXPERT INTERVIEWS
To provide context for our discussion, what is your experience with front of package (FOP) or shelf labeling systems for nutrition labeling of food products in the U.S. or internationally?
Consumer Response
What are the key issues for consumers regarding FOP information?
Probes:
- What are the main consumer response issues suggested by existing research?
- Do (or would) consumers notice or pay attention to the information?
- Do (or would) consumers look for the information?
- Consumer perceptions of FOP
- Consumer understanding/confusion
- Use the information to make purchases
How do various factors influence consumer notice, perception, understanding, or use of FOP labeling?
Probes:
- Demographic subgroups
- Socioeconomic status
- Literacy
- Health status
- Family composition
- Can you suggest key literature (published or unpublished) on this issue?
Producer Response
What are the key issues for producers regarding FOP labeling?
Probes:
- Providing consumers with information
- Product sales
- Product reformulation (nutrients, types of products)
- Possible new product introduction
- Fitting FOP labeling on product labels
- Advertising products with FOP labeling
- Voluntary versus mandatory systems
- Can you suggest key studies (published or unpublished) on producer response to FOP labeling?
Retailer Response
What are the key issues for retailers regarding FOP labeling?
Probes:
- Providing consumers with information
- Competitive position
- Product sales
- Retailer shelf-labeling systems versus producer package labeling systems
- Can you suggest key studies (published or unpublished) on retailer response to FOP labeling?
Public Health Issues
Can FOP labeling impact public health?
Probes:
- What is needed for FOP to have a beneficial effect on public health?
- What types of measures of public health outcomes would be useful in evaluating public health effects of FOP labeling?
- Are there any "downside" effects?
- Do you know of key studies (published or unpublished) suggesting effects on health?
Criteria for Developing and Assessing FOP Systems
What components are most important to capture in a nutrient-specific FOP system?
Probes:
- Nutrients, food components
- Context of daily diet (e.g., % daily values)
- Colors, shapes, symbols
- Food category specific or across all foods
What components are most important to capture in a summary FOP system?
Probes:
- Nutrients, food components
- Context of daily diet (e.g., % daily values)
- Colors, shapes, symbols
- Food category specific or across all foods
How would you evaluate the ability of a summary system/symbol to rank foods in nutritional quality?
Probes:
- Overall diet quality index (e.g., HEI)
- Expert opinion rankings
- Problems/issues with testing
APPENDIX C: SUMMARY OF EVIDENCE TO ADDRESS FRONT-OF-PACK RESEARCH QUESTIONS
Earlier sections of the report systematically reviewed study findings in terms of a conceptual framework that tracked the effects of FOP labels and shelf labels from processing and recognition of healthy choices through sales and food reformulation. Many of the policy questions around FOP labels and shelf labels are more practically focused. For instance, the Food and Drug Administration (FDA) requested public comments on the five major research questions presented in their public hearings on FOP labeling issues. Table C-1 briefly summarizes some of the published research identified by RTI for the literature review that addresses these questions. It should be noted that the literature was not systematically reviewed to address these research questions; rather answers were found when searching for information that fit into the conceptual framework.
Table C-1. Studies that Address FDA Policy Questions
Attitudes: How do consumers feel about FOP labels?
- What are consumer attitudes toward nutrition symbols in general and different types of symbols?General attitudes
- Consumers generally have favorable opinions regarding FOP labeling. For example, the majority of consumers (96%) in a UK study believed that FOP labels would be helpful in making healthier decisions (Synovate, 2005a). Results of a survey of Korean consumers found that on average consumers agreed that FOP labeling is quite necessary and helpful when selecting foods at the supermarket (Kim & Kim, 2009).
- According to a focus group study, participants believed nutrition symbols on the front of food packages can assist in choosing healthy products, but participants said they may not always use nutrition logos such as the Keyhole symbol to make food purchase decisions, because other factors such as price and taste sometimes take precedence over nutrition (Lando & Labiner-Wolfe, 2007).
- One study found that consumers find the variety of food products carrying the Choices logo at the supermarket confusing (Vyth et al., 2009)
Attitudes toward specific labeling schemes
- Consumers like labels that include TL color-coding. In the UK, studies found that consumers like the color-coded GDA, TL, the Wheel of Health or circular TL format, and a scheme that combined text, the TL, and %GDA (Synovate, 2005a; Which ?, 2006; Malam et al., 2009). A study by the National Heart Foundation of Australia found that 44% of Australian consumers preferred the TL labeling scheme versus 32% for the %DI and 23% for the Tick (National Heart Foundation of Australia, 2009). European consumers like a Wheel of Health and a TL scheme compared with formats such as stars, smileys, and a health protection shield (Feunekes et al., 2008-Study 1). However, another study found that in Belgium subjects preferred the GDA, and in Germany subjects preferred the TL scheme (Möser et al., 2010).
- Evidence also suggests that consumers like simpler formats. For instance, a focus group study conducted in the Netherlands, discussed eight executions of FOP calorie flags with consumers finding that simpler flags depicting the number of calories per serving or 100 grams were most preferred by participants. (van Kleef et al., 2008).
- What are consumer attitudes toward products or brands that carry a nutrition symbol compared with other products or brands in the same product category (e.g., cereals) and in other categories that do not carry such a symbol? Which of these types of messages or symbols, if any, are more influential in product perception and purchases?FOP and shelf-Labeling schemes' effect on purchase behavior
- The GDA format had a positive effect on purchases (Schor et al., 2010).
- The TL scheme had no effect on purchases (Sacks et al., 2009).
- Guiding Stars, NuVal, and another brand-specific shelf-tag system had positive effects on consumers' purchase behavior (Guiding Stars Licensing Company, 2010; NuVal, 2010; Schucker et al., 1992).
- No significant differences were found in purchase behavior between baseline and intervention for the "Fuel Your Life" shelf tags (Freedman & Connors, 2010).
Awareness and Format: Do consumers notice FOP labeling?
- Ease of navigation how easy is it to find the symbol on the product? How important is it that the symbol always appears in the same location? Is it easier for the symbol to be horizontal or vertical?
- Study participants responded faster when logo and location did not change in two consecutive exposures, and when the logos were presented on the top right of the food package (Bialkova & van Trijp, 2010).
- Use of images versus numbers Are consumers more likely to be drawn to images, numbers, or a combination of the two?
- Various studies seem to suggest that an FOP format with a combination of images, numbers, and text will allow all types of consumers to easily interpret information:
- One study reporting on nutrition label formats (not specifically FOP) found that information presented in adjective format (e.g., "excellent," "good," and "fair") proved superior to % format (Scammon, 1977).
- A multipart qualitative and quantitative study reported that strongest FOP formats combine text (high, medium, low), TL colors, and %GDA information (Malam et al., 2009).
- Parents in a New Zealand study had different preferences for specific label formats but agreed that labels with graphics (e.g., TL) were easier to process than labels with numeric information (e.g., %DI) (Maubach & Hoek, 2010).
- In a UK qualitative study to further investigate consumer preferences of the multiple TL versus the colored GDA (CGDA) label, consumers thought the multiple TL was easy to understand. Color-coding was seen as an ideal method to convey information quickly, but text indicating high, medium, and low within the TLs was also important for quick decisions (Synovate, 2005b).
- Researchers in a U.S. study determined that less nutrition-conscious consumers prefer summary labels requiring less time to process, while nutrition-conscious consumers and consumers who do most of their households' shopping prefer the detailed labels (Berning et al., 2007).
- Various studies seem to suggest that an FOP format with a combination of images, numbers, and text will allow all types of consumers to easily interpret information:
- Amount of information At what point is the format "overpacked" and therefore off-putting? If a nutrient-specific approach is used, is there a limit to the number of nutrients that should be included? If a graduated overall nutritional value is used, what range would be most easy to understand (on a scale of 0 to 3, or 1 to 5)? And is a certain amount of space around the format important?
- A review article indicated that several studies have found instances of choice overload, while several other studies have not (Sheibehenne et al., 2010).
- One study found no difference between 4 or 8 nutrients listed on food labels (Scammon, 1977).
- One study found that participants prefer 4 to 5 nutrients on a label (Kim & Kim, 2009).
- Use of color What effect does color and intensity of color have on whether a certain format "pops"? What effect does using all blue or all green have on influencing consumer perceptions of the nutritional value of different products? What about using groups of color, such as red, yellow, and green?
- The circular-shaped colors of the multiple TL label displayed on a white background were considered to increase the impact of color-coding, making the label easier to read at a glance (Synovate, 2005b).
- A study comparing the Choices logo, monochrome GDA and colored GDA found that consumers' attention was drawn to FOP labels with monochrome color (Bialkova & van Trijp, 2010).
- One European study found that consumers were better able to identify healthy foods when they saw a colored rather than a monochrome set of nutrition labels (Feunekes et al., 2008).
- A study indicated that although many consumers understand the TL, they tend to overinterpret the severity of the red and amber colors (Wills, Grunert et al., 2010). For example, 73% of respondents believed that they should try not to eat products indicated by red labels, whereas the FoSA's definition is that it is fine to have products in red as a treat (Grunert, Wills, et al., 2010).
- Shapes Are there certain shapes that have inherent meaning, such as stars or checks?
- Results of a focus group in the UK found that the geometric shape of the colored-GDA label provided credibility (Synovate, 2005b).
- Size How large should information be relative to the rest of the package?
- Consumers' attention was drawn to FOP labels with doubled rather than standard display size (Bialkova & van Trijp, 2010).
- Results of a focus group found that participants believed that size of FOP labels should be set and proportionate to the product package (Synovate, 2005b).
- Ease of comprehension Is it easy enough for consumers to understand at a glance (3 seconds or less) in a crowded grocery store?
- No studies specifically reported that consumers could comprehend the labels in 3 seconds or less, the fastest processing time was 5.1 seconds for the TL label (Synovate, 2005a). However, several studies reported evidence that some labels were easier to process quickly compared with other schemes.
- Several studies found that consumers find the TL scheme easier and quicker to process than other schemes such as the GDA and %DI (Kelly et al., 2009; Möser et al., 2010; Which?, 2006).
- One eye-tracking study found that consumers more quickly examined nutrients on the label with the TL scheme (Jones & Richardson, 2007).
- Two studies found that consumers were able to complete a task to identify healthier food choices more quickly when they were guided by simple or TL colored schemes (e.g., stars, ticks, TL, colored GDA) (Feunekes et al., 2008; Synovate, 2005a)
- No studies specifically reported that consumers could comprehend the labels in 3 seconds or less, the fastest processing time was 5.1 seconds for the TL label (Synovate, 2005a). However, several studies reported evidence that some labels were easier to process quickly compared with other schemes.
- Branding What effect, if any, would it have to associate the front or the back symbol with the Nutrition Facts Panel? Would it affect consumers' level of trust, comfort? Would it affect consumers' likelihood to use Nutrition Facts? Can you discuss the relative importance of consistency in format as it relates to consumer recognition of the format and likelihood to use it?
- Associating the FOP scheme with the NFP could potentially positively affect consumers' attention. One study using eye tracking in the UK found that TLs guide the eyes from the most prominent feature of a TL to more detailed information presented on the numeric back-of-package label (Jones & Richardson, 2007).
Knowledge: Do consumers accurately understand what is on FOP labels?Section 5.1.3 of the report provides additional information on this topic
- What are consumer interpretations of symbol-carrying products or brands in terms of their overall healthfulness, specific health benefits, featured nutrition attributes, nonfeatured nutrition attributes, quality, and any other nonnutrition attributes?
- Studies in Europe found that consumers who see FOP labels are better able to identify healthier food choices (Borgmeier & Westenhoefer, 2009; Jones & Richardson, 2007; Synovate, 2005a).
- What is consumer interpretation of the co-existence on the food label of symbols and other nutrition messages (e.g., a nutrient content claim), when present?
- Two studies conducted in New Zealand tested consumer evaluations of breakfast cereals using factorial experiments exposing respondents to different FOP labels, product claims, and better versus worse nutrition content. The first study did not find that adding a claim improved consumers' perception of the healthiness of the product. However, the author suggested that since the health claim was with regard to calcium fortification, consumers may not find calcium to be an important nutrient to include in cereal since it is usually consumed with milk. The second study found that the introduction of product claims had the strongest influence on consumers' behavior, particularly when information was presented in numeric formats such as the %DI (Maubach et al., 2009).
- What is consumer interpretation of the co-existence on the food label of symbols and quantitative nutrition information (e.g., the Nutrition Facts Panel)?
- One New Zealand study allowed study participants to refer to the Nutrition Information Panel when viewing products with TL and %DI FOP labels. Respondents viewing the TL condition had to view the Nutrition Information Panel to read about the products' fiber content but this information was displayed on the %DI for respondents who viewed this labeling scheme. Interestingly, a large number of respondents viewing both FOP labels selected "Don't Know" for the question on fiber content (Maubach et al., 2009).
- Another study found that there was no difference among the different FOP schemes tested in the number of consumers clicking to see the NFP when respondents were asked about the health benefits of a product (Lin & Levy, 2010-Study 1).
- What is consumer interpretation of the co-existence of front-label nutrition symbols and nutrition symbols present on the tags of supermarket shelves, when available?
- No answer presented in the studies reviewed.
- How does consumer interpretation (11 14 above) differ for consumers aged 12 to 17? For consumers who are at high risk of obesity or chronic disease?
- Although a study located during our review found that adolescents were five times more likely to use front label or nutrition claims than nutrient labels compared with other groups (McCullum & Achterberg, 1997), no studies reported on how adolescent consumers' interpretation of FOP labels differs from other groups.
- Many studies found that low-educated consumers or consumers from low social grades had more difficulty understanding FOP labels than consumers who were highly educated or from higher social grades. Labels that were difficult to interpret included the Heart Foundation Tick, GDA scheme (particularly schemes without TL colors), and monochrome %DI scheme. (Grunert, Wills, et al., 2010; Kelly et al., 2009; Scott & Worsley, 1994).
- A study comparing the TL to GDA variants and a simple tick found that the TL yielded the highest average of correct choices among subjects and there was no difference in understanding by label regarding BMI (Borgmeier & Westenhoefer, 2009).
- What are the advantages and disadvantages of front-of-pack information systems that provide summary interpretive guidance versus those that provide specific nutrition information?
- A study testing the Choices logo versus variations of the GDA found that attention capture was faster for the summary system (e.g., Choices logo) (Bialkova & van Trijp, 2010).
- Six studies reviewed tested consumer understanding of summary versus nutrient-specific systems. Three of six studies found that FOP nutrient-specific systems led consumers to more easily identify healthy foods compared with summary systems (Andrews & Burton, 2010; Borgmeier & Westenhoefer, 2009; Lin & Levy, 2010). Two other studies found no difference between labels (Lin & Levy, 2010; National Heart Foundation of Australia, 2009) while one study found that summary formats were easier to interpret than nutrient-specific schemes (Feunekes et al., 2008).
- Three of three studies reporting on consumer liking of these two main formats found that consumers like nutrient specific formats, in particular, the TL scheme (Feunekes et al., 2008; Lin & Levy, 2010; National Heart Foundation of Australia, 2009).
- A multiple-part qualitative and quantitative study, reported that four labels incorporating text stating whether food was high, medium, or low in specific nutrients (e.g., calories, fat, saturated fat, sugar and salt) were the strongest performers with regard to understanding. However the author reports that the strongest FOP formats combine text (high, medium, low), TL colors, and %GDA information (Malam et al., 2009).
- What are the advantages and disadvantages of images versus numbers in portraying basic nutritional information? Are consumers more likely to understand one more than the other? Are labels that combine the two approaches more or less helpful to consumers?
- A comparison among different types of labels in Europe found that consumers were better able to identify healthier foods if they saw labels with TL symbols and multiple stars than single numerical symbols (Borgmeier & Westenhoefer, 2009; Feunekes et al., 2008; Jones & Richardson, 2007; Kelly et al., 2009).
Behavior: Do consumers incorporate information on FOP labels into their purchasing decisions and consume healthier diets?Section 5.1.4 of the report provides additional information on this topic.
- When do consumers use front-of-pack nutrition labels and what do they use them for? Do they use them in making purchasing decisions? Do they use them once they bring the products home?
- In the store environment, consumers generally use FOP labels to compare products they are interested in buying to assess which of two or more products is the healthiest. Consumers do not use FOP labels as frequently in their homes (Malam et al., 2009).
- Does front-of-pack nutrition information direct consumers toward purchase of foods that bear them and, if so, to what extent?Likely Purchase
- One study found that Greek consumers who saw FOP levels would buy more for foods with nutrition labels (Drichoutis et al., 2009).
- Research conducted in Australia to evaluate the Heart Foundation's effect on sales showed that consumers' intention to purchase a brand of cereal increased by 10% when the Tick logo was added to the label. When the full meaning of the label was explained to study participants, intent to purchase increased to 33% (Fear et al., 2004).
- A Harris-Interactive poll found that 43% of consumers believed that FOP labeling has changed many or some of the products they purchase, while 44% of consumers polled believed FOP food labeling has not had an effect on the products they purchase (Green, 2006).
Actual Purchase
- One article reported on a 6-week trial conducted by the Co-operative Group's food retail chain in six stores and found that FOP labels influenced consumers to purchase foods that were low in salt and fat (Marketing, 2004).
- Another article reported that the GDA label lead consumers to purchase low-fat ready-to-eat meals as opposed to high-fat ready-to-eat meals (Schor et al., 2010).
- A U.S. study of the Guiding Stars shelf-label system found a 0.5 percentage point increase in sales of healthier foods after 1 year and a 1.4 percentage point increase in sales of healthier foods after 2 years (Sutherland et al., 2010).
- Another study conducted by Hannaford supermarkets to evaluate the Guiding Stars program by analyzing 12-month sales trends found that sales of starred foods increased while sales of nonstarred foods decreased. Some of the foods that consumers had switched to as a result of the program included lean ground beef versus fattier ground beef and skim milk versus whole milk (Guiding Stars Licensing Company, 2010).
- The NuVal system was also found to change consumers' purchase behavior, leading to healthier food choices. Sales volume of NuVal products scoring 50 to 100 outsold products with low scores (NuVal, 2010).
- One study measuring the effect of a brand-specific nutrition shelf-tag system found significant increases of market shares of many healthier shelf-tagged products (Schucker et al., 1992).
- Another study analyzing sales data of a major UK retailer to assess the healthiness of foods after the introduction of the TL found no changes on food purchases (Sacks et al., 2009).
- Does front-of-pack nutrition information affect the nutritional quality of the total diet of consumers who use the symbols and, if so, to what extent?
- A Swedish study found that consumers who had knowledge of the Keyhole symbol had significantly higher intakes of low-fat foods than those who did not have knowledge of the symbol. However one exception was reported awareness of the Keyhole symbol among the least educated consumers did not affect their reported consumption of low-fat foods (Larsson et al., 1999).
- Another study conducted in Germany that tested the "healthy choice tick," "multiple TL," "monochrome daily amount," colored GDA, and "no label" found that participants' envisioned daily food consumption did not differ significantly between the label formats (Borgmeier & Westenhoefer, 2009). Canadian individuals who purchased products with Canada's Health Check logo had lower fat diets than those individuals who did not purchase products with the logo (30.4% vs. 33.9% calories from fat; p 0.05) (Reid et al., 2004).
- The effect of sales of Guiding Stars products translates to a reduction in over 240,000 calories and 60,000 grams of sugar and an increase in over 19,000 grams of fiber in the foods purchased (Sutherland et al., 2010).
- Another shelf-labeling system that indicated whether a product was low in fats did not prove as successful as the Guiding Stars system. An experimental study evaluating this system found no significant differences in total amount of fat in products sold (Steenhuis et al., 2004).
- What difference does it make to purchasing behavior if all products in a given category carry front-of-pack nutrition information vs. only some products in the category carry front-of-pack nutrition information?
- No answer presented in the studies reviewed.
- What are the differences, if any, in consumer response between various product categories (e.g., snacks, meals, dairy products, vegetables and fruits)?
- Consumers found certain product categories unnecessary for checking FOP labels. These categories include treats, staple foods, products used in small portions or ingredients when cooking (e.g., butter), healthy foods, and habitual purchases (Malam et al., 2009).
- A UK study found that consumers would like to see FOP labels on many foods. The highest ranked category was "burgers, sausages, nuggets, and fish fingers" (Synovate, 2005a).
- Does consumer use of front-of-pack nutrition information vary depending on store type where food is purchased (e.g., large supermarket vs. convenient store)?
- No answer presented in the studies reviewed.
- How do other labels on the fronts of packages (e.g. "natural" or "organic") interact with a front-of-pack nutrition label in influencing consumer behavior?
- No answer presented in the studies reviewed.
- Is front-of-pack nutrition labeling more likely to influence consumer behavior when paired with educational intervention?
- No answer presented in the studies reviewed.
- Is there any evidence that use of front-of-pack nutrition information helps reduce time needed for product selection, improved quality of choices, or both?
- An eye-tracking study found that attention capture was faster when FOP labels were presented as opposed to when they were not presented (Bialkova & van Trijp, 2010).
- Which formats allow consumers to make the healthiest decisions?
- Nutrient-specific formats help consumers make healthier decisions compared with summary FOP formats (Andrews & Burton, 2010; Lin & Levy, 2010).
- Two studies found that consumers were more able to quickly complete a task to identify healthier food choices when they were guided by color-coded or simple food labels (Feunekes et al., 2008; Which?, 2006).
Subgroup Differences: What are the differences, if any, in consumer understanding across various demographic subgroups?Section 5.1.6 of the report provides information on this topic