
50-Year Trends and Safety Net Impacts Report
Poverty in the United States: 50-Year Trends and Safety Net Impacts presents analyses of the impact of the safety net on poverty rates and a close look at populations experiencing high risks of poverty during the 50 years since the War on Poverty began.
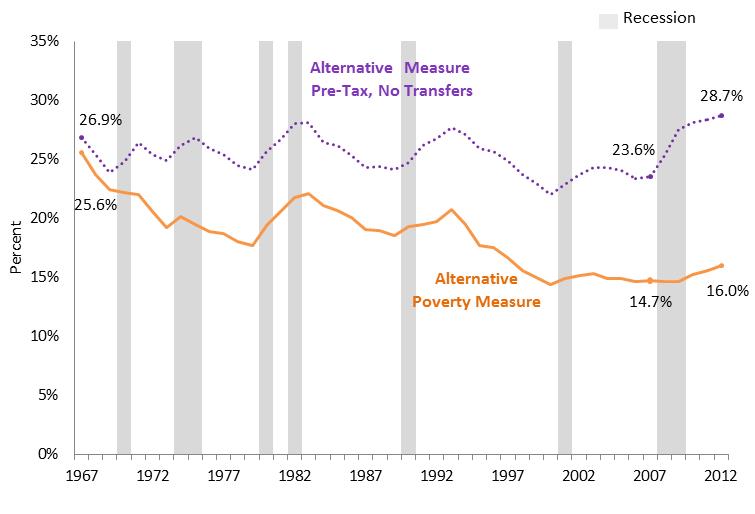
The report highlights the increasing role of safety net programs in lifting families and children out of poverty between 1967 and 2012 by providing estimates of what poverty rates would have looked like had resources from government policies and programs not been available (See Figure 7).
Data Tables (Excel)
Data tables include rates of official and alternative poverty from 1964 to 2014 and supplemental poverty rates for 2014. The supplemental poverty measure examines individual safety net programs and shows how poverty rates would have increased if resources from specific safety net programs had not been available. The alternative poverty measure is based on the supplemental measure and fills the critical gap in knowledge necessary to evaluate the impact of the full federal safety net back to 1967.
Official poverty rates are examined for different segments of the population. Over the past fifty years, children, single mothers and their families, Blacks and Hispanics, and individuals with lower levels of education have faced unique economic challenges.