
Extended LTSS Utilization Makes Older Adults More Reliant on Medicaid Issue Brief
ASPE ISSUE BRIEF
Richard W. Johnson and Melissa M. Favreault
Urban Institute
Judith Dey, William Marton, and Lauren Anderson
U.S. Department of Health and Human Services
January 2021
Link to Printer Friendly Version in PDF Format (9 PDF pages)
ABSTRACT: Although only a minority of older adults will ever enroll in Medicaid, the program provides an important safety net for older people who need long-term services and supports (LTSS) and either earned little over their lifetime or had financial resources but depleted them over time. Based on microsimulation modeling, we estimate that more than half of adults in the bottom fifth of the lifetime earnings distribution who survive to age 65 will be enrolled in Medicaid for at least three years after age 65. Many older adults who receive extensive paid LTSS will eventually enroll in Medicaid, even those who had substantial earnings over their lifetime. Our analysis indicates that among adults who receive paid LTSS for at least five years after age 65, more than 8 in 10 in the middle fifth of the lifetime earnings distribution and nearly half in the top fifth of the earnings distribution will eventually be enrolled in Medicaid.
The full report on which this brief is based is “Economic Hardship and Medicaid Enrollment in Later Life: Assessing the Impact of Disability, Health, and Marital Status Shocks,” available at https://aspe.hhs.gov/basic-report/economic-hardship-and-medicaid-enrollment-later-life-assessing-impact-disability-health-and-marital-status-shocks. The DYNASIM projections were developed by Melissa Favreault, Karen Smith, Paul Johnson, Doug Murray, and Damir Cosic at the Urban Institute, with conceptual and modeling help from William Marton and Brenda Spillman.
This report was prepared under contract #HHSP233201600024I between HHS's ASPE/BHDAP and the Urban Institute. For additional information about this subject, you can visit the BHDAP home page at https://aspe.hhs.gov/bhdap or contact the ASPE Project Officers, at HHS/ASPE/BHDAP, Room 424E, H.H. Humphrey Building, 200 Independence Avenue, S.W., Washington, D.C., 20201; Judith.Dey@hhs.gov, Lauren.Anderson@hhs.gov, Helen.Lamont@hhs.gov.
DISCLAIMER: The opinions and views expressed in this report are those of the authors. They do not reflect the views of the Department of Health and Human Services, the contractor or any other funding organization. This report was completed and submitted on October 2020.
| Although only a minority of older adults will ever enroll in Medicaid, the program provides an important safety net for older people who need long-term services and supports (LTSS) and either earned little over their lifetime or had financial resources but depleted them over time. Based on microsimulation modeling, we estimate that more than half of adults in the bottom fifth of the lifetime earnings distribution who survive to age 65 will be enrolled in Medicaid for at least three years after age 65. Many older adults who receive extensive paid LTSS will eventually enroll in Medicaid, even those who had substantial earnings over their lifetime. Our analysis indicates that among adults who receive paid LTSS for at least five years after age 65, more than eight in ten in the middle fifth of the lifetime earnings distribution and nearly half in the top fifth of the earnings distribution will eventually be enrolled in Medicaid. |
Background
Medicaid, the combined federal and state program that finances health care for needy children and adults, provides an important safety net for older people. Although Medicare covers nearly all older adults, beneficiaries often face significant deductibles and copays and the program excludes certain services. Most important, Medicare does not cover typical expenses for long-term services and supports (LTSS).[1] Because paid LTSS is costly and relatively few older adults are covered by private long-term care insurance (LTCI), older adults who need help with everyday activities typically rely on unpaid family caregivers. But when unpaid caregivers are unavailable or LTSS needs exceed what family and friends can provide, older adults with disabilities typically supplement this assistance with paid help, either provided at home or in alternative residential settings, such as nursing homes. They must generally pay for this care out-of-pocket, and some deplete their savings and enroll in Medicaid if these costs exceed their income. Medicaid, in fact, is the largest payer of LTSS expenses (Collello 2018).
Adults ages 65 and older may qualify for Medicaid if they have virtually no assets, except for a home, and very little income. The program’s asset test limits Medicaid eligibility to people with no more than $2,000 in countable assets if single and no more than $3,000 if married. Countable assets exclude the value of the home and such things as automobiles, household goods, the surrender value of life insurance, and burial funds. Income rules vary by state and are more complicated. Supplemental Security Income (SSI) beneficiaries qualify for Medicaid in all states, but SSI serves only the most impoverished population. A single SSI beneficiary without earnings who does not receive Social Security or other income, like a state supplement could receive no more than $771 in monthly income in 2019 (equivalent to $9,252 per year), well below the federal poverty level (FPL). Many states extend Medicaid eligibility to people with income up to 138% of the FPL. In addition, older adults may receive Medicaid-financed home and community-based services through state waiver programs. Again, income eligibility varies by state, and the income eligibility threshold ranges up to 300% of the maximum SSI benefit.
Many states account for individuals’ health care spending when determining Medicaid eligibility by subtracting applicants’ out-of-pocket costs for medically necessary services and supplies from their countable income. This adjustment essentially allows people to “spenddown” their income until they qualify for Medicaid. Other states achieve similar outcomes by allowing applicants to assign that portion of their income that exceeds the Medicaid income threshold to a special trust used to help cover service costs. The state receives any funds remaining in these trusts after a Medicaid enrollee’s death, up to the amount the state paid in Medicaid benefits.
A relatively small share of the population moves onto Medicaid at older ages. Weiner et al. (2013) estimate that about 10% of older adults deplete enough of their wealth over 12 years to qualify for Medicaid; Lee, Kim, and Tanenbaum (2006) estimate that about 16% of adults ages 70 and older enroll in Medicaid over 10 years; and Spillman and Waidmann (2014, 2015) estimate that about 5% of older adults transition to Medicaid over 4 years. Most Medicaid recipients have few financial resources (GAO 2014). Some studies find that nursing home care often precipitates Medicaid coverage (Borella, De Nardi and French 2017; Keohane, Trivedi and Mor 2017; Spillman and Waidmann 2014, 2015). However, Weiner et al. (2013) find that one-half of older adults who deplete most of their wealth and qualify for Medicaid did not receive any paid LTSS.
Enrollment in Medicaid has important fiscal ramifications for public budgets. Total state-financed Medicaid spending accounted for about 30% of state budgets in 2018, including federal reimbursements (National Association of State Budget Officers 2018), and the Centers for Medicare & Medicaid Services expects spending to grow 6% per year from 2020 to 2027 (Sisko et al. 2019).
Methods
The analysis measures the likelihood of Medicaid enrollment after 65 and how it varies with the duration of LTSS use and lifetime earnings quintile (bottom, second, third, fourth, and top).[2] People who receive extensive paid LTSS are more likely to deplete their savings and qualify for Medicaid than those who receive little or no paid LTSS. Our sample consists of adults born between 1941 and 1974 who survive to age 65 and are not enrolled in Medicaid at age 65.
The analysis defines paid LTSS as nursing home care or other paid LTSS, including other residential care and paid home care. These paid services include those financed by insurance, including Medicaid, and services paid out-of-pocket. We consider only paid LTSS received by adults with significant LTSS need, who require help with two or more ADLs or have severe cognitive impairment; this definition is similar to the eligibility requirement for benefits under tax-qualified LTCI policies as specified in the Health Insurance Portability and Accountability Act of 1996. Our care measure reflects LTSS receipt for only a given individual, not the experience of his or her spouse, even though spousal LTSS use can deplete household savings and lead to Medicaid eligibility.
We measure Medicaid enrollment rates after 65 by simulating income, wealth, disability status, LTSS use, and insurance coverage using the Urban Institute’s Dynamic Simulation of Income Model 4 (DYNASIM4). DYNASIM4 starts with a nationally representative sample of the United States population from the 2004 and 2008 panels of the Survey of Income and Program Participation. It “ages” the population year-by-year, simulating demographic and economic events using transition probabilities and rule-based algorithms. The model’s aging rules are based on rich longitudinal data from multiple household surveys, and the health and mortality projections incorporate socioeconomic differences, including those defined by education, lifetime earnings, marital status, and race and Hispanic origin. DYNASIM4 projections reflect compositional changes in the population over the next seven decades. Many outcomes are calibrated to the intermediate assumptions of the 2019 Social Security trustees report (Board of Trustees, Federal Old-Age and Survivors Insurance and Disability Insurance Trust Funds 2019), typically based on age and sex. The report and the projections do not take into account any effects from the 2020 coronavirus pandemic.
Projections of LTSS utilization are based on equations of different types of paid care--home care, nursing home, and residential care--that are estimated jointly and depend on disability severity, other personal and family characteristics, and relative prices. Prices for paid care in DYNASIM4 are based on the state-specific median for each service type (Genworth 2019), with small adjustments based on income, LTCI coverage, and disability severity.
We model Medicaid eligibility using program rules for all 50 states and the District of Columbia. Because many eligible older adults do not enroll in the program, we estimate a model of Medicaid enrollment that assigns a greater likelihood of enrollment to eligible adults with the fewest economic resources and the most severe disabilities.
We report Medicaid enrollment for each fifth of the lifetime earnings distribution, which averages earnings from spouses for married adults. For people who survived to age 65 and reached that age between 2018 and 2022, the earnings cutoff is $1.48 million (in 2020 inflation-adjusted dollars) for the bottom quintile, $2.44 million for the second quintile, $3.43 million for the third quintile, and $4.75 million for the fourth quintile. (The highest quintile includes those with lifetime income that exceeds $4.75 million.) Dividing these numbers by 40 to proxy for the number of years in a typical career, we estimate that cutoffs for average annual lifetime earnings are $37,100 for the bottom quintile, $61,100 for the second quintile, $85,690 for the middle quintile, and $118,830 for the fourth quintile.
Results
Medicaid Eligibility by Lifetime Earnings
A significant minority of older adults enroll in Medicaid. Among those not enrolled in Medicaid at age 65, we estimate that 29% are subsequently enrolled for at least one year, 22% are enrolled for at least three years, and 18% are enrolled for at least five years. Although older adults with limited lifetime earnings are much more likely to be enrolled in Medicaid than those with more earnings, many older adults with substantial lifetime earnings are eventually enrolled, including 25% of older adults in the middle quintile of lifetime earnings, 16% of those in the fourth quintile, and 9% of those in the top quintile (Figure 1). More than one in ten (13%) of older adults in the middle quintile of lifetime earnings who were not enrolled in Medicaid at age 65 are eventually enrolled in the program for five or more years.
| FIGURE 1. Percentage Enrolled in Medicaid by Duration and Lifetime Earnings Quintile |
|---|
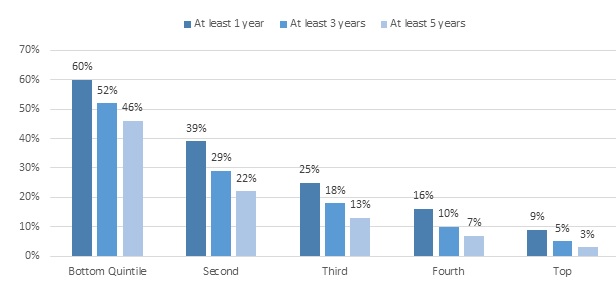 |
| NOTE: Estimates are for adults born between 1941 and 1974 who survive to age 65 and were not enrolled in Medicaid at age 65. |
Medicaid Enrollment by Paid LTSS Use
Medicaid enrollment is closely related to the receipt of paid LTSS throughout the lifetime earnings distribution. Among older adults in the bottom lifetime earnings quintile who are not enrolled in Medicaid at age 65, we estimate that those who receive at least five years of paid LTSS are almost three times as likely as those who never receive paid LTSS to eventually enroll in Medicaid (95% versus 33%). Our projections show that in the middle earnings quintile, those who receive at least five years of paid LTSS are about 15 times as likely as those who never receive paid LTSS to eventually enroll in Medicaid (87% versus 6%), and in the top earnings quintile those who receive some paid LTSS are 53 times as likely as those who never receive paid LTSS to eventually enroll in the program (53% versus 1%). Unlike people with limited lifetime earnings, those with relatively high lifetime earnings cannot generally qualify for Medicaid unless they pay for LTSS and spend a substantial portion of their savings.
| FIGURE 2. Percentage Enrolled in Medicaid after Age 65 by Duration of Paid LTSS Use and Lifetime Earnings Quintile |
|---|
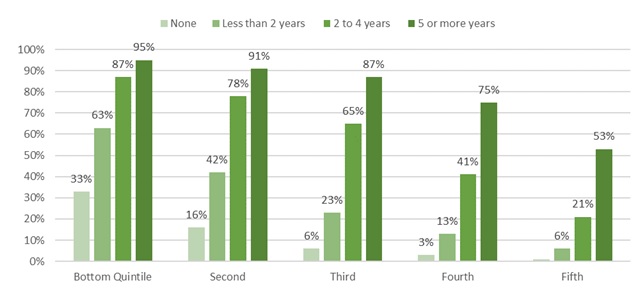 |
| NOTE: Estimates are for adults born between 1941 and 1974 who survive to age 65 and were not enrolled in Medicaid at age 65. |
Conclusion
Although only a minority of Americans will ever be enrolled in Medicaid after age 65, the program provides crucial health and LTSS benefits for many older adults who develop serious LTSS needs, even those who had substantial earnings over their lifetime. Paid LTSS is expensive and third-party reimbursement is rare except for people who can qualify for Medicaid because they never had much financial resources or were forced to deplete their resources. Among people who receive at least five years of paid LTSS after 65, we estimate that nearly half of those in the top fifth of the lifetime earnings distribution and more than eight in ten of those in the middle fifth of the earnings distribution will eventually be enrolled in Medicaid. These results highlight the need for better preparation for LTSS expenses by both individuals and policymakers, especially as population aging increases the number of people who may enroll in Medicaid in later life.
References
Baird, Matthew, Michael Hurd, and Susann Rohwedder. 2016. “Medicaid Spend-down: The Importance of Strategic Asset Transfers to Reach Medicaid Eligibility.” Santa Monica, CA: RAND.
Board of Trustees, Federal Old-Age and Survivors Insurance and Disability Insurance Trust Funds. 2019. The 2019 Annual Report of the Board of Trustees of the Federal Old-Age and Survivors Insurance and Disability Insurance Trust Funds. Washington, DC: Board of Trustees, Federal Old-Age and Survivors Insurance and Disability Insurance Trust Funds.
Borella, Margherita, Mariachristina De Nardi, and Eric French. 2017. “Who Receives Medicaid in Old Age? Rules and Reality.” Fiscal Studies, 39(1): 65-93.
Collello, Kirsten. 2018. “Who Pays for Long-Term Services and Supports?” Washington, DC: Congressional Research Office.
Genworth. 2019. “Cost of Care Survey 2019: Median Cost Data Tables.” Richmond, VA: Genworth. https://pro.genworth.com/riiproweb/productinfo/pdf/282102.pdf.
Government Accountability Office (GAO). 2014. “Medicaid: Financial Characteristics of Approved Applicants and Methods Used to Reduce Assets to Qualify for Nursing Home Coverage.” GAO-14-473. Washington, DC: Government Accountability Office. https://www.gao.gov/assets/670/663417.pdf.
Katz, S., A.B. Ford, R.W. Moskowitz, B. A. Jackson, and M.W. Jaffe. 1963. “Studies of Illness in the Aged. The Index of ADL: A Standardized Measure of Biological and Psychosocial Function.” JAMA, 185: 914-9.
Keohane, Laura M., Amal N. Trivedi, and Vincent Mor. 2017. “Recent Health Care Use and Medicaid Entry of Medicare Beneficiaries.” Gerontologist, 57(5): 977-986. doi:10.1093/geront/gnw189.
Lee, Jinkook, Hyungsoo Kim, and Sandra Tanenbaum. 2006. “Medicaid and Family Wealth Transfer.” Gerontologist, 46(1): 6-13.
National Association of State Budget Officers. 2018. 2018 State Expenditure Report. Washington, DC: National Association of State Budget Officers.
Semega, Jessica, Melissa Kollar, John Creamer, and Abinash Mohanty. 2019. “Income and Poverty in the United States; 2018.” Current Population Report P60-266. Washington, DC: US Census Bureau.
Sisko, Andrea M., Sean P. Keehan, John A. Poisal, Gigi A. Cuckler, Sheila D. Smith, Andrew J. Madison, Kathryn E. Rennie, and James C. Hardesty. 2019. “National Health Expenditure Projections, 2018-27: Economic and Demographic Trends Drive Spending and Enrollment Growth.” Health Affairs, 38(3): 491-501.
Social Security Administration. “SSI Federal Payment Amounts for 2020.” 2020. https://www.ssa.gov/oact/cola/SSI.html.
Spillman, Brenda, and Timothy Waidmann. 2014. “Rates and Timing of Medicaid Enrollment among Older Americans.” Washington, DC: U.S. Department of Health and Human Services, Office of the Assistant Secretary for Planning and Evaluation. https://aspe.hhs.gov/basic-report/rates-and-timing-medicaid-enrollment-among-older-americans.
Spillman, Brenda, and Timothy Waidmann. 2015. “Beyond Spend-down: The Prevalence and Process of Transitions to Medicaid.” ASPE LTC Financing Colloquium. https://aspe.hhs.gov/report/beyond-spend-down-prevalence-and-process-transitions-medicaid.
Waidmann, Timothy, and Korbin Liu. 2006. “Asset Transfer and Nursing Home Use: Empirical Evidence and Policy Significance.” Washington, DC: Kaiser Commission on Medicaid and the Uninsured.
Wiener, Joshua M., Wayne Anderson, Galina Khatutsky, Yevgeniya Kaganova, Janet O’Keefe. 2013. “Medicaid Spend Down: New Estimates and Implications for Long-Term Services and Supports Financing Reform: Final Report.” Research Triangle Park, NC: RTI International.
NOTES
-
LTSS includes a range of services and supports individuals may need to meet their health or personal needs over an extended period of time. Most LTSS is not medical care, but rather assistance with the basic personal tasks of everyday life, such as bathing, dressing, toileting and eating, sometimes called “Activities of Daily Living” (or ADLs) (Katz, Ford, Moskowitz, Jackson and Jaffe 1963).
-
Lifetime earnings are measured by summing inflation-adjusted earnings over a worker’s entire career up to age 65. During years in which a worker is married, we incorporate the average of each spouse’s earnings into the measure.
Improving Health and Long-Term Care Modeling Capacity
This report was prepared under contract #HHSP233201600024I between HHS's ASPE/BHDAP and the Urban Institute. For additional information about this subject, you can visit the BHDAP home page at https://aspe.hhs.gov/bhdap or contact the ASPE Project Officers, at HHS/ASPE/BHDAP, Room 424E, H.H. Humphrey Building, 200 Independence Avenue, S.W., Washington, D.C., 20201; Judith.Dey@hhs.gov, Lauren.Anderson@hhs.gov, Helen.Lamont@hhs.gov.
Reports Available
Economic Hardship and Medicaid Enrollment in Later Life: Assessing the Impact of Disability, Health, and Marital Status Shocks
- HTML version: https://aspe.hhs.gov/basic-report/economic-hardship-and-medicaid-enrollment-later-life-assessing-impact-disability-health-and-marital-status-shocks
- PDF version: https://aspe.hhs.gov/pdf-report/economic-hardship-and-medicaid-enrollment-later-life-assessing-impact-disability-health-and-marital-status-shocks
Extended LTSS Utilization Makes Older Adults More Reliant on Medicaid Issue Brief
- HTML version: https://aspe.hhs.gov/basic-report/extended-ltss-utilization-makes-older-adults-more-reliant-medicaid-issue-brief
- PDF version: https://aspe.hhs.gov/pdf-report/extended-ltss-utilization-makes-older-adults-more-reliant-medicaid-issue-brief
Most Older Adults Are Likely to Need and Use Long-Term Services and Supports Issue Brief
- HTML version: https://aspe.hhs.gov/basic-report/most-older-adults-are-likely-need-and-use-long-term-services-and-supports-issue-brief
- PDF version: https://aspe.hhs.gov/pdf-report/most-older-adults-are-likely-need-and-use-long-term-services-and-supports-issue-brief
Risk of Economic Hardship Among Older Adults Issue Brief
- HTML version: https://aspe.hhs.gov/basic-report/risk-economic-hardship-among-older-adults-issue-brief
- PDF version: https://aspe.hhs.gov/pdf-report/risk-economic-hardship-among-older-adults-issue-brief
The Risk and Costs of Severe Cognitive Impairment at Older Ages: Literature Review and Projection Analyses
To be posted March 2021 at https://aspe.hhs.gov/bhdap.
Long-Term Services and Supports for Older Americans: Risks and Financing, 2020 Research Brief
To be posted March 2021 at https://aspe.hhs.gov/bhdap.
Projections of Risk of Needing Long-Term Services and Supports at Ages 65 and Older
To be posted March 2021 at https://aspe.hhs.gov/bhdap.
The Risk and Costs of Severe Cognitive Impairment at Older Ages: Key Findings from our Literature Review and Projection Analyses Research Brief
To be posted March 2021 at https://aspe.hhs.gov/bhdap.