
ADVANCE CARE PLANNING AMONG MEDICARE FEE-FOR-SERVICE BENEFICIARIES AND PRACTITIONERS: FINAL REPORT
Fang He, PhD, Angela Gasdaska, BS, Hannah Friedman, BA, Brendan Wedehas, BS, Alexis Kirk, PhD, Ila Broyles, PhD, and SaritaL. Karon, PhD
RTI International
September 2020
Printer Friendly Version in PDF Format (70 PDF pages)
ABSTRACT
Advance care planning (ACP) is planning that aligns the care an individual wants to receive if they become unable to speak for themselves with their values and goals. Prior research show that end-of-life wishes were more likely to be known and respected for people who received ACP. We used quantitative methods to examine the use of the ACP codes in Medicare fee-for-service and qualitative methods to supplement the results from this quantitative data analysis. We found low but increasing use of the ACP codes, with variation by practitioner type, beneficiary mortality, and place of service. Although barriers to ACP remain, we identified a wide variety of other interventions encouraging ACP.
This report was prepared under contract #HHSP233201600021I between HHS's ASPE/BHDAP and RTI International. For additional information about this subject, you can visit the BHDAP home page at https://aspe.hhs.gov/bhdap or contact the ASPE Project Officers, at HHS/ASPE/BHDAP, Room 424E, H.H. Humphrey Building, 200 Independence Avenue, S.W., Washington, D.C., 20201; William.Haltermann@hhs.gov, Iara.Oliveira@hhs.gov.
DISCLAIMER: The opinions and views expressed in this report are those of the authors. They do not reflect the views of the Department of Health and Human Services, the contractor or any other funding organization. This report was completed and submitted on September 2019.
TABLE OF CONTENTS
1. BACKGROUND
1.1. Introduction and Adoption of Advance Care Planning Codes
1.2. Introduction and Adoption of Billing Codes for Care Planning for Individuals with Cognitive Impairment
1.3. Research Objectives
2. METHODS
2.1. Quantitative Analysis
2.2. Qualitative Analysis
3. RESULTS
3.1. Advance Care Planning Codes
3.2. Advance Care Planning
4.1. Discussion
4.2. Conclusion
APPENDIX A. Additional Data Exhibits
LIST OF EXHIBITS
- EXHIBIT 1a: Percentage of Medicare FFS Beneficiaries with a Billed ACP Claim in 2016, by State
- EXHIBIT 1b: Percentage of Medicare FFS Beneficiaries with a Billed ACP Claim in 2017, by State
- EXHIBIT 1c: Percentage of Medicare FFS Beneficiaries with a Billed ACP Claim in 2018 Quarters 1-3, by State
- EXHIBIT 2: Characteristics of Practitioners With and Without Billed ACP Claims in 2017
- EXHIBIT 3: Demographic Characteristics of Medicare FFS Beneficiaries With and Without a Billed ACP Claim in 2017
- EXHIBIT 4: Characteristics of Medicare FFS Claims with ACP Codes in 2017
- EXHIBIT 5: Summary of Barriers to ACP and ACP Interventions
- EXHIBIT A-1a: Demographic Characteristics of FFS Beneficiaries without and without a Billed ACP Claim in 2016
- EXHIBIT A-1b: Demographic Characteristics of FFS Beneficiaries without and without a Billed ACP Claim in 2017
- EXHIBIT A-1c: Demographic Characteristics of FFS Beneficiaries without and without a Billed ACP Claim in 2018 Quarters 1-3
- EXHIBIT A-2: Top 20 Principal Diagnosis Codes during First 99497 Claim in 2016
- EXHIBIT A-3: Top 20 Principal Diagnosis Codes during First 99497 Claim in 2017
- EXHIBIT A-4: Top 20 Principal Diagnosis Codes during First 99497 Claim in 2018 Quarters 1-3
- EXHIBIT A-5: Top 20 Principal Diagnosis Codes during First 99498 Claim in 2016
- EXHIBIT A-6: Top 20 Principal Diagnosis Codes during First 99498 Claim in 2017
- EXHIBIT A-7: Top 20 Principal Diagnosis Codes during First 99498 Claim in 2018 Quarters 1-3
- EXHIBIT A-8: Top 20 Principal Diagnosis Codes during First 99483/G0505 Claim in 2017
- EXHIBIT A-9: Top 20 Principal Diagnosis Codes during First 99483/G0505 Claim in 2018 Quarters 1-3
- EXHIBIT A-10: Top 20 Principal Diagnosis Codes during the Year before the First ACP Claim in 2016
- EXHIBIT A-11: Top 20 Principal Diagnosis Codes during the Year before the First ACP Claim in 2017
- EXHIBIT A-12: Top 20 Principal Diagnosis Codes during the Year before the First ACP Claim in 2018 Quarters 1-3
- EXHIBIT A-13: Characteristics of ACP Claims
- EXHIBIT A-14a: Practitioner Characteristics: 2016
- EXHIBIT A-14b: Practitioner Characteristics: 2017
- EXHIBIT A-14c: Practitioner Characteristics: 2018 Quarters 1-3
- EXHIBIT A-15: Top Ten Practitioner Specialties Billing 99497 in 2016
- EXHIBIT A-16: Top Ten Practitioner Specialties Billing 99497 in 2017
- EXHIBIT A-17: Top Ten Practitioner Specialties Billing 99497 in 2018 Quarters 1-3
- EXHIBIT A-18: Top Ten Practitioner Specialties Billing 99498 in 2016
- EXHIBIT A-19: Top Ten Practitioner Specialties Billing 99498 in 2017
- EXHIBIT A-20: Top Ten Practitioner Specialties Billing 99498 in 2018 Quarters 1-3
- EXHIBIT A-21: Top Ten Practitioner Specialties Billing 99483/G0505 in 2017
- EXHIBIT A-22: Top Ten Practitioner Specialties Billing 99483/G0505 in 2018 Quarters 1-3
- EXHIBIT A-23: Top Ten Practitioner Specialties Not Billing ACP in 2016
- EXHIBIT A-24: Top Ten Practitioner Specialties Not Billing ACP in 2017
- EXHIBIT A-25: Top Ten Practitioner Specialties Not Billing ACP in 2018 Quarters 1-3
- EXHIBIT A-26a: Heat Map Indicating Percentage of Practitioners Billing ACP in 2016
- EXHIBIT A-26b: Heat Map Indicating Percentage of Practitioners Billing ACP in 2017
- EXHIBIT A-26c: Heat Map Indicating Percentage of Practitioners Billing ACP in 2018 Quarters 1-3
- EXHIBIT A-27: Search Terms
ACRONYMS
The following acronyms are mentioned in this report and/or appendix.
| ACP | Advance Care Planning |
|---|---|
| AD | Advance Directive |
| AHRF | Area Health Resources File |
| BCBS | Blue Cross Blue Shield |
| BETOS | Berrenson-Eggers Type Of Services |
| CMS | Centers for Medicare & Medicaid Services |
| CPT | Current Procedural Terminology |
| CY | Calendar Year |
| E&M | Evaluation and Management |
| ECHO | Extension for Community Healthcare Outcomes |
| EHR | Electronic Health Record |
| FFS | Fee-For-Service |
| HCPCS | Healthcare Common Procedure Coding System |
| ICD-9 | International Classification of Diseases, 9th revision |
| ICD-10 | International Classification of Diseases, 10th revision |
| IPPE | Initial Preventive Physical Examination |
| LDS | Limited Data Set |
| MAC | Medicare Administrative Contractors |
| NCD | National Coverage Determination |
| NPI | National Provider Identifier |
| NPPES | National Plan and Provider Enumeration System |
| RUC | Relative value scale Update Committee |
| SME | Subject Matter Expert |
| USPSTF | U.S. Preventive Services Task Force |
| VA | U.S. Department of Veterans Affairs |
EXECUTIVE SUMMARY
Background
People who have a serious illness or are nearing the end of life may be unable to make decisions regarding their medical treatment and care. In these circumstances, an individual's preferences regarding medical treatment and care are often not met. Advance care planning (ACP) is a process that may better align treatment and care with personal preferences, values, and goals.
In the context of Medicare payment, the Centers for Medicare & Medicaid Services (CMS) describes ACP as a voluntary "face-to-face service between a Medicare physician (or other qualified health care professional) and a patient to discuss the patient's health care wishes if they become unable to make decisions about their care" (CMS, 2019c). As part of this discussion, the practitioner may talk about advance directives (ADs) with or without completing relevant legal forms. An AD is a document that appoints an agent and/or records the person's wishes about their medical treatment based on personal values and preferences, to be used at a future time if the individual is unable to speak for themselves. Although ACP services can help patients and practitioners better align patients' care with their values and goals, many older adults in the United States have not participated in ACP (Yadav et al., 2017; Institute of Medicine, 2014).
In 2016, CMS adopted two billing codes (Current Procedural Terminology [CPT] codes 99497 and 99498) for paying practitioners for engaging in ACP with Medicare fee-for-service (FFS) beneficiaries. In 2017, CMS started to pay certain clinicians for providing care planning and cognitive assessment services to Medicare FFS beneficiaries, first using Healthcare Common Procedure Coding System code G0505 and then CPT code 99483. The Office of the Assistant Secretary for Planning and Evaluation engaged RTI International to study the use of these billing codes among Medicare FFS beneficiaries and practitioners.
Methods
This project used quantitative and qualitative methods to examine the use of the ACP codes (billing codes 99497, 99498, and 99483/G0505) in Medicare FFS. To conduct our quantitative data analysis, we used the 5% sample of Medicare's Limited Data Set (LDS) files. The LDS files used include beneficiary enrollment and Part B service claim data from 2015 through the third quarter of 2018 for a random sample of 5% of Medicare FFS beneficiaries. We compared the characteristics of Medicare FFS beneficiaries and practitioners with billed ACP claims to those without.
Our qualitative analysis included a literature review and interviews with subject matter experts (SMEs). For our literature review, we identified prior studies examining the use of the ACP codes. We also reviewed studies that identified barriers that may inhibit and interventions that may encourage the use of the ACP codes and ACP in general. For our SME interviews, we conducted semi-structured, key informant interviews with nine SMEs and CMS, who are knowledgeable about ACP and the ACP codes 99497, 99498, and 99483/G0505.
Results
Results from the Quantitative Data Analysis
Code Use. While only 2.81% of Medicare FFS beneficiaries had a billed 99497 in 2017, that percentage increased by almost 70%, from 1.67% in 2016. In 2017, only 0.07% of Medicare FFS beneficiaries had a billed 99498 (additional 30-minute increments of ACP after a billed 99497); 0.06% of beneficiaries had a billed 99483/G0505 (assessment and care planning for individuals with cognitive impairment). From 2016 through 2018 Quarter 3, of those beneficiaries with at least one billed ACP claim, the median beneficiary only had one billed ACP code. Of those with at least one claim billed for care planning for individuals with cognitive impairment during this almost three-year period, the beneficiary at the 75th percentile had one claim billed for assessment and care planning.
Practitioners. Internists and family medicine physicians were the highest proportion of practitioners with a billed 99497. However, nurse practitioners were most likely to provide ACP that lasts beyond 30 minutes (with a billed 99498). Neurologists and internists were the highest proportion of practitioners who billed for care planning for individuals with cognitive impairment.
Beneficiaries. Compared with beneficiaries without a billed ACP claim, those with a billed ACP claim were older, more likely to die within the calendar year (CY), and more likely to live in a county with higher socioeconomic status. In 2017, 48% of those with billed ACP lasting beyond 30 minutes died that year. Although beneficiaries with a billed claim for care planning for individuals with cognitive impairment were older than those without a billed claim, a similar percentage died within the CY.
Claims. In 2017, 63% of billed ACP services were conducted in an office and 13% in an inpatient hospital. In contrast, only 15% of billed ACP services lasting beyond 30 minutes were conducted in an office and 48% in an inpatient hospital. 89% of ACP services were billed in conjunction with another service, such as an office or outpatient visit for the evaluation and management of an established patient, and 46% were with an annual wellness visit. The vast majority (75%) of billed services for care planning for individuals with cognitive impairment were conducted in an office and only 36% were in conjunction with another service.
Results from the Qualitative Analysis
Results from our literature review and SME interviews were consistent with the patterns found in our data analysis. The low use of the ACP codes may be reflective of certain barriers, such as patient cost-sharing outside the annual wellness visit, practitioners' lack of awareness about the availability of the codes, and exclusion of certain clinical staff from independently billing these ACP codes. However, experts identified multiple interventions, including education and training, health system redesign, and ACP process changes, that may facilitate the use of these ACP codes and ACP in general. Payers other than Medicare also have adopted these ACP codes for payment.
Discussion and Conclusion
We found low but increasing use of the ACP codes. Our interviews and literature review revealed significant barriers to using the ACP codes for both practitioners and patients. Practitioners may not be aware of the ACP codes, may still lack the time to provide ACP services, or may not be comfortable providing ACP. Patients may lack a surrogate decision-maker or be uncomfortable talking about ACP. However, payers and providers have implemented a wide variety of interventions, including education and training for both practitioners and patients, to begin to address these barriers. More education and training may help further facilitate the use of these ACP codes.
1. BACKGROUND
People who have a serious illness or are nearing the end of life are often unable to make decisions regarding their medical treatment and care. In the Health and Retirement Study, 70% of participants who were age 60 and older at death and who faced treatment decisions in the final days of their lives were incapable of participating in these decisions (Silveira et al., 2010). In these circumstances, the individual's preferences are often not met. For example, despite documented preferences for home death, the majority of deaths from terminal illness occur in hospitals (Gruneir et al., 2007). Medical treatment and care may be better aligned with personal preferences through a process called advance care planning (ACP).
ACP does not have one standardized definition. Guidance from the Centers for Medicare & Medicaid Services (CMS) describes ACP as a voluntary "face-to-face service between a Medicare physician (or other qualified health care professional) and a patient to discuss the patient's health care wishes if they become unable to make decisions about their care" (CMS, 2019c). As part of this discussion, the provider may talk about advance directives (ADs) with or without completing relevant legal forms.[1] A recent consensus definition of ACP developed by an interdisciplinary Delphi panel describes ACP as "a process that supports adults at any age or stage of health in understanding and sharing their personal values, life goals, and preferences regarding future medical care" (Sudore et al., 2017).[2] Sudore et al. (2017) do not specifically mention documentation of a person's preferences, but define the goal of ACP as helping to "ensure that people receive medical care that is consistent with their values, goals and preferences during serious and chronic illness." The Institute of Medicine's definition for ACP also focuses on values, goals, and preferences (2014).[3] However, the Institute of Medicine's definition of ACP mentions documentation of those preferences through medical orders and advanced directives, and focuses on end-of-life care (2014).
Despite these different definitions of ACP, the process of ACP may help physicians and other qualified health care professionals, families, and caregivers meet an individual's needs and align their care with their values and goals.[4] Findings from a randomized controlled trial show that end-of-life wishes were more likely to be known and respected for people who received ACP (Detering et al., 2010). In addition, ACP resulted in higher satisfaction with the care provided for both patients and family members (Detering et al., 2010). Even with these potential benefits, many older adults in the United States have not participated in various aspects of the ACP process (Yadav et al., 2017; Institute of Medicine, 2014).
Before 2016, payment for ACP services was not separately identified in Medicare fee-for-service (FFS). ACP was a component of certain types of visits paid for by Medicare, but those were limited. For example, practitioners were required to provide voluntary end-of-life planning as a component of the Initial Preventive Physical Examination (IPPE), also known as the "Welcome to Medicare" preventive visit. However, Medicare only pays for an IPPE once during a beneficiary's lifetime (CMS, 2018). Some practitioners offered ACP because they viewed the process as an essential part of patient care, but believed they were insufficiently compensated for their time, making it financially difficult (Tuller, 2016; Sonenberg & Sepulveda-Pasci, 2018). In 2016, CMS adopted payment codes that allow for separate payment for ACP services under Medicare FFS.
1.1. Introduction and Adoption of Advance Care Planning Codes
In 2013, the Illinois State Medical Society submitted a proposal to the American Medical Association (AMA) for the ACP billing codes 99497 and 99498, which the AMA introduced in 2015 (Rodgers & Schellinger, 2018).
The AMA defines the ACP Current Procedural Terminology (CPT) codes 99497/99498 as follows:
Codes 99497/99498 are used to report ACP including the explanation and discussion of ADs such as standard forms (with completion of such forms, when performed), by the physician or other qualified health care professional; face-to-face with the patient, family member(s), and/or surrogate. 99497 covers the first 30 minutes and 99498 covers each additional 30 minutes. An AD is a document appointing an agent and/or recording the wishes of a patient pertaining to his/her medical treatment at a future time should he/she lack decisional capacity at that time. Examples of written ADs include, but are not limited to, health care proxy, durable power of attorney for health care, living will, and medical orders for life-sustaining treatment. (AMA, 2018)
With 99497, practitioners are paid about $86 in an office setting and about $80 in a facility; with 99498, they can be paid up to $76 (AMA, 2018; CMS, 2019a).[5]
In January 2016, CMS adopted these ACP codes for paying physicians and non-physician practitioners for engaging in ACP with Medicare FFS beneficiaries (CMS, 2015; CMS, 2019c). CMS outreach and educational materials provide guidance on the use of these ACP codes, including clarifying that ACP conversations have no time or use limit, so that a single ACP conversation can be as long as is needed, and ACP conversations can occur as many times per year as is needed (CMS, 2019c). In addition, there are no place-of-service limitations on ACP services, no specific diagnosis is required to bill codes 99497 and 99498, and Medicare does not limit ACP services to a particular physician specialty (CMS, 2019c). A Medicare physician (or other qualified health care professional) may conduct ACP conversations, and there are no requirements for completing an AD or Physician Orders for Life-Sustaining Treatment at any time to be covered (CMS, 2016b; Jones et al., 2016). Furthermore, if conversations are face-to-face, the conversation can be between a provider and a health care proxy or surrogate--the patient does not need to be included (CMS, 2015).
ACP can occur in different situations; an individual can schedule a visit specifically for ACP or may have it as part of an annual wellness visit. If ACP occurs outside of the annual wellness visit, Medicare beneficiaries must pay the deductible and coinsurance, although most beneficiaries have supplemental insurance such as Medigap or Medicaid to help cover the cost-sharing (CMS, 2019c). In 2017, CMS allowed for the provision of ACP services via telehealth (CMS, 2016a). One limitation is that the codes may not be used for payment concurrently with codes for critical care services (CMS, 2015).[6]
1.2. Introduction and Adoption of Billing Codes for Care Planning for Individuals with Cognitive Impairment
In 2017, CMS started to pay certain clinicians for providing care planning and cognitive assessment services to Medicare FFS beneficiaries using a temporary Healthcare Common Procedure Coding System (HCPCS) code G0505 (CMS, 2016a). Later in 2018, the AMA introduced CPT code 99483 for these services (AMA, 2018). Both codes have ten required elements that include developing, updating, or reviewing an advance care plan (AMA, 2018). The assessment and care planning element of the codes is defined as follows by the AMA:
99483/G0505: Assessment of and care planning for a patient with cognitive impairment, requiring an independent historian, in the office or other outpatient, home or domiciliary or rest home, with one of the required elements being the development, updating or revision, or review of an advance care plan. (AMA, 2018)[7]
With 99483, practitioners are paid about $263 in the office setting and $183 in a facility for a face-to-face meeting between the practitioner and the patient and/or caregiver (CMS, 2019a). Typically, 50 minutes are spent face-to-face with the patient and/or family or caregiver (AMA, 2018).
1.3. Research Objectives
Although there has been a recent increase in ACP research, there are still major knowledge gaps relating to ACP that need to be addressed (Jimenez et al., 2018). While recent studies have examined the use of these ACP codes, we aim to use both quantitative and qualitative methods to provide a more comprehensive understanding of the types of practitioners and beneficiaries who use the codes (Belanger et al., 2019; Pelland et al., 2019; Grant, 2018). Additionally, we aim to elucidate the factors that may inhibit the provision of ACP services and the interventions that have been implemented to encourage ACP. In particular, we examine the following research questions:
-
To what extent are practitioners providing ACP services to Medicare FFS beneficiaries? To what extent are practitioners aware of and encouraging the use of ACP services?
-
What are the characteristics--such as age, specialty, and practice type--of practitioners who are billing Medicare for providing ACP services to Medicare FFS beneficiaries?
-
What are the characteristics--such as age, gender, and Medicaid eligibility status--of Medicare FFS beneficiaries receiving ACP, and how often do they receive ACP?
-
Where do Medicare FFS beneficiaries receive ACP (e.g., office, inpatient hospital, outpatient hospital, nursing homes, etc.) and what other services (e.g., annual wellness visits) are being provided along with it?
-
What factors may inhibit (e.g., lack of awareness of the billing codes, lack of time, training, and comfort) or facilitate (e.g., ease of documenting ACP in electronic health records (EHR) or providing workshops on ACP) practitioners use of these ACP codes?
2. METHODS
2.1. Quantitative Analysis
2.1.1. Data Sources
Data for this study came from the 5% sample of Medicare's Limited Data Set (LDS) files. The LDS files include beneficiary enrollment and Medicare Part B claims data for a random 5% sample of Medicare FFS beneficiaries and should be representative of all Medicare FFS beneficiaries. The LDS enrollment data are from the 2015 Denominator File and the 2016-2018 Quarter 3 Master Beneficiary Summary File and include characteristics such as age, gender, race/ethnicity, Medicare FFS enrollment status, eligibility for Medicaid, date of death, and county of residence. The LDS Part B claims data are from the 2015-2018 Quarter 3 Carrier Standard Analytic Files, which are claims for services by physician and non-physician practitioners, and include dates of service, the performing practitioner's National Provider Identifier (NPI) and primary specialty, the diagnosis codes on the claim, place of service, HCPCS code, allowed charges, and Medicare payment amount. We did not examine Medicare Part A claims, which include those submitted for inpatient hospital services. We used the Agency for Healthcare Research and Quality Clinical Classification Software to classify ICD-9 and ICD-10 diagnosis codes into larger categories of diagnoses and the Berrenson-Eggers Type of Service (BETOS) codes to categorize the HCPCS codes. We supplemented the LDS with other data from the following sources:
-
April 2019 Medicare National Plan and Provider Enumeration System (NPPES) file: used to identify the practitioner's gender, whether they are a sole proprietor, and to restrict our sample of practitioners to individual practitioners. We used the practitioner's NPI to link the NPPES data with the claims.
-
September 2018 Medicare Physician Compare public use data file: used to identify characteristics such as a practitioner's hospital affiliation, the size of their practice, years since medical/professional school graduation, and their practice type. The Physician Compare data includes physician and non-physician practitioners and were linked to the claims using the practitioner's NPI.
-
2015-2016 Area Health Resources File (AHRF): used to identify county-level characteristics such as median household income from 2010-2014, the percent of adults 25 and over with at least four years of college from 2010-2014, and the number of primary care physicians per 10,000 Medicare FFS beneficiaries from 2014. The AHRF data was linked to the beneficiary enrollment data using the beneficiary's county of residence.
2.1.2. Study Population
The population for this study consists of: (1) Medicare FFS beneficiaries in the 5% LDS between January 2016 and September 2018; and (2) the practitioners who submitted Medicare claims for these beneficiaries. We examined the beneficiaries' Medicare claims, separately examining each population for 2016, 2017, the first three quarters of 2018 (January-September), and for this entire period. For our beneficiary-level analyses, we constructed the following samples:
-
Code use. To examine a beneficiary's code use throughout our study period from January 2016 to September 2018, we identified beneficiaries enrolled in Medicare FFS during this entire period or until the month of death. We limited our sample to beneficiaries continuously enrolled in Medicare FFS to ensure that we captured each beneficiary's complete claims history during this entire period.
-
Demographics. To compare demographic characteristics and the mortality rate of beneficiaries with and without a billed ACP claim, we identified beneficiaries enrolled in Medicare FFS during the entire year (2016, 2017, or the first three quarters of 2018) or until the month of death.
-
Health status. To examine a beneficiary's health status during the year prior to the billed ACP claim, we further required that beneficiaries be continuously enrolled in Medicare FFS during the previous year. For example, for our 2016 sample of Medicare FFS beneficiaries, we required Medicare FFS enrollment from 2015 through 2016 or until the month of death.
For our practitioner-level analysis, we include all individual practitioners who billed at least one claim for services provided to a Medicare FFS beneficiary in the 5% sample in 2016, 2017, or the first three quarters of 2018. We divide practitioners into those who billed an ACP code during the year and those who did not. For our claim-level analysis, we include all claims with an ACP code that were accepted by Medicare for a beneficiary with Medicare FFS enrollment during the year.
2.1.3. Statistical Analysis
We used descriptive analyses to compare the characteristics of beneficiaries and practitioners with ACP to those without. We also examined the characteristics of claims with an ACP code. We used a t-test to identify whether differences were statistically significant.
2.2. Qualitative Analysis
2.2.1. Literature Review
Appendix Exhibit A-27 shows the organizations, agencies, and publications searched, as well as the search terms used. We first constructed search strings for each of the databases. We then reviewed the results for relevancy to our research questions and excluded articles about ACP outside of the United States, not in English, or about ACP without reference to the ACP codes. We scanned the remaining abstracts for relevancy to our research questions. After the initial review, we used snowballing to identify relevant articles cited in the current literature.
2.2.2. Subject Matter Expert Interviews
To supplement our literature review and data analysis with current information and insights, we conducted semi-structured, key informant interviews with nine subject matter experts (SMEs). SMEs included physicians (from both inpatient and outpatient settings), an executive at a large physician organization, academic researchers, a RUC advisor to the AMA, an executive at a commercial insurance company, an executive at an organization that implements ACP interventions, and executives at an organization focusing on Alzheimer's disease and dementia care. We also interviewed directors and analysts at CMS. These interviews occurred between May and July 2019, and each lasted about 60 minutes.
3. RESULTS
In this section, we first focus on findings regarding the ACP codes specifically and then present findings regarding ACP in general.
3.1. Advance Care Planning Codes
3.1.1. Results from the Data Analysis
In this section, we highlight results from our analysis of data from 2017, the most recent year of complete data at the time of our analysis. However, Appendix A also includes results for 2016 and the first three quarters of 2018.
Use of the ACP Codes
In the initial years of Medicare paying practitioners for ACP services, we found low but increasing use of these ACP codes in Medicare FFS. While only 2.81% of Medicare FFS beneficiaries had a billed 99497 in 2017, that percentage increased by almost 70% from 1.67% in 2016. In 2017, only 0.07% of Medicare FFS beneficiaries had a billed 99498 (additional 30-minute increments of ACP after a billed 99497); 0.06% of beneficiaries had a billed 99483/G0505 (assessment and care planning for cognitively impairment individuals). Appendix Exhibit A-1a to Exhibit A-1c provide more details on the use of the ACP codes.
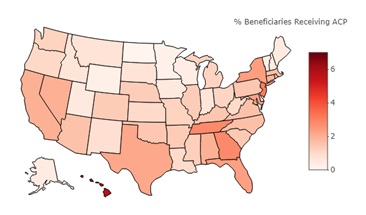
| EXHIBIT 1a. Percentage of Medicare FFS Beneficiaries with a Billed ACP Claim in 2016, by State | ||
|---|---|---|
 | Highest Percentage States | |
| State | Percentage of FFS Beneficiaries with Billed ACP Claim | |
| Hawaii | 5.72 | |
| New Jersey | 3.09 | |
| Georgia | 2.83 | |
| Tennessee | 2.80 | |
| New York | 2.37 | |
| Lowest Percentage States | ||
| State | Percentage of FFS Beneficiaries with Billed ACP Claim | |
| North Dakota | 0.05 | |
| Wisconsin | 0.17 | |
| Vermont | 0.27 | |
| Minnesota | 0.27 | |
| Wyoming | 0.36 | |
| SOURCE: RTI International analysis of Medicare Part B claims and enrollment data for the 5% random sample of Medicare FFS beneficiaries. Notes: We restricted each year's sample to beneficiaries continuously enrolled in Medicare FFS throughout the year or until the month of death. To define a billed ACP claim, we included billing codes 99497 for the first 30 minutes of ACP, 99498 for each additional 30 minutes of ACP, and 99483/G0505 for cognitive assessment and ACP for individuals with cognitive impairment. | ||
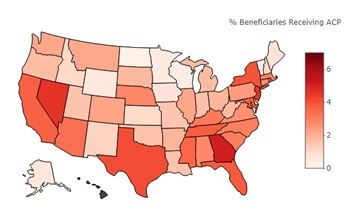
| EXHIBIT 1b. Percentage of Medicare FFS Beneficiaries with a Billed ACP Claim in 2017, by State | ||
|---|---|---|
 | Highest Percentage States | |
| State | Percentage of FFS Beneficiaries with Billed ACP Claim | |
| Hawaii | 7.77 | |
| Georgia | 5.10 | |
| Nevada | 4.65 | |
| New Jersey | 4.54 | |
| Texas | 4.10 | |
| Lowest Percentage States | ||
| State | Percentage of FFS Beneficiaries with Billed ACP Claim | |
| North Dakota | 0.22 | |
| Wisconsin | 0.39 | |
| Vermont | 0.44 | |
| Minnesota | 0.47 | |
| Wyoming | 0.59 | |
| SOURCE: RTI International analysis of Medicare Part B claims and enrollment data for the 5% random sample of Medicare FFS beneficiaries. Notes: We restricted each year's sample to beneficiaries continuously enrolled in Medicare FFS throughout the year or until the month of death. To define a billed ACP claim, we included billing codes 99497 for the first 30 minutes of ACP, 99498 for each additional 30 minutes of ACP, and 99483/G0505 for cognitive assessment and ACP for individuals with cognitive impairment. | ||
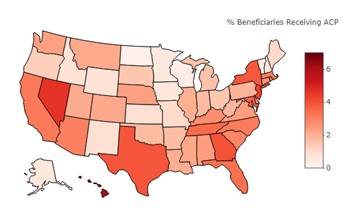
| EXHIBIT 1c. Percentage of Medicare FFS Beneficiaries with a Billed ACP Claim in 2018 Quarters 1-3, by State | ||
|---|---|---|
 | Highest Percentage States | |
| State | Percentage of FFS Beneficiaries with Billed ACP Claim | |
| Hawaii | 5.96 | |
| Nevada | 4.64 | |
| New Jersey | 4.31 | |
| Georgia | 4.00 | |
| Texas | 3.93 | |
| Lowest Percentage States | ||
| State | Percentage of FFS Beneficiaries with Billed ACP Claim | |
| North Dakota | 0.21 | |
| Wisconsin | 0.36 | |
| Vermont | 0.45 | |
| Minnesota | 0.49 | |
| Alaska | 0.58 | |
| SOURCE: RTI International analysis of Medicare Part B claims and enrollment data for the 5% random sample of Medicare FFS beneficiaries. Notes: We restricted each year's sample to beneficiaries continuously enrolled in Medicare FFS throughout the year or until the month of death. To define a billed ACP claim, we included billing codes 99497 for the first 30 minutes of ACP, 99498 for each additional 30 minutes of ACP, and 99483/G0505 for cognitive assessment and ACP for individuals with cognitive impairment. | ||
Although overall use of ACP codes is low, we found variation across the country. Exhibits 1a to Exhibit 1c shows the percent of Medicare FFS beneficiaries with a billed ACP claim in 2016, 2017, and the first three quarters of 2018 by state. In 2017, the percent of beneficiaries with a billed ACP claim ranges from 0.22% in North Dakota to 7.77% in Hawaii. Beneficiaries living in the South, Northeast, and West were more likely to receive ACP than those living in the Midwest.
Characteristics of Practitioners Billing Medicare for Administering ACP Services
Exhibit 2 shows the characteristics of practitioners with and without a billed ACP claim in 2017. In 2017, primary care practitioners made up 92% of those who billed 99497, but only 36% of those who did not bill for ACP. Primary care practitioners also made up 83% of those who billed 99498 (additional 30-minute increments of ACP after a billed 99497) and 73% of those who billed 99483/G0505 (assessment and care planning for cognitively impairment individuals). Examining practitioner specialty in more detail, Appendix Exhibit A-15 to Exhibit A-20 show that from 2016 to quarter three of 2018, internal medicine was the top specialty billing 99497, while nurse practitioners billed 99498 the most. This finding is consistent with practitioners who billed 99498 being more likely to be a non-physician practitioner and having fewer years since medical/professional school graduation than practitioners who billed 99497.
Appendix Exhibit A-16 shows that, in 2017, practitioners who billed 99497 only represented 19% of all hospice and palliative care physicians, 5% of all internal medicine physicians, and 2% of all nurse practitioners. The low use among hospice and palliative care physicians is consistent with a prior study (Belanger et al., 2019). Appendix Exhibit A-21 and Exhibit A-22 show that the top specialties that billed 99483/G0505 in 2017 and 2018 were internists and neurologists. Appendix Exhibit A-14a to Exhibit A-14c show our complete results on the characteristics of practitioners.
| EXHIBIT 2. Characteristics of Practitioners with and without a Billed ACP Claim in 2017 | |||||||
|---|---|---|---|---|---|---|---|
| Characteristics | No ACP Billed | 994971 Billed | Difference Between No ACP and 99497 Billed | 994981 Billed | Difference Between No ACP and 99498 Billed | 99483/ G05051 Billed | Difference Between No ACP and 99483 Billed |
| Percent providing service | 98.67 | 1.30 | --- | 0.07 | --- | 0.04 | --- |
| Male, % | 56 | 53 | -4*** | 36 | -20*** | 57 | 1 |
| Primary care practitioner, % | 36 | 92 | 55*** | 83 | 47*** | 73 | 37*** |
| Palliative care practitioner, % | 0.1 | 1 | 1*** | 7 | 7*** | 0.1 | 0 |
| Other practitioner, % | 64 | 7 | -57*** | 10 | -54*** | 26 | -37*** |
| Physician, % | 60 | 77 | 17*** | 58 | -2 | 84 | 24*** |
| Non-Physician, % | 40 | 23 | -17*** | 42 | 2 | 16 | -24*** |
| Characteristics from Medicare's Physician Compare database | |||||||
| Practice size, average | 372 | 203 | -170*** | 394 | 22 | 191 | -181*** |
| Years since medical/professional school graduation | 20.60 | 21.29 | 0.69*** | 16.72 | -3.87*** | 23.92 | 3.33*** |
| SOURCE: RTI International analysis of Medicare part B claims and enrollment data for the 5% random sample of Medicare FFS beneficiaries. NOTES: *** p 0.001. We restricted the sample to practitioners with individual National Provider Identifiers who submitted Medicare claims for the 5% random sample of Medicare FFS beneficiaries. Examples of "other practitioners" include cardiologists, general surgeons, and radiologists.
| |||||||
Characteristics of Medicare FFS Beneficiaries with a Billed ACP Claim
From 2016 through 2018 Quarter 3, 5.66% of Medicare beneficiaries continuously enrolled in FFS during this period had a billed 99497, 0.17% had a billed 99498 (additional 30-minute increment of ACP after a billed 99497), and 0.10% had a billed 99483/G0505 (assessment and care planning for cognitively impairment individuals). Beneficiaries with a billed ACP claim were, on average, older, sicker, and had higher mortality rates than those who did not. Exhibit 3 shows that, in 2017, the average age of beneficiaries without a billed ACP claim was 71, while beneficiaries with a billed 99497 were, on average, almost four years older. Beneficiaries with a billed 99498 and 99483/G0505 were older still.
Four percent of beneficiaries without a billed ACP claim died during 2017, while 11% and 48% of those with a billed 99497 and 99498 died, respectively. Of those who received 99497 and died, the number of days between the first billed 99497 of 2017 and death ranged from zero to 358 days with a mean of 61 days. The number of days between the first billed 99498 and death ranged from zero to 324 days with a mean of 32 days. However, despite being older, beneficiaries with a billed 99483/G0505 did not die at a higher rate than those without a billed ACP claim. Of the 4% of beneficiaries who had a billed 99483/G0505 and died, the number of days between the first billed 99483/G0505 and death ranged from nine to 289 days with a mean of 120 days.
Consistent with these patterns on age and mortality, Appendix Exhibit A-10 to Exhibit A-12 show that beneficiaries with billed ACP claims had more diagnoses during the year prior to the ACP claim. Appendix Exhibit A-5 to Exhibit A-7 show that an encounter for palliative care was the most common principal diagnosis for beneficiaries on their first claim with ACP code 99498. This is consistent with the high percentage of beneficiaries with a billed 99498 that died during the same year and the small mean number of days between when 99498 was billed and when the beneficiary died. Appendix Exhibit A-8 and Exhibit A-9 also show that, as expected, the most common principal diagnoses for beneficiaries on their first claim of the year with 99483/G0505 were related to cognitive impairment and dementia.
We also examined the number of ACP codes billed for beneficiaries with continuous Medicare FFS coverage from 2016 through 2018 Quarter 3. During this almost three-year period, of those beneficiaries with any billed 99497/99498, the median beneficiary had one billed 99497/99498, the beneficiary at the 75th percentile had two billed 99497/99498, and the beneficiary at the 99th percentile had four. Of those with any billed 99483/G0505, the beneficiary at the 75th percentile had one billed 99483/G0505 during this almost three-year period and the beneficiary at the 99th percentile had three.
Exhibit 3 also shows that beneficiaries with a billed ACP claim tended to live in counties with higher median household income, higher percentage of college graduates, and more primary care physicians. Appendix Exhibit A-1a to Exhibit A-1c show our complete results on the characteristics of beneficiaries.
| EXHIBIT 3. Demographic Characteristics of Medicare FFS Beneficiaries with and without a Billed ACP Claim in 2017 | |||||||
|---|---|---|---|---|---|---|---|
| Characteristics | No ACP Billed | 994971 Billed | Difference Between No ACP and 99497 Billed | 994981 Billed | Difference Between No ACP and 99498 Billed | 99483/ G05051 Billed | Difference Between No ACP and 99483 Billed |
| Beneficiaries with billed ACP, % | 97.14 | 2.81 | --- | 0.07 | --- | 0.06 | --- |
| Age, mean | 70.96 | 74.89 | 3.93*** | 77.92 | 6.96*** | 77.56 | 6.60*** |
| Male, % | 45 | 42 | -4*** | 45 | 0 | 41 | -4*** |
| White, % | 83 | 83 | 0 | 76 | -7*** | 84 | 1 |
| Black, % | 9 | 9 | 0 | 14 | 4*** | 10 | 1 |
| Other race, % | 2 | 2 | 0*** | 2 | 0 | 1 | -1 |
| Beneficiaries eligible for both Medicare and full Medicaid benefits, % | 14 | 14 | 0 | 30 | 16*** | 15 | 1 |
| Beneficiaries eligible for both Medicare and partial Medicaid benefits, % | 5 | 4 | -1*** | 4 | -1 | 4 | -1 |
| Beneficiary died during the calendar year, % | 4 | 11 | 7*** | 48 | 44*** | 4 | 0 |
| Days until death after ACP claim, mean | --- | 61 | --- | 32 | --- | 120 | --- |
| Household income of county, median | $54,217 | $55,423 | $1,206*** | $57,723 | $3,506*** | $55,538 | $1,321** |
| 25+ year old with 4+ years of college (2010-2014), % | 27.83 | 28.35 | 0.52*** | 30.83 | 2.99*** | 28.80 | 0.97** |
| Primary care physicians per 10,000 Medicare FFS beneficiaries (2014) | 64.01 | 65.00 | 0.99*** | 75.99 | 11.98*** | 67.89 | 3.89** |
| SOURCE: RTI International analysis of Medicare Part B claims and enrollment data for the 5% random sample of Medicare FFS beneficiaries. NOTES: ** p 0.01; *** p 0.001. We restricted each year's sample to beneficiaries continuously enrolled in Medicare FFS throughout the year or until the month of death.
| |||||||
Characteristics of Billed ACP Claims
Exhibit 4 shows additional results from our claim-level analysis. We found that the majority of 99497 (63.3%) and 99483/G0505 (assessment and care planning for cognitively impairment individuals) (75.2%) claims took place in an office, while 47.7% of 99498 claims (additional 30-minute increments of ACP after a billed 99497) took place in an inpatient hospital. Most 99497 claims included other services (89.4%) and roughly half were part of an annual wellness visit.
In contrast, 36.2% of 99483/G0505 included other services. Appendix Exhibit A-13 shows that the percent of 99483/G0505 claims including other services declined to 13% in the first three quarters of 2018. In addition, despite CMS prohibiting practitioners from billing 99483/G0505 in conjunction with similar evaluation and management (E&M) services, 24.4% of claims with 99483/G0505 included other E&M services in 2017.[8] However, only 4.6% claims with 99483/G0505 included other E&M services in the first three quarters of 2018. We did not examine the percentage of 99483/G0505 claims that were billed with an annual wellness visit, since Medicare does not waive patient cost-sharing for 99483/G0505 when billed with an annual wellness visit.
Appendix Exhibit A-13 shows our complete results on the characteristics of ACP claims. In 2017, Medicare paid practitioners around $3.3 million for 99497 claims for Medicare FFS beneficiaries in the 5% LDS sample. This represents around 82% of the over $4 million practitioners were allowed to charge for these services. The remaining 18% were paid by beneficiaries or supplemental insurance.
| EXHIBIT 4. Characteristics of Medicare FFS Claims with ACP Codes in 2017 | |||
|---|---|---|---|
| Characteristic | Claims with 994971 (%) | Claims with 994981 (%) | Claims with 99483/G05051 (%) |
| Place of service | |||
| Office | 31,918 (63.3%) | 205 (14.8%) | 741 (75.2%) |
| Inpatient hospital | 6,771 (13.4%) | 662 (47.7%) | 22 (2.2%) |
| Skilled nursing facility | 3,916 (7.8%) | 178 (12.8%) | 30 (3.0%) |
| Other | 7,782 (15.4%) | 344 (24.8%) | 193 (19.6%) |
| Other services included on ACP claim | |||
| With any other service | 45,052 (89.4%) | 867 (62.4%) | 357 (36.2%) |
| With evaluation and management service2 | 44,024 (87.4%) | 854 (61.5%) | 241 (24.4%) |
| Annual wellness visit | 23,090 (45.8%) | 72 (5.2%) | --- |
| Payments and charges of ACP service and claim | |||
| Allowed charges (standard deviation) | $79 ($7.6) | $74 ($19.3) | $221 ($35.3) |
| Total amount Medicare paid to practitioners for the ACP service during calendar year | $3,315,770 | $81,903 | $165,632 |
| Total allowed charges during calendar year | $4,043,707 | $104,806 | $218,173 |
| SOURCE: RTI International analysis of Medicare Part B claims and enrollment data for the 5% random sample of Medicare FFS beneficiaries. NOTES: We restricted each year's sample to claims for beneficiaries continuously enrolled in Medicare FFS throughout the year or until the month of death.
| |||
3.1.2. Advance Care Planning Code Use: Results from the Literature Review and Subject Matter Expert Interviews
The findings of our data analysis are consistent with other studies and our SME interviews. Other studies have shown that uptake of 99497/99498 has been low, but has increased over time (Grant, 2018; Belanger et al., 2019). One study found that the number of Medicare beneficiaries with a billed ACP claim increased 70% from 2016 to 2017, but the percentage of Medicare beneficiaries with a billed claim was still only around 2% in 2017 (Grant, 2018). Despite the generally low uptake, some organizations and providers have been aggressive in billing these codes. For example, over the past couple of years, an executive at a large physician organization stated that they successfully implemented initiatives that increased the percentage of patients 65 and older for whom they use the ACP codes from 2% to 20%.
In addition, our literature review and SME interviews showed similar patterns regarding characteristics of practitioners billing ACP, beneficiaries with a billed ACP claim, and ACP claims within Medicare. For example, past studies and our SMEs noted that physicians in internal medicine and family medicine were billing 99497 the most (Belanger et al., 2019; Pelland et al., 2019). Furthermore, beneficiaries with a billed ACP claim were older and sicker, and they often had ACP during an annual wellness visit and in an office (Pelland et al., 2019; Barnato et al., 2019; Belanger et al., 2019).
Results from another study of the codes 99483/G0505 (assessment and care planning for cognitively impairment individuals) were consistent with our data analysis (Health Care Cost Institute, 2019). Both that analysis and our analysis show that, in the Medicare FFS population, uptake of these codes is very low, but has increased over time (0.06% of beneficiaries had this service in 2017, although use increased steadily throughout 2017). Physicians in neurology, internal medicine, and family practice were billing these codes the most. Additionally, uptake of the these codes in the Medicare Advantage population was slightly lower than in the Medicare FFS population; the specialties of practitioners using these codes the most in Medicare Advantage were very similar to Medicare FFS.
3.1.3. Adoption of Advance Care Planning Codes by Payers Outside of Medicare
Payers outside of Medicare FFS also adopted the ACP codes for paying practitioners. State Medicaid programs in Oregon, Colorado, and California and some private insurers, like Massachusetts Blue Cross Blue Shield (BCBS), Rhode Island BCBS, Aetna, and Cigna, pay for ACP, although some payers have stricter or broader requirements than Medicare FFS (Ollove, 2014; Coalition for Compassionate Care of California, 2017; Massachusetts BCBS, 2016; McCarthy et al., 2018; American Academy of Family Physicians, 2019). Some payers, like Aetna and Cigna, only pay for patients with short life expectancies, and Colorado Medicaid only pays for the first 30 minutes of an ACP service (McCarthy et al., 2018; American Academy of Family Physicians, 2019; Ollove, 2014). On the other end of the spectrum, Massachusetts BCBS not only allows physicians and non-physician practitioners to bill 99497/99498, but also allows licensed drug and alcohol, marriage, and mental health counselors, licensed social workers, and clinical psychologists to bill these codes (Massachusetts BCBS, 2016).
Executives at an organization focusing on Alzheimer's disease and dementia care said they did not expect the code 99483/G0505 (assessment and care planning for cognitively impairment individuals) to be used broadly outside of Medicare and Medicare Advantage plans. According to a dementia expert, the overwhelming majority of individuals with cognitive impairment are expected to have Medicare, either because they are 65 and older or due to disability from their cognitive impairment.
3.1.4. Barriers to Using the Advance Care Planning Codes
We found only one study that examined barriers to billing the ACP codes 99497/99498 (Tsai & Taylor, 2017). Due to the scarcity of studies in this area, our SME interviews focused on identifying barriers to billing the ACP codes 99497/99498.
-
Patient cost-sharing. The most commonly cited barrier was patient cost-sharing. If the ACP codes are not used in the same claim as an annual wellness visit, individuals without supplemental insurance can be charged 20% of the cost of the service (around $16 for 99497, and another $15 if 99498 is also billed). Multiple experts noted that patients complained to practitioners upon receipt of an extra bill they were not expecting, and this discouraged practitioners from using the codes. Several commenters in the calendar year (CY) 2016 Physician Fee Schedule Final Rule suggested waiving cost-sharing (CMS, 2015). CMS responded that they lack statutory authority to waive cost-sharing for ACP services because they are not preventive services according to the U.S. Preventive Services Task Force (USPSTF).[9] CMS also recommended that practitioners inform beneficiaries that the ACP service is subject to cost-sharing when it is not provided as part of the annual wellness visit (CMS, 2015).
-
Lack of awareness. The second most commonly cited barrier by SMEs was lack of awareness of the ACP codes. Many practitioners are simply unaware that billing codes for ACP exist under Medicare or other private insurers.
-
Perceived relatively low payment rates. Multiple SMEs also mentioned low payment as a potential barrier for these ACP codes. One expert stated that "there is some question as to whether the [payment] is too low...at 16 minutes, the $86-$103 [payment rate] isn't bad, but at 45 minutes that isn't very good at all." This perception may discourage practitioners from billing the codes in lieu of other codes they are accustomed to billing, such as the outpatient E&M codes that have been in place since 1995 and are used for a majority of outpatient office visits. The E&M code 99214, which SMEs stated as a possible substitute for the ACP code 99497, is valued at about $110 in the office setting (CMS, 2019a). However, the duration of the 99214 service also may vary depending on the service components (i.e., history, examination, or medical decision-making) performed in addition to ACP.
-
Scope of practice. The CPT codes 99497/99498 are E&M services, which are not considered within the scope of practice or Medicare statutory benefit category of social workers, chaplains and other individuals. Such individuals may not be authorized to independently report these codes (CMS, 2015). Multiple experts mentioned that it is important for other related professionals, such as social workers, to be able to independently bill for ACP. One expert stated:
"We've shown in our research that the conversation can very appropriately be done by non-physicians, by non-[advanced practice clinicians] even--they require appropriate training and certification, but that model has been successfully done with chaplains, nurses, [and] social workers. But the ability to charge codes for when those non-providers provide the service [independently] is a real barrier."
Commenters to the CY 2016 Physician Fee Schedule Proposed Rule also noted this as a potential barrier. In response, CMS acknowledged their concern and noted that only practitioners whose scope of practice and Medicare benefit category include the services described by the CPT codes could independently report those codes (CMS, 2015).
-
Health system barriers. Some health systems may need a significant amount of time (one expert cited 8-9 months) to include new codes in their charge master, which is a requirement for practitioners to bill. Also, if some payers choose not to pay practitioners for these codes, a health system may not be able to introduce the codes for billing due to compliance issues.
-
Requirements to bill. Some SMEs mentioned that the codes were not descriptive enough or did not offer a standard definition of ACP. If practitioners are unsure of what constitutes ACP, they may be discouraged from using the codes. In addition, there is some concern that the amount of time a practitioner needs to engage in ACP in order to bill these codes is too great. Furthermore, some practitioners may be unfamiliar with time-based codes and it may be unclear to them whether or not this service can be billed after 15 minutes (the mid-point of the time interval).
-
Lack of National Coverage Determination (NCD). Currently, the ACP codes are priced nationally, using the physician fee schedule, with no NCD. An NCD requires that the billing code be administered in the same way across the country, and according to the CY 2016 Physician Fee Schedule Final Rule, CMS did not issue an NCD because it would be "advantageous to allow time for implementation and experience of ACP services, including identification of any variations in utilization, prior to considering a controlling national coverage policy through the NCD process" (CMS, 2015). In the absence of an NCD, Medicare Administrative Contractors (MACs), who process Medicare Parts A and B claims for Medicare FFS beneficiaries within a geographic area, can determine if the ACP service is reasonable and medically necessary. Despite CMS documentation on requirement for coverage, coding, and payment, according to a SME, the lack of an NCD allows MACs to have too much discretion in determining the documentation required and the frequency that the ACP codes can be billed. This may cause differences in documentation requirements across MACs, possibly discouraging the use of these codes in regions where the MACs' requirements are perceived to be more rigorous.
According to executives at an organization focusing on Alzheimer's disease and dementia care, because 99483 and G0505 (assessment and care planning for cognitively impairment individuals) have only been in use since 2017, the low use was primarily attributed to lack of awareness.
3.1.5. Interventions to Facilitate the Use of the Advance Care Planning Codes
National and local organizations, associations, and agencies, as well as CMS, have provided educational materials to the public or to their members to raise awareness about the codes, encourage their use, and give instructions on how to use them, especially for Medicare beneficiaries. The AMA publishes a CPT manual with instructions and definitions for each CPT code (AMA, 2018). Other organizations have also released their own instructional documents for use of the codes for Medicare beneficiaries, and guidance for using these codes appeared frequently in the literature (American Hospital Association, 2018; American Geriatric Society, 2016; American College of Emergency Physicians, 2017; American College of Physicians, 2015; Respecting Choices, 2018). Furthermore, multiple SMEs indicated that information on ACP codes 99497 and 99498 was included in their educational outreach materials about ACP in general. In addition, CMS published information on these codes in a fact sheet through the Medicare Learning Network, physician fee schedule rules, and the 2019 Medicare and You booklet for beneficiaries (CMS, 2019c; CMS, 2015; CMS, 2016a; CMS, 2017; CMS, 2019d).
Incentives have been used to facilitate the use of ACP services. In our SME interviews, an executive from a large physician organization mentioned that they give a $20 incentive to practitioners for each ACP service provided that is billed using ACP codes 99497 and 99498, and that they hold their physician leadership accountable for meeting minimum levels of ACP code use for high-risk patients. The executive indicated that their incentive structure has been effective; the percentage of patients 65 and older with a billed ACP claim has increased from 2% to 20%.
Although most literature pertains to the two codes 99497 and 99498, some organizations, like the Alzheimer's Association, have published extensively to facilitate the use of 99483/G0505 (assessment and care planning for cognitively impairment individuals). Literature about 99483/G0505 includes a toolkit providing background on the codes, the required elements to bill the codes, measurement tools for cognitive and functional assessments, and restrictions on the use of the codes (can bill once every 180 days) (Alzheimer's Association, 2017a, 2017b, 2018; Moore & Hays, 2017).
3.2. Advance Care Planning
3.2.1. Barriers to Advance Care Planning
Almost all the literature and our SME interviews agreed that significant barriers to ACP for both practitioners and patients still exist, and that the ACP codes, while critically important, should be viewed as only one of multiple interventions to facilitate the provision of ACP services.
Barriers for Practitioners
The barriers to ACP for practitioners cited in the literature were similar to those cited by our SMEs.
-
Lack of time. Although the codes offer an opportunity for practitioners to be paid for their time conducting ACP, time is still a precious commodity. Practitioners are often rushed during annual wellness visits and lack the time necessary for a comprehensive discussion about a patient's wishes for care if they became unable to speak for themselves (Solis et al., 2018; Tsai & Taylor, 2017; Dillon et al., 2017; Liantonio et al., 2017).
-
Lack of comfort. If there is time for a discussion, practitioners often feel pressured to simply outline the AD form, or paperwork to designate durable power of attorney or health care proxies (Tuller, 2016). This tendency toward more superficial (although still important) discussions can stem from practitioner discomfort with the topic (Solis et al., 2018; Tsai & Taylor, 2017; Dingfield et al., 2017; Hammes et al., 2019). Physicians in specialties less familiar with the process, such as emergency medicine physicians, may be less experienced and less comfortable with the topic (Ouchi et al., 2019). Physicians serving racially and ethnically diverse patient populations, or who were racially or ethnically diverse themselves, were more likely to cite discomfort as a barrier (Fulmer et al., 2018). Also, during ACP, individuals may reveal preferences for less life-prolonging treatment, which can feel at odds with a practitioner's training and identity.
-
Lack of training. Many clinical practitioners, particularly physicians, report that they have had little or no training in ACP, and many feel as if they are not adequately prepared for these conversations (Hammes et al., 2019; Solis et al., 2018; Tsai & Taylor, 2017; Fanta & Tyler, 2017).
-
Documentation. The literature and SMEs made it clear that, although some EHR systems are equipped to easily record notes from ACP conversations, many are not, and there can be confusion about documentation requirements (Dillon et al., 2017; Tsai & Taylor, 2017). Even when ACP documents are completed, practitioners may not have access to them when needed, such as in an emergency. Specifically, there may be challenges to EHR interoperability, such as when a practitioner in one health system cannot access ACP documents recorded in another system's EHR (Fanta & Tyler, 2017; Government Accountability Office, 2019).
-
Lack of coordination. If multiple practitioners are treating a single patient--which is often the case for complex patients with advanced disease trajectories--there can be confusion about which practitioner should "quarterback" the ACP process (Dillon et al., 2017). This confusion is often compounded by a lack of familiarity with the subject, particularly with specialists or emergency department physicians, who often don't even have relevant materials such as literature or paperwork available. (Dillon et al., 2017; Ouchi et al., 2019). A lack of coordinated care models can also lead to confusion about which practitioners (physicians or other clinicians) are responsible for ACP conversations (Sonenberg & Sepulveda-Pasci, 2018).
-
Lack of a clear definition of ACP. Throughout the literature, different studies define ACP differently. ACP is even known by other names, such as "goals of care conversations." In addition, there has not been a clear consensus definition of ACP until recently (Sudore et al., 2017). However, many studies published after this definition had yet to adopt this definition (Belanger et al., 2019; Hare & Jerome-D'Emilia, 2019; Sonenberg & Sepulveda-Pasci, 2018). Multiple SMEs cited the lack of a standardized or clear definition of ACP as a barrier because it leads to confusion among practitioners.
-
Other barriers. SMEs also indicated other barriers, including a FFS compensation structure that favors billing as many services as possible and does not incentivize practitioners to provide potentially time-intensive, value-based activities like ACP. According to a SME, "If your salary is based around seeing as many patients as quickly as you can, ACP is not part of that." In addition, SMEs mentioned initiative fatigue, where providers cannot keep up with the series of new initiatives, as a barrier.
According to executives at the organization focusing on Alzheimer's disease and dementia care, an important barrier to care planning for people with cognitive impairment is that practitioners may not diagnose Alzheimer's disease or related dementias, or may not disclose a diagnosis, because they do not have any treatment to offer the patient. In addition, even if they do diagnose, practitioners often lack the training to provide care planning services. Finally, other barriers include greater effort to coordinate with patients' surrogate decision-makers, higher uncertainty in prognosis, frequent transitions in care, and the high number of clinicians involved (Thomas et al., 2018).
Barriers for Patients
Obstacles to patient participation in ACP are just as critical to address as practitioner barriers. Patient understanding and willingness to participate is crucial for successful delivery of ACP services.
-
Lack of comfort. Patients are also often uncomfortable with these conversations (Ouchi et al., 2019; Liantonio et al., 2017). Personal experience with death can encourage patients to consider the circumstances around their own end-of-life care, but a poor understanding of disease trajectory and discomfort with discussing death could prevent people from having ACP (Niranjan et al., 2018). Even when patients are interested in ACP, they sometimes feel uncomfortable initiating the conversation themselves, especially with practitioners with whom they are unfamiliar (Hare & Jerome-D'Emilia, 2019).
-
Poor understanding. Some people have a poor understanding of what ACP actually is. This is often due to poor health literacy and cultural differences (Agarwal & Epstein, 2018; Fanta & Tyler, 2017; Government Accountability Office, 2019).
-
Lack of awareness. Most patients are not aware of ACP, are not aware of the importance of ACP, and/or do not know or do not understand what ACP services may be available to them (Fanta & Tyler, 2017).
-
Lack of a surrogate. Some patients lack a surrogate or someone whom they would designate as the decision-maker in the event that they are unable to communicate their desires; family members may be in conflict about who is responsible and which decisions should be made (Liantonio et al., 2017; Fanta & Tyler, 2017).
From our SME discussions, according to executives at an organization focusing on Alzheimer's disease and dementia care, barriers for individuals with cognitive impairment to participate in care planning include a "sense [of this being] a death sentence, a sense of futility around having this disease" because there is no cure. In addition, patients may not want to be diagnosed with cognitive impairment out of fear of losing their independence for tasks such as driving or working, which may discourage them from initiating care planning conversations. These patients and their caregivers also face greater uncertainty about the trajectory of their illness, unreliable recall of discussions and documentation, heightened need to identify an appropriate surrogate decision-maker, and cultural factors surrounding discussing cognitive impairment (Thomas et al., 2018).
3.2.2. Interventions to Facilitate Advance Care Planning
SMEs discussed many interventions their organizations were implementing, as well as other interventions they had heard about that facilitated ACP. Broader interventions supporting ACP include education and training, system redesign, changes to the ACP process, and incentives.
-
Education and training for practitioners. Communication training for both patients and practitioners has been shown to increase rates of ACP (Agarwal & Epstein, 2018). Three ACP training programs for practitioners mentioned most frequently by SMEs were Vital Talk, Respecting Choices, and Ariadne Labs. Vital Talk offers courses, resources, and training sessions to teach clinicians how to effectively communicate with patients and their family members about serious illnesses. Respecting Choices offers comprehensive certification and education programs surrounding ACP, along with services to assist health systems and practitioners change infrastructure, processes, and workflows to support person-centered care. Ariadne Labs offers practitioners a conversation guide to discuss goals, values, and wishes with patients. Other programs that include practitioner education and training for ACP that were mentioned by SMEs are Onco Talk and Complex Care Conversations. One SME mentioned that the American Academy of Hospice and Palliative Medicine and the American College of Physicians offered webinars and presentations at association meetings regarding ACP.
-
Education for patients. Experts underscored the importance of educating patients on ACP. One SME noted:
"If you started a [ACP] conversation by having to start with 'Everybody dies...,' you're not going to get very far. But, if patients are past that point where they say 'Okay, everybody dies; I want to have some control over what that looks like for me,' then you can start to get more richness."
SMEs mentioned online educational tools for patients of all ages and health statuses, such as Our Care Wishes,[10] Prepare for Your Care,[11] and My Care My Choice My Voice.[12] Our Care Wishes, for example, is an online platform provided by Penn Medicine that people can use to easily create, store, and share ACP documents. Penn Medicine also provides hard-copy pamphlets to patients in their clinical waiting rooms that give more information about ACP and their Our Care Wishes online platform. Another SME pointed out the card game Go Wish--which encourages individuals to talk about their care wishes and preferences with loved ones--is a first step in the ACP process.
-
System redesign. SMEs mentioned interventions that had to do with redesigning health systems to accommodate ACP and to make ACP easier for practitioners. One expert cited the U.S. Department of Veterans Affairs' (VA's) Life-Sustaining Treatment Decisions Initiative, which includes a component to encourage the documentation of patients' preferences in the EHR. One SME--an executive of a large physician organization--noted that their organization uses predictive analytics to flag high-risk patients for ACP. Another SME's organization has a patient-facing EHR that includes prompts to patients over 40 asking them if they would be interested in receiving ACP. In addition, the Government Accountability Office (2019) has found that a few states have improved access to ACP documents by using state registries. For example, West Virginia's registry uses the statewide emergency medical services structure to allow providers to access ACP documents en route to an emergency call.
-
Process changes. SMEs were also aware of interventions that aimed to improve the ACP process. Many SMEs cited interventions that take a team-based approach, which is a very important part of Respecting Choices' system redesign for ACP. This approach often includes an ACP facilitator (such as a health care navigator or chronic care manager) to get the conversation started. One SME cited an intervention to implement ACP in group settings (one practitioner with multiple patients), because hearing from other patients in addition to the facilitator may lead to more productive conversations. Studies showed that interventions involving health care navigators or structured group visits helped to increase patient confidence in the ACP process and to increase the likelihood of the patient using ACP services (Niranjan et al., 2018; Lum et al., 2016).
Few interventions are designed specifically for ACP with individuals that have cognitive impairment (Thomas et al., 2018). However, the Alzheimer's Association has worked with the Ad Council to implement a public awareness campaign to promote early detection of cognitive impairment, and they are using the model from Project Extension for Healthcare Outcomes (ECHO) to provide training to primary care practitioners around cognitive assessment, detection, diagnosis, and also care planning and management of patients with dementia.
| EXHIBIT 5. Summary of Barriers of ACP and ACP Interventions |
|---|
| Barriers to Billing ACP Codes |
| Patient cost-sharing: Outside of an annual wellness visit, patients may have to pay for part of the cost of the service. |
| Lack of awareness/knowledge: Many practitioners are unaware that billing codes for ACP exist or are unfamiliar with these codes. |
| Perceived relatively low payment: Alternative codes may provide comparable payment (e.g., 99214). |
| Scope of practice: 99497/99498 are E&M services, which are not considered within the scope of practice or Medicare statutory benefit category of social workers, chaplains and other individuals. Therefore, such individuals may not be authorized to independently report these codes. |
| Health system barriers: Some EHR are not set up for these codes, especially if not all payers pay for these codes. |
| Requirements to bill: Codes are not descriptive enough and the time requirement may be too long. |
| Lack of a NCD: Lack of an NCD allows MACs to have too much discretion in determining the documentation required and the frequency that the ACP codes can be billed. This may cause differences in documentation requirements across MACs, possibly discouraging the use of these codes in regions where the MACs' requirements are perceived to be more rigorous. |
| Barriers to ACP for Practitioners |
| Lack of time: Practitioners often do not have enough time for comprehensive ACP discussions. |
| Lack of comfort: ACP conversations touch on sensitive topics that may make a practitioner feel uncomfortable, or the practitioner, especially if not the patient's primary clinician, may be unfamiliar with the patient. Also, during ACP, individuals may reveal preferences for less life-prolonging treatment, which can feel at odds with a physician's training and identity. |
| Lack of training: Many practitioners report having little to no training regarding ACP. |
| Documentation: Practitioners may be confused about documentation requirements for ADs and other ACP documents, or may have difficulty accessing documents within or between EHR systems. |
| Lack of coordination: Patients often have multiple practitioners, and there can be confusion about which practitioner should coordinate the ACP process. |
| Lack of a clear definition of ACP: ACP has different names and definitions, which may cause confusion among practitioners. |
| FFS compensation structure: Favors billing more services instead of incentivizing practitioners to provide potentially time-intensive, value-based activities, such as ACP. |
| Initiative fatigue: Practitioners cannot keep up with a series of new initiatives. |
| Care planning for individuals with cognitive impairment: Dementia-related diseases are under-diagnosed and under-disclosed; prognosis is more uncertain; frequent transitions in care; more clinicians are involved in the individual's care; may require greater effort to coordinate with the patient's surrogate decision-maker. |
| Barriers to ACP for Patients |
| Lack of comfort: Patients are sometimes uncomfortable with discussing death and other end-of-life topics. |
| Poor understanding: Some patients do not understand ACP. |
| Lack of awareness: Some patients do not know what ACP is or are not aware of ACP services. |
| Lack of a surrogate: Patients may not have someone to make care decisions for them if they become incapacitated. |
| Care planning for individuals with cognitive impairment: Lack of a cure for Alzheimer's disease and related dementias introduces a sense of futility around having dementia; patients may not want to be diagnosed due to fear that they will lose their independence; prognosis is more uncertain; unreliable recall of discussions and documentation; cultural factors surrounding discussing cognitive impairment. |
| Interventions to Facilitate Use of the ACP Codes and ACP |
| Education and training for practitioners: Programs include Vital Talk, Respecting Choices, Ariadne Labs, Onco Talk, Complex Care Conversations, Project ECHO; fact sheets and FAQ documents about the ACP codes by CMS are also available. |
| Education and training for patients: Programs include Five Wishes, Our Care Wishes, Prepare for Your Care, My Care My Choice My Voice; other resources include Go Wish card game, public awareness campaigns (e.g., through the Advisory Council), description of ACP in Medicare and You booklet. |
| System redesign: Improving access to ACP documentation in the EHR (e.g., VA's Life-Sustaining Treatment Decisions Initiative), predictive analytics to flag high-risk patients for ACP, EHR prompts for ACP to patients over 40, and using state registries to store ACP documents. |
| ACP process changes: Using a team-based (including physicians and other practitioners) approach or conducting ACP in a group setting with multiple patients (for practitioners and health systems not already doing so). |
| Incentives: Financial incentives; holding provider leadership accountable for providing minimum levels of voluntary ACP to high-risk individuals. |
| SOURCE: RTI International literature review and analysis of SME interviews. |
3.2.3. Changes in Advance Care Planning Before and After the Adoption of the Advance Care Planning Codes
Because we cannot track ACP activity prior to the introduction of the ACP codes, it is difficult to assess the impact of the codes on the provision of services. However, experts have noted that the codes have led to meaningful change. Our SME interviews revealed that the most frequently cited change in ACP practice was that the codes could standardize and provide structure for ACP. SMEs noted the codes can set a standardized length of time for ACP conversations and encourage health organizations and systems to implement ACP interventions, such as practitioner training. Multiple SMEs noted that the ability to bill for time spent with a patient's family member(s) or surrogate, even when the patient is not present, provides an opportunity to increase the involvement of the patient's family member(s) or surrogate.
4. DISCUSSION AND CONCLUSION
4.1. Discussion
Based on our literature review and SME interviews, researchers, health care professionals and clinicians perceive ACP as an important service to ensure patients' care at times of incapacitation is consistent with their preferences and wishes. According to experts, separately paying for ACP services is an important intervention to facilitate the use of ACP. Since the AMA introduced CPT codes for ACP services in 2015, Medicare and other payers have adopted them to separately pay practitioners for ACP services. These billing codes may encourage the provision of ACP services, and they may also be useful for tracking ACP activity.
In the first years after CMS's adoption of the ACP codes, use of the codes was low, but increased over time. Only 2.81% of Medicare FFS beneficiaries had a billed 99497 in 2017--up from 1.67% in 2016. Only around 20% of hospice and palliative care physicians billed the codes in 2017 and the first three quarters of 2018. This suggests that these codes may not reflect of all ACP activity since hospice and palliative care physicians routinely provide ACP services. For individuals with cognitive impairment, Medicare adopted billing code G0505 in 2017 and 99483 in 2018 to pay practitioners for assessment and care planning. The take-up rate for these codes has been even lower; 0.06% of Medicare FFS beneficiaries had a billed G0505/99483 in 2017.
The low use of these ACP codes may be reflective of certain barriers, such as patient cost-sharing outside the annual wellness visit, practitioners' lack of awareness about the availability of the codes, and exclusion of certain clinical staff from independently billing these ACP codes. In addition, in circumstances where some payers in a given health system do not pay practitioners for these codes, the health system may not be able to introduce these codes for billing due to compliance issues. Because 99483/G0505 has only been in use since 2017, its low use may be due to a lack of practitioner awareness.
Some of these barriers will be difficult to address. For example, according to the CY 2016 Physician Fee Schedule Final Rule, CMS lacks statutory authority to waive cost-sharing for ACP services because they are not preventive services under Medicare law. In addition, educational campaigns to increase awareness of these codes require resources to implement.
Compared to beneficiaries without a billed ACP claim, beneficiaries with a billed 99497 were older, sicker, more likely to be female, and almost three times more likely to die within the CY. In addition, these beneficiaries were more likely to live in counties with higher median household incomes, higher percentages of adults with a college education, and more primary care physicians per 10,000 Medicare FFS beneficiaries. These patterns suggest that practitioners may have prioritized beneficiaries older and nearer to the end of life for ACP services. While the low use of ACP billing codes may suggest a need for education and training broadly, education and training initiatives may benefit from focusing more on ACP for male beneficiaries, beneficiaries who live in areas with fewer primary care physicians or lower socioeconomic status, or those in the Midwest.
Beneficiaries with a billed 99498 (additional 30-minute increments of ACP after a billed 99497) tend to be near the end of life and have longer ACP conversations. In 2017 and the first three quarters of 2018, around one-half of beneficiaries died during the year of the billed 99498 claim. Among those who died, the median date of death was approximately two weeks after the billed 99498 claim. In addition, almost one-half of billed 99498 claims occurred in the inpatient hospital. In comparison, only 13.4% of billed 99497 claims occurred in the inpatient hospital. In comparison to 99497 claims, a much higher percent of 99498 claims are billed by non-physician practitioners, such as nurse practitioners. This may suggest that physicians may not have enough time to conduct lengthy ACP conversations or that physicians have fewer interactions with their patients near the end of life.
Care planning for individuals with cognitive impairment is provided when a patient exhibits signs and/or symptoms of cognitive impairment. As expected, our analysis shows that the most common principal diagnoses in claims with a billed 99483/G0505 are related to cognitive impairment or dementia. Billing 99483/G0505 requires many other elements including a cognition-focused evaluation, use of standardized instruments for staging of dementia, and medication reconciliation and review for high-risk medications. The practitioner typically spends 50 minutes with the patient and/or family or caregiver and CMS prohibits practitioners from billing 99483/G0505 in conjunction with similar E&M services. However, we found that 24% of billed 99483/G0505 were billed with these E&M services in 2017. This percentage declines to 5% during the first three quarters of 2018, suggesting that practitioners may be learning how to use these codes appropriately, potentially because more resources on these codes were published in 2018, including information in AMA's 2018 CPT Professional Manual (AMA, 2018).
According to the SMEs, paying practitioners for providing ACP services is an important intervention that may facilitate the use of ACP, but many other barriers need to be addressed to significantly increase the provision of ACP services. We identified many barriers to ACP, including lack of time available during a patient visit for physicians to incorporate ACP, practitioner and patient discomfort in discussing ACP, and lack of training and educational materials available to practitioners and consumers. To help address these barriers, education and training for both practitioners and patients are the most frequently cited interventions. Education and training programs include well-known programs such as Ariadne Labs and Vital Talk for practitioners and online educational tools for patients.
Our study has a few limitations. First, practitioners are included in our sample if they provided a service to the 5% random sample of Medicare FFS beneficiaries. This sample of practitioners may not be representative of the overall population of Medicare practitioners. For example, practitioners who provide services to a large number of Medicare FFS beneficiaries may be more likely to be in our sample, because their patient population is more likely to include a beneficiary in the 5% sample. Nonetheless, our findings examining practitioner characteristics are consistent with findings from other studies (Belanger et al., 2019; Pelland et al., 2019; Grant, 2018). Second, we conducted descriptive analyses to compare the characteristics of practitioners and beneficiaries with and without billed ACP services, and are unable to draw any causal relationships between those characteristics and the billed ACP services. Finally, to compare the health status of beneficiaries with and without billed ACP claims, we use the diagnosis codes on Part B Medicare claims and do not include diagnosis codes on Part A Medicare claims (i.e., inpatient hospital care, inpatient skilled nursing facility care, skilled home health care and hospice care services).
4.2. Conclusion
We found low use of ACP codes in Medicare FFS, but use has increased over time. Our interviews and literature review revealed significant barriers to use, including practitioners' lack of awareness. Practitioners also may still lack the time or may not be comfortable providing ACP. Patients may lack a surrogate decision-maker or may be uncomfortable talking about ACP. However, we found that payers and practitioners see value in ACP and have implemented a wide variety of interventions to begin to address barriers. More education, outreach, and training may help to facilitate use.
REFERENCES
Agarwal, R., & Epstein, A.S. (2018). Advance care planning and end-of-life decision making for patients with cancer. In Seminars in Oncology Nursing, 34(3), 316-326). WB Saunders.
Alzheimer's Association. (2017a). Medicare Coverage of Care Planning for People with Cognitive Impairment. Retrieved from: https://www.alz.org/media/Documents/alzheimers-dementia-medicare-coverage-for-careplanners-ts.pdf.
Alzheimer's Association. (2017b). Cognitive Impairment Care Planning Toolkit. Retrieved from: https://www.alz.org/careplanning/downloads/care-planning-toolkit.pdf.
Alzheimer's Association. (2018). Fact Sheet: Care Planning for People with Cognitive Impairment. Retrieved from: http://act.alz.org/site/DocServer/Care_Planning_for_People_with_Cognitive_Impairment.pdf?docID=52585.
American Academy of Family Physicians. (2019). QPP Now: Advance Care Planning. Retrieved from: https://www.aafp.org/practice-management/payment/coding/medicare-coordination-services/acp.html.
American College of Emergency Physicians. (2017). Advance Care Planning FAQ [Fact Sheet]. Retrieved from: https://www.acep.org/administration/reimbursement/reimbursement-faqs/advance-care-planning-faq/#question7.
American College of Physicians. (2015). Advance Care Planning: Implementation for Practices [Fact Sheet]. Retrieved from: https://www.acponline.org/sites/default/files/private/documents/practice-resources/business-resources/payment/medicare/advance_care_planning_toolkit.pdf.
American Geriatric Society. (2016). Frequently Asked Questions about Billing the Physician Fee Schedule for Advance Care Planning [Fact Sheet]. Retrieved from: https://www.americangeriatrics.org/sites/default/files/inline-files/Advance-Care-Planning-FAQs.pdf.
American Hospital Association. (2018). Advance Care Planning [Fact Sheet]. Retrieved from: https://www.cms.gov/Outreach-and-Education/Medicare-Learning-Network-MLN/MLNProducts/Downloads/AdvanceCarePlanning.pdf.
American Medical Association (AMA). (2018). CPT 2019: Professional Edition.
Barnato, A.E., O'Malley, J.A., Skinner, J.S., & Birkmeyer, J.D. (2019). Use of advance care planning billing codes for hospitalized older adults at high risk of dying: A national observational study. J. Hosp. Med., 14(4), 229-231. doi:10.12788/jhm.3150.
Belanger, E., Loomer, L., Teno, J.M., Mitchell, S.L., Adhikari, D., & Gonzalo, P.L. (2019). Early utilization patterns of the new Medicare procedure codes for advance care planning. JAMA Intern Med, Published online March 11, 2019. doi:10.1001/jamainternmed.2018.8615.
Centers for Medicare & Medicaid Services (CMS). (2019a). Physician Fee Schedule Search. Retrieved from: https://www.cms.gov/apps/physician-fee-schedule/overview.aspx.
Centers for Medicare & Medicaid Services (CMS). (2019b). Medicare Current Beneficiary Survey: 2016 Chartbook. Retrieved from: https://www.cms.gov/Research-Statistics-Data-and-Systems/Research/MCBS/Data-Tables-Items/2016Chartbook.html?DLPage=1&DLEntries=10&DLSort=0&DLSortDir=descending.
Centers for Medicare & Medicaid Services (CMS). (2019c). Advance Care Planning MLN Fact Sheet. Retrieved from: https://www.cms.gov/Outreach-and-Education/Medicare-Learning-Network-MLN/MLNProducts/Downloads/AdvanceCarePlanning.pdf.
Centers for Medicare & Medicaid Services (CMS). (2019d). Medicare and You. Retrieved from: https://www.medicare.gov/sites/default/files/2019-09/10050-medicare-and….
Centers for Medicare & Medicaid Services (CMS). (2019e). Advance Care Planning. Retrieved from: https://www.medicare.gov/coverage/advance-care-planning.
Centers for Medicare & Medicaid Services (CMS). (2018). Initial Preventive Physical Examination MLN Fact Sheet. Retrieved from: https://www.cms.gov/Outreach-and-Education/Medicare-Learning-Network-MLN/MLNProducts/Downloads/MPS_QRI_IPPE001a.pdf.
Centers for Medicare & Medicaid Services (CMS). (2017). Medicare Program; Revisions to Payment Policies Under the Physician Fee Schedule and Other Revisions to Part B for CY 2018; Medicare Shared Savings Program Requirements; and Medicare Diabetes Prevention Program. Retrieved from: https://www.govinfo.gov/content/pkg/FR-2017-11-15/pdf/2017-23953.pdf.
Centers for Medicare & Medicaid Services (CMS). (2016a). Medicare Program; Revisions to Payment Policies Under the Physician Fee Schedule and Other Revisions to Part B for CY 2017. Retrieved from: https://www.govinfo.gov/content/pkg/FR-2016-11-15/pdf/2016-26668.pdf.
Centers for Medicare & Medicaid Services (CMS). (2016b). Frequently Asked Questions about Billing the Physician Fee Schedule for Advance Care Planning Services. Retrieved from: https://www.cms.gov/Medicare/Medicare-Fee-for-Service-Payment/PhysicianFeeSched/Downloads/FAQ-Advance-Care-Planning.pdf.
Centers for Medicare & Medicaid Services (CMS). (2015). Medicare Program; Revisions to Payment Policies Under the Physician Fee Schedule and Other Revisions to Part B for CY 2016. Retrieved from: https://www.federalregister.gov/documents/2015/11/16/2015-28005/medicare-program-revisions-to-payment-policies-under-the-physician-fee-schedule-and-other-revisions.
Coalition for Compassionate Care of California. (2017). FAQs: Advance Care Planning Under Medicare [Fact Sheet]. Retrieved from: https://coalitionccc.org/wp-content/uploads/2017/11/ACP-CodesFAQs_CCCC_Nov2017.pdf?x90552.
Cubanski, J., Damico, A., Neuman, T., & Jacobson, G. (2018). Sources of Supplemental Coverage Among Medicare Beneficiaries in 2016. Retrieved from: https://www.kff.org/medicare/issue-brief/sources-of-supplemental-coverage-among-medicare-beneficiaries-in-2016/.
Detering, K., Hancock, A., Reade, M., & Silvester, W. (2010). The impact of advanced care planning on end of life care in elderly patients: Randomised controlled trial. BMJ, 340, c1345.
Dillon, E., Chuang, J., Gupta, A., Tapper, S., Lai, S., Yu, P., Ritchie, C.S., & Tai-Seale, M. (2017). Provider perspectives on advance care planning documentation in the electronic health record: The experience of primary care providers and specialists using advance health-care directives and physician orders for life-sustaining treatment. American Journal of Hospice and Palliative Medicine, 34(10), 918-924.
Dingfield, L.E., & Kayser, J.B. (2017). Integrating advance care planning into practice. Chest, 151(6), 1387-1393.
Fanta, L., & Tyler, J. (2017). Physician perceptions of barriers to advance care planning.South Dakota Medicine, 70(7).
Fulmer, T., Escobedo, M., Berman, A., Koren, M.J., Hernández, S., & Hult, A. (2018). Physicians' views on advance care planning and endoflife care conversations.Journal of the American Geriatrics Society, 66(6), 1201-1205.
Grant, M. (2018). New data on ACP billing codes use shows significant increases. Blog to Transform Advanced Care. Retrieved from: https://www.thectac.org/2018/11/new-data-on-acp-billing-codes-use-shows-significant-increases/.
Gruneir, A., Mor, V., Weitzen, S., Truchil, R., Teno, J., & Roy, J.. (2007). Where people die: A multilevel approach to understanding influences on site of death in America. Medical Care Research & Review, 64(4): 351-378.
Government Accountability Office. (2019). Advance Care Planning: Selected States' Efforts to Educate and Address Access Challenges. Retrieved from: https://www.gao.gov/products/GAO-19-231.
Hammes, B., & Meier, D.E. (2019). Advance care planning requires training. Journal of the American Geriatrics Society, 67(1), 189-189.
Hare, D., & Jerome-D'Emilia, B. (2019). Using advance care planning to inform and improve practice.Journal for Nurse Practitioners, 15(3), e61-e63.
Health Care Cost Institute. (2019). Examining the Adoption of a New Medicare Billing Code for Cognitive Assessments: A Slow but Steady Uptake. Retrieved from: https://www.healthcostinstitute.org/blog/entry/examining-the-adoption-of-a-new-medicare-billing-code-for-cognitive-assessments-a-slow-but-steady-uptake.
Institute of Medicine. (2014). Dying in America: Improving Quality and Honoring Individual Preferences Near the End of Life. Accessed on December 18, 2018. Retrieved from: http://www.nationalacademies.org/hmd/Reports/2014/Dying-In-America-Impr….
Jimenez, G., Tan, W.S., Virk, A.K., Low, C.K., Car, J., & Ho, A.H.Y. (2019). State of advance care planning research: A descriptive overview of systematic reviews. Palliative & Supportive Care, 17(2), 234-244.
Jones, C.A., Acevedo, J., Bull, J., & Kamal, A.H. (2016). Top 10 tips for using advance care planning codes in palliative medicine and beyond. Journal of Palliative Medicine, 19(12), 1249-1253.
Liantonio, J., Liquori, M., Lakhtman, L., & Parks, S. (2017). Advance care planning: Making it easier for patients (and you). Journal of Family Practice, 66(8), 487-491.
Lum, H.D., Jones, J., Matlock, D.D., Glasgow, R.E., Lobo, I., Levy, C.R., Schwartz, R.S., Sudore, R.L. & Kutner, J.S. (2016). Advance care planning meets group medical visits: The feasibility of promoting conversations. Annals of Family Medicine, 14(2), 125-132.
Massachusetts Blue Cross Blue Shield. (2016). Advance Care Planning: Payment Policy. Retrieved from: https://provider.bluecrossma.com/ProviderHome/wcm/connect/68befcc2-b011….
McCarthy, D., Hostetter, M., & Klein, S. (2018). The Promise of Advanced Illness Management to Improve Care at the End of Life. To the Point: Quick Takes on Health Care Policy and Practice. Retrieved from: https://www.commonwealthfund.org/blog/2018/promise-advanced-illness-management-improve-care-end-life.
Moore, K.J., & Hayes, B. (2017). New codes, new payment opportunities for 2017. Family Practice Management, 24(1), 7-11.
Niranjan, S.J., Huang, C.H.S., Dionne-Odom, J.N., Halilova, K.I., Pisu, M., Drentea, P., Kvale, E.A., Bevis, K.S., Butler, T.W., Partridge, E.E. & Rocque, G.B. (2018). Lay patient navigators' perspectives of barriers, facilitators and training needs in initiating advance care planning conversations with older patients with cancer. Journal of Palliative Care, 33(2), 70-78.
Ollove, M. (2014). Feds to Consider Paying for End-of-Life Planning. Stateline. Retrieved from: https://www.pewtrusts.org/en/research-and-analysis/blogs/stateline/2014/05/30/feds-to-consider-paying-for-end-of-life-planning.
Ouchi, K., George, N., Schuur, J.D., Aaronson, E.L., Lindvall, C., Bernstein, E., Sudore, R.L., Schonberg, M.A., Block, S.D., & Tulsky, J.A. (2019). Goals-of-care conversations for older adults with serious illness in the emergency department: Challenges and opportunities. Annals of Emergency Medicine.
Pelland, K., Morphis, B., Harris, D., & Gardner, R. (2019). Assessment of first-year use of Medicare's advance care planning billing codes. JAMA Intern Med, Published online March 11, 2019. doi:10.1001/jamainternmed.2018.8107.
Respecting Choices. (2018). Advance Care Planning Billing Resource Guide. Retrieved from: https://respectingchoices.org/wp-content/uploads/2018/09/RC_5009_ACP_Billing_Resource_Guide_09.19.18.pdf.
Rodgers, P., & Schellinger, S. (2018). To Bill or Not to Bill, that is the Question?! Using ACP Billing Codes in Your Daily Practice. Retrieved from: https://respectingchoices.org/wp-content/uploads/2018/10/2018-10-24-11.00-W1-4-To-Bill-or-Not-to-Bill-Phil-Rodgers-and-Sandra-Schellinger.pdf.
Silveira, M.J., Kim, S.Y.H., and Langa, K.M. (2010). Advance directives and outcomes of surrogate decision making before death. New England Journal of Medicine, 362, 1211-1208.
Solis, G.R., Mancera, B.M., & Shen, M.J. (2018). Strategies used to facilitate the discussion of advance care planning with older adults in primary care settings: A literature review. Journal of the American Association of Nurse Practitioners, 30(5), 270-279.
Sonenberg, A., & Sepulveda-Pacsi, A.L. (2018). Medicare payment: Advanced care planning. Journal for Nurse Practitioners, 14(2), 112-116.
Sudore, R.L., Lum, H.D., You, J.J., Hanson, L.C., Meier, D.E., Pantilat, S.Z., Matlock, D.D., Rietjens, J.A.C., Korfage, I.J., Ritchie, C.S., Kutner, J.S., Teno, J.M., Thomas, J., McMahan, R.D., & Heyland, D.K. (2017). Defining advance care planning for adults: A consensus definition from a multidisciplinary Delphi panel. Journal of Pain and Symptom Management, 53(5), 821-832.
Thomas, J.D., SanchezReilly, S., Bernacki, R., O'Neill, L., Morrison, L.J., Kapo, J., Periyakoil, V.S., & Carey, E.C. (2018). Advance care planning in cognitively impaired older adults. Journal of the American Geriatrics Society, 66(8), 1469-1474.
Tsai, G., & Taylor, D.H. (2018). Advance care planning in Medicare: An early look at the impact of new reimbursement on billing and clinical practice. BMJ Supportive & Palliative Care, 8(1), 49-52.
Tuller, D. (2016). Medicare coverage for advance care planning: Just the first step. Health Affairs, 35(3). doi: full/10.1377/hlthaff.2016.0107.
U.S. Preventative Services Task Force (USPSTF). (2019). Appendix I. Congressional Mandate Establishing the U.S. Preventive Services Task Force. Retrieved from: https://www.uspreventiveservicestaskforce.org/Page/Name/appendix-i-cong….
Yadav, K.N., Gabler N.B., Cooney, E., Kent, S., Kim, J., Herbst N., Mante, A., Halpern, S.D. & Courtright, K.R. (2017). Approximately one in three US adults completes any type of advance directive for end-of-life care. Health Affairs, 36(7). doi: full/10.1377/hlthaff.2017.0175.
APPENDIX A. ADDITIONAL DATA EXHIBITS
| EXHIBIT A-1a. Demographic Characteristics of FFS Beneficiaries with and without a Billed ACP Claim in 2016 | |||||
|---|---|---|---|---|---|
| Demographic Characteristics | No ACP Billed | 994971 Billed | Difference 99497 Billed Minus No ACP | 994981 Billed | Difference 99498 Billed Minus No ACP |
| Total beneficiaries | 1,589,415 | 26,981 | --- | 491 | --- |
| Beneficiaries with billed ACP, % | 98.33 | 1.67 | --- | 0.03 | --- |
| Age, mean | 70.91 | 75.17 | 4.25*** | 76.93 | 6.02*** |
| Male, % | 45 | 41 | -5*** | 43 | -2 |
| Female, % | 55 | 59 | 5*** | 57 | 2 |
| White, % | 83 | 84 | 1*** | 78 | -5** |
| Black, % | 10 | 8 | -1*** | 11 | 2 |
| Other race, % | 2 | 2 | 0*** | 2 | 0 |
| Beneficiaries eligible for both Medicare and full Medicaid benefits, % | 14 | 13 | -1*** | 29 | 15*** |
| Beneficiaries eligible for both Medicare and partial Medicaid benefits, % | 5 | 4 | -1*** | 3 | -2* |
| Beneficiaries not eligible for Medicaid benefits, % | 81 | 83 | 3*** | 68 | -12*** |
| Beneficiary died during the calendar year, % | 4 | 9 | 4*** | 38 | 33*** |
| Days until death after ACP claim, mean | --- | 59 | --- | 34 | --- |
| Days until death after ACP claim, min | --- | 0 | --- | 0 | --- |
| Days until death after ACP claim, median | --- | 28 | --- | 12 | --- |
| Days until death after ACP claim, max | --- | 353 | --- | 293 | --- |
| Household income of county, median | $54,155 | $55,832 | $1,677*** | $58,510 | $4,355*** |
| 25+ year old with 4+ years of college (2010-2014), % | 27.8 | 28.78 | 0.98*** | 31.61 | 3.81*** |
| Primary care physicians per 10,000 Medicare FFS beneficiaries (2014) | 63.93 | 65.67 | 1.74*** | 78.58 | 14.65*** |
| SOURCE: RTI International analysis of Medicare Part B claims and enrollment data for the 5% random sample of Medicare FFS beneficiaries. NOTES: * p 0.05, ** p 0.01, *** p 0.001. We restricted each year's sample to beneficiaries continuously enrolled in Medicare FFS throughout the year or until the month of death.
| |||||
| EXHIBIT A-1b. Demographic Characteristics of FFS Beneficiaries with and without a Billed ACP Claim in 2017 | |||||||
|---|---|---|---|---|---|---|---|
| Characteristics | No ACP Billed | 994971 Billed | Difference 99497 Billed Minus No ACP | 994981 Billed | Difference 99498 Billed Minus No ACP | 99483/ G05051 Billed | Difference 99483/G0505 Billed Minus No ACP |
| Total beneficiaries | 1,563,907 | 45,241 | --- | 1,170 | --- | 904 | --- |
| Beneficiaries with billed ACP, % | 97.14 | 2.81 | --- | 0.07 | --- | 0.06 | --- |
| Age, mean | 70.96 | 74.89 | 3.93*** | 77.92 | 6.96*** | 77.56 | 6.60*** |
| Male, % | 45 | 42 | -4*** | 45 | 0 | 41 | -4*** |
| Female, % | 55 | 58 | 4*** | 55 | 0 | 59 | 4*** |
| White, % | 83 | 83 | 0 | 76 | -7*** | 84 | 1 |
| Black, % | 9 | 9 | 0 | 14 | 4*** | 10 | 1 |
| Other race, % | 2 | 2 | 0*** | 2 | 0 | 1 | -1 |
| Beneficiaries eligible for both Medicare and full Medicaid benefits, % | 14 | 14 | 0 | 30 | 16*** | 15 | 1 |
| Beneficiaries eligible for both Medicare and partial Medicaid benefits, % | 5 | 4 | -1*** | 4 | -1 | 4 | -1 |
| Beneficiaries not eligible for Medicaid benefits, % | 81 | 82 | 1*** | 66 | -15*** | 81 | 0 |
| Beneficiary died during the calendar year, % | 4 | 11 | 7*** | 48 | 44*** | 4 | 0 |
| Days until death after ACP claim, mean | --- | 61 | --- | 32 | --- | 120 | --- |
| Days until death after ACP claim, min | --- | 0 | --- | 0 | --- | 9 | --- |
| Days until death after ACP claim, median | --- | 30 | --- | 11 | --- | 118 | --- |
| Days until death after ACP claim, max | --- | 358 | --- | 324 | --- | 289 | --- |
| Household income of county, median | $54,217 | $55,423 | $1,206*** | $57,723 | $3,506*** | $55,538 | $1,321** |
| 25+ year old with 4+ years of college (2010-2014), % | 27.83 | 28.35 | 0.52*** | 30.83 | 2.99*** | 28.80 | 0.97** |
| Primary care physicians per 10,000 Medicare FFS beneficiaries (2014) | 64.01 | 65.00 | 0.99*** | 75.99 | 11.98*** | 67.89 | 3.89** |
| SOURCE: RTI International analysis of Medicare Part B claims and enrollment data for the 5% random sample of Medicare FFS beneficiaries. NOTES: ** p 0.01, *** p 0.001. We restricted each year's sample to beneficiaries continuously enrolled in Medicare FFS throughout the year or until the month of death.
| |||||||
| EXHIBIT A-1c. Demographic Characteristics of FFS Beneficiaries with and without a Billed ACP Claim in 2018 Quarters 1-3 | |||||||
|---|---|---|---|---|---|---|---|
| Characteristics | No ACP Billed | 994971 Billed | Difference 99497 Billed Minus No ACP | 994981 Billed | Difference 99498 Billed Minus No ACP | 99483/ G05051 Billed | Difference 99483/G0505 Billed Minus No ACP |
| Total beneficiaries | 1,562,447 | 41,078 | --- | 1,238 | --- | 917 | --- |
| Beneficiaries with billed ACP, % | 97.39 | 2.56 | --- | 0.08 | --- | 0.06 | --- |
| Age, mean | 71.06 | 75.12 | 4.06*** | 78.41 | 7.35*** | 77.92 | 6.86*** |
| Male, % | 45 | 42 | -4*** | 43 | -2 | 40 | -5** |
| Female, % | 55 | 58 | 4*** | 57 | 2 | 60 | 5** |
| White, % | 83 | 82 | -1** | 77 | -6*** | 81 | -2 |
| Black, % | 9 | 10 | 1*** | 13 | 4*** | 12 | 3** |
| Other race, % | 2 | 2 | 1*** | 2 | 1 | 1 | -1 |
| Beneficiaries eligible for both Medicare and full Medicaid benefits, % | 14 | 15 | 1*** | 29 | 15*** | 18 | 4*** |
| Beneficiaries eligible for both Medicare and partial Medicaid benefits, % | 5 | 4 | -1*** | 4 | -1 | 4 | -1 |
| Beneficiaries not eligible for Medicaid benefits, % | 81 | 81 | -1*** | 67 | -14*** | 79 | -3* |
| Beneficiary died during the calendar year, % | 4 | 13 | 9*** | 52 | 48*** | 3 | -1 |
| Days until death after ACP claim, mean | --- | 65 | --- | 42 | --- | 130 | --- |
| Days until death after ACP claim, min | --- | 0 | --- | 0 | --- | 9 | --- |
| Days until death after ACP claim, median | --- | 39 | --- | 18 | --- | 146 | --- |
| Days until death after ACP claim, max | --- | 340 | --- | 290 | --- | 282 | --- |
| Household income of county, median | $54,333 | $55,785 | $1,452*** | $56,782 | $2,450*** | $56,379 | $2,046*** |
| 25+ year old with 4+ years of college (2010-2014), % | 27.91 | 28.49 | 0.58*** | 30.51 | 2.59*** | 29.98 | 2.07*** |
| Primary care physicians per 10,000 Medicare FFS beneficiaries (2014) | 64.21 | 65.30 | 1.09*** | 73.3 | 9.10*** | 71.44 | 7.24*** |
| SOURCE: RTI International analysis of Medicare Part B claims and enrollment data for the 5% random sample of Medicare FFS beneficiaries. NOTES: * p 0.05, ** p 0.01, *** p 0.001. We restricted each year's sample to beneficiaries continuously enrolled in Medicare FFS throughout the year or until the month of death.
| |||||||
| EXHIBIT A-2. Top 20 Principal Diagnosis Codes during First 99497 Claim in 2016 | ||
|---|---|---|
| Rank | Diagnosis Description | Percent of Beneficiaries Where Diagnosis was Indicated |
| 1 | Encounter for general adult medical exam without abnormal findings | 28.61% |
| 2 | Essential (primary) hypertension | 10.24% |
| 3 | Encounter for general adult medical exam w abnormal findings | 6.46% |
| 4 | Other specified counseling | 2.96% |
| 5 | Type 2 diabetes mellitus without complications | 2.60% |
| 6 | Hyperlipidemia, unspecified | 1.63% |
| 7 | Atherosclerotic heart disease of native coronary artery without angina pectoris | 1.23% |
| 8 | Chronic obstructive pulmonary disease, unspecified | 1.09% |
| 9 | Encounter for immunization | 1.02% |
| 10 | Hypothyroidism, unspecified | 0.84% |
| 11 | Mixed hyperlipidemia | 0.77% |
| 12 | Unspecified atrial fibrillation | 0.70% |
| 13 | Encounter for palliative care | 0.64% |
| 14 | Type 2 diabetes mellitus with hyperglycemia | 0.62% |
| 15 | Heart failure, unspecified | 0.62% |
| 16 | Pure hypercholesterolemia | 0.60% |
| 17 | Unspecified dementia without behavioral disturbance | 0.52% |
| 18 | Urinary tract infection, site not specified | 0.52% |
| 19 | Gastro-esophageal reflux disease without esophagitis | 0.46% |
| 20 | Low back pain | 0.44% |
| SOURCE: RTI International analysis of Medicare Part B claims and enrollment data for the 5% random sample of Medicare FFS beneficiaries. NOTES: We restricted each year's sample to beneficiaries continuously enrolled and with at least one claim in Medicare FFS from 2015 through 2016/the month of death. We used the Agency for Healthcare Research and Quality Clinical Classification Software to classify ICD-9 and ICD-10 diagnosis codes into larger categories of diagnoses. 99497 is for the first 30 minutes of ACP. | ||
| EXHIBIT A-3. Top 20 Principal Diagnosis Codes during First 99497 Claim in 2017 | ||
|---|---|---|
| Rank | Diagnosis Description | Percent of Beneficiaries Where Diagnosis was Indicated |
| 1 | Encounter for general adult medical exam without abnormal findings | 30.85% |
| 2 | Essential (primary) hypertension | 8.23% |
| 3 | Encounter for general adult medical exam w abnormal findings | 6.67% |
| 4 | Other specified counseling | 2.90% |
| 5 | Type 2 diabetes mellitus without complications | 1.86% |
| 6 | Hyperlipidemia, unspecified | 1.12% |
| 7 | Encounter for palliative care | 1.06% |
| 8 | Atherosclerotic heart disease of native coronary artery without angina pectoris | 1.01% |
| 9 | Chronic obstructive pulmonary disease, unspecified | 0.93% |
| 10 | Encounter for immunization | 0.78% |
| 11 | Unspecified atrial fibrillation | 0.73% |
| 12 | Hypothyroidism, unspecified | 0.71% |
| 13 | Mixed hyperlipidemia | 0.70% |
| 14 | Urinary tract infection, site not specified | 0.61% |
| 15 | Heart failure, unspecified | 0.57% |
| 16 | Type 2 diabetes mellitus with hyperglycemia | 0.55% |
| 17 | Pneumonia, unspecified organism | 0.55% |
| 18 | Pure hypercholesterolemia, unspecified | 0.53% |
| 19 | Sepsis, unspecified organism | 0.50% |
| 20 | Unspecified dementia without behavioral disturbance | 0.47% |
| SOURCE: RTI International analysis of Medicare Part B claims and enrollment data for the 5% random sample of Medicare FFS beneficiaries. NOTES: We restricted each year's sample to beneficiaries continuously enrolled and with at least one claim in Medicare FFS from 2016 through 2017/the month of death. We used the Agency for Healthcare Research and Quality Clinical Classification Software to classify ICD-9 and ICD-10 diagnosis codes into larger categories of diagnoses. 99497 is for the first 30 minutes of ACP. | ||
| EXHIBIT A-4. Top 20 Principal Diagnosis Codes during First 99497 Claim in 2018 Quarters 1-3 | ||
|---|---|---|
| Rank | Diagnosis Description | Percent of Beneficiaries Where Diagnosis was Indicated |
| 1 | Encounter for general adult medical exam without abnormal findings | 29.59% |
| 2 | Essential (primary) hypertension | 7.96% |
| 3 | Encounter for general adult medical exam w abnormal findings | 6.39% |
| 4 | Other specified counseling | 2.99% |
| 5 | Type 2 diabetes mellitus without complications | 1.89% |
| 6 | Encounter for palliative care | 1.09% |
| 7 | Hyperlipidemia, unspecified | 1.09% |
| 8 | Chronic obstructive pulmonary disease, unspecified | 1.02% |
| 9 | Atherosclerotic heart disease of native coronary artery without angina pectoris | 1.00% |
| 10 | Unspecified atrial fibrillation | 0.72% |
| 11 | Mixed hyperlipidemia | 0.70% |
| 12 | Hypothyroidism, unspecified | 0.69% |
| 13 | Pneumonia, unspecified organism | 0.66% |
| 14 | Sepsis, unspecified organism | 0.64% |
| 15 | Urinary tract infection, site not specified | 0.62% |
| 16 | Heart failure, unspecified | 0.61% |
| 17 | Unspecified dementia without behavioral disturbance | 0.55% |
| 18 | Type 2 diabetes mellitus with hyperglycemia | 0.53% |
| 19 | Acute kidney failure, unspecified | 0.48% |
| 20 | Cerebral infarction, unspecified | 0.47% |
| SOURCE: RTI International analysis of Medicare Part B claims and enrollment data for the 5% random sample of Medicare FFS beneficiaries. NOTES: We restricted each year's sample to beneficiaries continuously enrolled and with at least one claim in Medicare FFS from 2017 through 2018 Quarter 3/the month of death. We used the Agency for Healthcare Research and Quality Clinical Classification Software to classify ICD-9 and ICD-10 diagnosis codes into larger categories of diagnoses. 99497 is for the first 30 minutes of ACP. | ||
| EXHIBIT A-5. Top 20 Principal Diagnosis Codes during First 99498 Claim in 2016 | ||
|---|---|---|
| Rank | Diagnosis Description | Percent of Beneficiaries Where Diagnosis was Indicated |
| 1 | Encounter for palliative care | 5.17% |
| 2 | Other specified counseling | 4.49% |
| 3 | Encounter for general adult medical exam without abnormal findings | 4.27% |
| 4 | Unspecified dementia without behavioral disturbance | 2.70% |
| 5 | Alzheimer's disease, unspecified | 2.47% |
| 6 | Essential (primary) hypertension | 2.25% |
| 7 | Encounter for general adult medical exam with abnormal findings | 2.25% |
| 8 | Chronic obstructive pulmonary disease, unspecified | 1.57% |
| 9 | Pain, unspecified | 1.57% |
| 10 | Shortness of breath | 1.57% |
| 11 | Acute respiratory failure, unspecified with hypoxia or hypercapnia | 1.35% |
| 12 | Altered mental status, unspecified | 1.35% |
| 13 | Type 2 diabetes mellitus without complications | 1.35% |
| 14 | Sepsis, unspecified organism | 1.35% |
| 15 | Other malaise | 1.12% |
| 16 | Type 2 diabetes mellitus with hyperglycemia | 1.12% |
| 17 | Dyspnea, unspecified | 1.12% |
| 18 | Heart failure, unspecified | 1.12% |
| 19 | Weakness | 0.90% |
| 20 | Acute and chronic respiratory failure with hypoxia | 0.90% |
| SOURCE: RTI International analysis of Medicare Part B claims and enrollment data for the 5% random sample of Medicare FFS beneficiaries. NOTES: We restricted each year's sample to beneficiaries continuously enrolled and with at least one claim in Medicare FFS from 2015 through 2016/the month of death. We used the Agency for Healthcare Research and Quality Clinical Classification Software to classify ICD-9 and ICD-10 diagnosis codes into larger categories of diagnoses. 99497 is for the first 30 minutes of ACP. 99498 is for each additional 30 minutes of ACP and is used with 99497. | ||
| EXHIBIT A-6. Top 20 Principal Diagnosis Codes during First 99498 Claim in 2017 | ||
|---|---|---|
| Rank | Diagnosis Description | Percent of Beneficiaries Where Diagnosis was Indicated |
| 1 | Encounter for palliative care | 9.23% |
| 2 | Essential (primary) hypertension | 3.58% |
| 3 | Other specified counseling | 3.23% |
| 4 | Sepsis, unspecified organism | 2.60% |
| 5 | Encounter for general adult medical exam without abnormal findings | 2.24% |
| 6 | Dyspnea, unspecified | 1.88% |
| 7 | Heart failure, unspecified | 1.61% |
| 8 | Pain, unspecified | 1.52% |
| 9 | Acute respiratory failure with hypoxia | 1.43% |
| 10 | Other malaise | 1.43% |
| 11 | Type 2 diabetes mellitus without complications | 1.34% |
| 12 | Pneumonia, unspecified organism | 1.34% |
| 13 | Cerebral infarction, unspecified | 1.16% |
| 14 | Encounter for general adult medical exam with abnormal findings | 1.08% |
| 15 | Unspecified dementia without behavioral disturbance | 1.08% |
| 16 | Acute kidney failure, unspecified | 0.81% |
| 17 | Encephalopathy, unspecified | 0.81% |
| 18 | Unspecified atrial fibrillation | 0.81% |
| 19 | Metabolic encephalopathy | 0.81% |
| 20 | Parkinson's disease | 0.81% |
| SOURCE: RTI International analysis of Medicare Part B claims and enrollment data for the 5% random sample of Medicare FFS beneficiaries. NOTES: We restricted each year's sample to beneficiaries continuously enrolled and with at least one claim in Medicare FFS from 2016 through 2017/the month of death. We used the Agency for Healthcare Research and Quality Clinical Classification Software to classify ICD-9 and ICD-10 diagnosis codes into larger categories of diagnoses. 99497 is for the first 30 minutes of ACP. 99498 is for each additional 30 minutes of ACP and is used with 99497. | ||
| EXHIBIT A-7. Top 20 Principal Diagnosis Codes during First 99498 Claim in 2018 Quarters 1-3 | ||
|---|---|---|
| Rank | Diagnosis Description | Percent of Beneficiaries Where Diagnosis was Indicated |
| 1 | Encounter for palliative care | 9.57% |
| 2 | Essential (primary) hypertension | 4.70% |
| 3 | Encounter for general adult medical exam without abnormal findings | 3.33% |
| 4 | Other specified counseling | 3.33% |
| 5 | Sepsis, unspecified organism | 1.88% |
| 6 | Altered mental status, unspecified | 1.71% |
| 7 | Unspecified dementia without behavioral disturbance | 1.54% |
| 8 | Muscle weakness (generalized) | 1.45% |
| 9 | Pneumonia, unspecified organism | 1.37% |
| 10 | Acute respiratory failure with hypoxia | 1.37% |
| 11 | Other malaise | 1.37% |
| 12 | Pain, unspecified | 1.20% |
| 13 | Acute and chronic respiratory failure with hypoxia | 1.20% |
| 14 | Unspecified abnormalities of gait and mobility | 1.11% |
| 15 | Urinary tract infection, site not specified | 1.11% |
| 16 | Shortness of breath | 1.11% |
| 17 | Neoplasm related pain (acute) (chronic) | 1.03% |
| 18 | Adult failure to thrive | 1.03% |
| 19 | Atherosclerotic heart disease of native coronary artery without anginapectoris | 0.94% |
| 20 | Encephalopathy, unspecified | 0.94% |
| SOURCE: RTI International analysis of Medicare Part B claims and enrollment data for the 5% random sample of Medicare FFS beneficiaries. NOTES: We restricted each year's sample to beneficiaries continuously enrolled and with at least one claim in Medicare FFS from 2017 through 2018 Quarter 3/the month of death. We used the Agency for Healthcare Research and Quality Clinical Classification Software to classify ICD-9 and ICD-10 diagnosis codes into larger categories of diagnoses. 99497 is for the first 30 minutes of ACP. 99498 is for each additional 30 minutes of ACP and is used with 99497. | ||
| EXHIBIT A-8. Top 20 Principal Diagnosis Codes during First 99483/G0505 Claim in 2017 | ||
|---|---|---|
| Rank | Diagnosis Description | Percent of Beneficiaries Where Diagnosis was Indicated |
| 1 | Mild cognitive impairment, so stated | 11.09% |
| 2 | Other amnesia | 8.98% |
| 3 | Unspecified dementia without behavioral disturbance | 8.28% |
| 4 | Encounter for general adult medical exam without abnormal findings | 7.58% |
| 5 | Essential (primary) hypertension | 7.12% |
| 6 | Alzheimer's disease, unspecified | 6.42% |
| 7 | Alzheimer's disease with late onset | 5.37% |
| 8 | Vascular dementia without behavioral disturbance | 3.73% |
| 9 | Other symptoms and signs with cognitive functions and awareness | 2.33% |
| 10 | Type 2 diabetes mellitus without complications | 1.52% |
| 11 | Encounter for general adult medical exam with abnormal findings | 1.52% |
| 12 | Unspecified dementia with behavioral disturbance | 1.05% |
| 13 | Other Alzheimer's disease | 1.05% |
| 14 | Hypothyroidism, unspecified | 0.93% |
| 15 | Vascular dementia with behavioral disturbance | 0.93% |
| 16 | Dementia with Lewy bodies | 0.82% |
| 17 | Dementia in other diseases classified elsewhere without behavioral disturbance | 0.82% |
| 18 | Encounter for screening for other disorder | 0.82% |
| 19 | Parkinson's disease | 0.70% |
| 20 | Atherosclerotic heart disease of native coronary artery without angina pectoris | 0.70% |
| SOURCE: RTI International analysis of Medicare Part B claims and enrollment data for the 5% random sample of Medicare FFS beneficiaries. NOTES: We restricted each year's sample to beneficiaries continuously enrolled and with at least one claim in Medicare FFS from 2016 through 2017/the month of death. We used the Agency for Healthcare Research and Quality Clinical Classification Software to classify ICD-9 and ICD-10 diagnosis codes into larger categories of diagnoses. 99483/G0505 is for cognitive assessment and care planning for individuals with cognitive impairment. | ||
| EXHIBIT A-9. Top 20 Principal Diagnosis Codes during First 99483/G0505 Claim in 2018 Quarters 1-3 | ||
|---|---|---|
| Rank | Diagnosis Description | Percent of Beneficiaries Where Diagnosis was Indicated |
| 1 | Mild cognitive impairment, so stated | 12.18% |
| 2 | Unspecified dementia without behavioral disturbance | 10.57% |
| 3 | Alzheimer's disease, unspecified | 9.89% |
| 4 | Alzheimer's disease with late onset | 9.43% |
| 5 | Other amnesia | 8.51% |
| 6 | Vascular dementia without behavioral disturbance | 4.71% |
| 7 | Other symptoms and signs w cognitive functions and awareness | 4.14% |
| 8 | Essential (primary) hypertension | 2.99% |
| 9 | Unspecified dementia with behavioral disturbance | 2.76% |
| 10 | Encounter for general adult medical exam without abnormal findings | 2.76% |
| 11 | Vascular dementia with behavioral disturbance | 1.49% |
| 12 | Dementia with Lewy bodies | 1.49% |
| 13 | Other Alzheimer's disease | 1.38% |
| 14 | Dementia in other diseases classified elsewhere without behavioral disturbance | 1.15% |
| 15 | Alzheimer's disease with early onset | 1.15% |
| 16 | Parkinson's disease | 1.15% |
| 17 | Age-related cognitive decline | 0.80% |
| 18 | Dementia in other diseases classified elsewhere with behavioral disturbance | 0.80% |
| 19 | Retrograde amnesia | 0.69% |
| 20 | Chronic pain syndrome | 0.69% |
| SOURCE: RTI International analysis of Medicare Part B claims and enrollment data for the 5% random sample of Medicare FFS beneficiaries. NOTES: We restricted each year's sample to beneficiaries continuously enrolled and with at least one claim in Medicare FFS from 2017 through 2018 Quarter 3/the month of death. We used the Agency for Healthcare Research and Quality Clinical Classification Software to classify ICD-9 and ICD-10 diagnosis codes into larger categories of diagnoses. 99483/G0505 is for cognitive assessment and care planning for individuals with cognitive impairment. | ||
| EXHIBIT A-10. Top 20 Diagnosis Codes during the Year before the First ACP Claim in 2016 | ||||
|---|---|---|---|---|
| Rank | Diagnosis Description | Proportion of FFS Beneficiaries with Diagnosis during 2015 (non-ACP group) | Proportion of FFS Beneficiaries with Diagnosis during Year Before First 994971 Claim | Proportion of FFS Beneficiaries with Diagnosis during Year Before First 994981 Claim |
| 1 | Essential hypertension | 0.65 | 0.80 | 0.85 |
| 2 | Disorders of lipid metabolism | 0.59 | 0.75 | 0.65 |
| 3 | Immunizations and screening for infectious disease | 0.52 | 0.66 | 0.49 |
| 4 | Residual codes; unclassified | 0.45 | 0.60 | 0.80 |
| 5 | Other connective tissue disease | 0.41 | 0.52 | 0.68 |
| 6 | Other screening for suspected conditions (not mental disorders or infectious disease) | 0.40 | 0.64 | 0.59 |
| 7 | Other skin disorders | 0.36 | 0.46 | 0.52 |
| 8 | Cataract | 0.35 | 0.39 | 0.34 |
| 9 | Diabetes mellitus without complication | 0.34 | 0.44 | 0.49 |
| 10 | Medical examination/evaluation | 0.33 | 0.73 | 0.46 |
| 11 | Spondylosis; intervertebral disc disorders; other back problems | 0.33 | 0.40 | 0.41 |
| 12 | Other lower respiratory disease | 0.33 | 0.46 | 0.77 |
| 13 | Other aftercare | 0.32 | 0.45 | 0.67 |
| 14 | Other non-traumatic joint disorders | 0.32 | 0.37 | 0.48 |
| 15 | Other nervous system disorders | 0.28 | 0.41 | 0.71 |
| 16 | Other eye disorders | 0.26 | 0.31 | 0.27 |
| 17 | Osteoarthritis | 0.26 | 0.35 | 0.41 |
| 18 | Other nutritional; endocrine; and metabolic disorders | 0.25 | 0.42 | 0.56 |
| 19 | Thyroid disorders | 0.23 | 0.31 | 0.33 |
| 20 | Cardiac dysrhythmias | 0.23 | 0.33 | 0.54 |
| Average count of Clinical Classification Software categories per beneficiary | 17.12 | 24.72 | 35.83 | |
| SOURCE: RTI International analysis of Medicare Part B claims and enrollment data for the 5% random sample of Medicare FFS beneficiaries. NOTES: We restricted each year's sample to beneficiaries continuously enrolled and with at least one claim in Medicare FFS from 2015 through 2016/the month of death. We used the Agency for Healthcare Research and Quality Clinical Classification Software to classify ICD-9 and ICD-10 diagnosis codes into larger categories of diagnoses.
| ||||
| EXHIBIT A-11. Top 20 Diagnosis Codes during the Year before the First ACP Claim in 2017 | |||||
|---|---|---|---|---|---|
| Rank | Diagnosis Description | Proportion of FFS Beneficiaries with Diagnosis during 2016 (non-ACP group) | Proportion of FFS Beneficiaries with Diagnosis during Year Before First 994971 Claim | Proportion of FFS Beneficiaries with Diagnosis during Year Before First 994981 Claim | Proportion of FFS Beneficiaries with Diagnosis during Year Before First 99483/G05051 Claim |
| 1 | Essential hypertension | 0.65 | 0.80 | 0.87 | 0.81 |
| 2 | Disorders of lipid metabolism | 0.59 | 0.73 | 0.64 | 0.70 |
| 3 | Immunizations and screening for infectious disease | 0.52 | 0.63 | 0.47 | 0.60 |
| 4 | Other screening for suspected conditions (not mental disorders or infectious disease) | 0.51 | 0.70 | 0.70 | 0.63 |
| 5 | Residual codes; unclassified | 0.44 | 0.63 | 0.85 | 0.73 |
| 6 | Other connective tissue disease | 0.41 | 0.53 | 0.73 | 0.57 |
| 7 | Other skin disorders | 0.38 | 0.47 | 0.47 | 0.48 |
| 8 | Medical examination/evaluation | 0.36 | 0.73 | 0.41 | 0.56 |
| 9 | Cataract | 0.35 | 0.38 | 0.31 | 0.39 |
| 10 | Diabetes mellitus without complication | 0.35 | 0.45 | 0.51 | 0.42 |
| 11 | Other aftercare | 0.34 | 0.49 | 0.73 | 0.49 |
| 12 | Spondylosis; intervertebral disc disorders; other back problems | 0.34 | 0.41 | 0.45 | 0.43 |
| 13 | Other lower respiratory disease | 0.33 | 0.49 | 0.81 | 0.48 |
| 14 | Other nervous system disorders | 0.29 | 0.44 | 0.71 | 0.56 |
| 15 | Other non-traumatic joint disorders | 0.29 | 0.37 | 0.40 | 0.39 |
| 16 | Other nutritional; endocrine; and metabolic disorders | 0.28 | 0.46 | 0.55 | 0.45 |
| 17 | Osteoarthritis | 0.26 | 0.35 | 0.40 | 0.34 |
| 18 | Other eye disorders | 0.26 | 0.30 | 0.27 | 0.32 |
| 19 | Thyroid disorders | 0.23 | 0.31 | 0.33 | 0.33 |
| 20 | Cardiac dysrhythmias | 0.23 | 0.36 | 0.61 | 0.39 |
| Average count of Clinical Classification Software categories per beneficiary | 17.28 | 25.91 | 37.64 | 26.29 | |
| SOURCE: RTI International analysis of Medicare part B claims and enrollment data for the 5% random sample of Medicare FFS beneficiaries. NOTES: We restricted each year's sample to beneficiaries continuously enrolled and with at least one claim in Medicare FFS from 2016 through 2017/the month of death. We used the Agency for Healthcare Research and Quality Clinical Classification Software to classify ICD-9 and ICD-10 diagnosis codes into larger categories of diagnoses.
| |||||
| EXHIBIT A-12. Top 20 Diagnosis Codes during the Year before the First ACP Claim in 2018 Quarters 1-3 | |||||
|---|---|---|---|---|---|
| Rank | Diagnosis Description | Proportion of FFS Beneficiaries with Diagnosis during 2016 (non-ACP group) | Proportion of FFS Beneficiaries with Diagnosis during Year Before First 994971 Claim | Proportion of FFS Beneficiaries with Diagnosis during Year Before First 994981 Claim | Proportion of FFS Beneficiaries with Diagnosis during Year Before First 99483/G05051 Claim |
| 1 | Essential hypertension | 0.65 | 0.81 | 0.89 | 0.79 |
| 2 | Disorders of lipid metabolism | 0.60 | 0.74 | 0.67 | 0.69 |
| 3 | Other screening for suspected conditions (not mental disorders or infectious disease) | 0.54 | 0.71 | 0.69 | 0.61 |
| 4 | Immunizations and screening for infectious disease | 0.53 | 0.62 | 0.48 | 0.59 |
| 5 | Residual codes; unclassified | 0.46 | 0.66 | 0.86 | 0.76 |
| 6 | Other connective tissue disease | 0.41 | 0.55 | 0.73 | 0.59 |
| 7 | Medical examination/evaluation | 0.40 | 0.72 | 0.43 | 0.50 |
| 8 | Other skin disorders | 0.39 | 0.47 | 0.50 | 0.50 |
| 9 | Other aftercare | 0.36 | 0.51 | 0.77 | 0.51 |
| 10 | Cataract | 0.36 | 0.38 | 0.32 | 0.36 |
| 11 | Diabetes mellitus without complication | 0.35 | 0.46 | 0.50 | 0.45 |
| 12 | Other lower respiratory disease | 0.34 | 0.52 | 0.81 | 0.46 |
| 13 | Spondylosis; intervertebral disc disorders; other back problems | 0.34 | 0.42 | 0.44 | 0.42 |
| 14 | Other nutritional; endocrine; and metabolic disorders | 0.32 | 0.51 | 0.62 | 0.46 |
| 15 | Other nervous system disorders | 0.31 | 0.48 | 0.73 | 0.64 |
| 16 | Other non-traumatic joint disorders | 0.29 | 0.38 | 0.40 | 0.36 |
| 17 | Other eye disorders | 0.27 | 0.30 | 0.28 | 0.30 |
| 18 | Osteoarthritis | 0.27 | 0.36 | 0.39 | 0.39 |
| 19 | Cardiac dysrhythmias | 0.24 | 0.37 | 0.60 | 0.36 |
| 20 | Thyroid disorders | 0.23 | 0.33 | 0.38 | 0.32 |
| Average count of Clinical Classification Software categories per beneficiary | 17.87 | 26.99 | 38.60 | 26.63 | |
| SOURCE: RTI International analysis of Medicare Part B claims and enrollment data for the 5% random sample of Medicare FFS beneficiaries. NOTES: We restricted each year's sample to beneficiaries continuously enrolled and with at least one claim in Medicare FFS from 2017 through 2018 Quarter 3/the month of death. We used the Agency for Healthcare Research and Quality Clinical Classification Software to classify ICD-9 and ICD-10 diagnosis codes into larger categories of diagnoses.
| |||||
| EXHIBIT A-13. Characteristics of ACP Claims | ||||||||
|---|---|---|---|---|---|---|---|---|
| Characteristic | 2016 | 2017 | 2018 Quarters 1-3 | |||||
| Claims with 994971 (%) | Claims with 994981 (%) | Claims with 994971 (%) | Claims with 994981 (%) | Claims with 99483/G05051 (%) | Claims with 994971 (%) | Claims with 994981 (%) | Claims with 99483/G05051 (%) | |
| Total Claims | 29,074 | 527 | 50,386 | 1,389 | 986 | 46,120 | 1,417 | 1,037 |
| With 2 or more 99497 | 198 (0.7%) | --- | 359 (0.7%) | --- | --- | 234 (0.5%) | --- | --- |
| With 1 or more 99498 | 482 (1.7%) | --- | 1,315 (2.6%) | --- | --- | 1,359 (2.9%) | --- | --- |
| With 2 or more 99483/G0505 | --- | --- | --- | --- | 1 (0.1%) | --- | --- | 0 (0.0%) |
| Place of Service | ||||||||
| Office | 20,713 (71.2%) | 145 (27.5%) | 31,918 (63.3%) | 205 (14.8%) | 741 (75.2%) | 27,015 (58.6%) | 206 (14.5%) | 754 (72.7%) |
| Inpatient hospital | 2,519 (8.7%) | 237 (45.0%) | 6,771 (13.4%) | 662 (47.7%) | 22 (2.2%) | 7,294 (15.8%) | 674 (47.6%) | 10 (1.0%) |
| Skilled nursing facility | 1,570 (5.4%) | 34 (6.5%) | 3,916 (7.8%) | 178 (12.8%) | 30 (3.0%) | 4,565 (9.9%) | 208 (14.7%) | 12 (1.2%) |
| Other | 4,273 (14.7%) | 111 (21.1%) | 7,782 (15.4%) | 344 (24.8%) | 193 (19.6%) | 7,246 (15.7%) | 329 (23.2%) | 261 (25.2%) |
| Other Services Included on ACP Claim | ||||||||
| With any other service | 25,571 (88.0%) | 326 (61.9%) | 45,052 (89.4%) | 867 (62.4%) | 357 (36.2%) | 41,580 (90.2%) | 1,010 (71.3%) | 135 (13.0%) |
| Evaluation and Management service | 25,047 (86.1%) | 325 (61.7%) | 44,024 (87.4%) | 854 (61.5%) | 241 (24.4%) | 40,807 (88.5%) | 1,006 (71.0%) | 48 (4.6%) |
| Annual wellness visit | 13,483 (46.4%) | 45 (8.5%) | 23,090 (45.8%) | 72 (5.2%) | --- | 20,121 (43.6%) | 75 (5.3%) | --- |
| 99211 (office or other outpatient visit of an established patient; presenting problem(s) minimal, typically 5 minutes) | 7 (0.0%) | 1 (0.2%) | 8 (0.0%) | 0 (0.0%) | 1 (0.1%) | 6 (0.0%) | 0 (0.0%) | 0 (0.0%) |
| 99212 (presenting problem(s) self-limited or minor, typically 10 minutes) | 200 (0.7%) | 3 (0.6%) | 349 (0.7%) | 1 (0.1%) | 1 (0.1%) | 309 (0.7%) | 1 (0.1%) | 0 (0.0%) |
| 99213 (presenting problem(s) of low to moderate severity, typically 15 minutes) | 3,536 (12.2%) | 15 (2.8%) | 5,389 (10.7%) | 40 (2.9%) | 29 (2.9%) | 4,575 (9.9%) | 34 (2.4%) | 0 (0.0%) |
| 99214 (requires 2 of detailed history, detailed examination, or medical decision making of moderate complexity; presenting problem(s) of moderate to high severity, typically 25 minutes) | 7,101 (24.4%) | 28 (5.3%) | 9,995 (19.8%) | 31 (2.2%) | 45 (4.6%) | 8,328 (18.1%) | 51 (3.6%) | 3 (0.3%) |
| 99215 (requires 2 of comprehensive history, comprehensive examination, or medical decision making of high complexity; presenting problem(s) of moderate to high severity, typically 40 minutes) | 1,219 (4.2%) | 14 (2.7%) | 1,673 (3.3%) | 30 (2.2%) | 12 (1.2%) | 1,352 (2.9%) | 33 (2.3%) | 0 (0.0%) |
| Procedure | 928 (3.2%) | 7 (1.3%) | 1,358 (2.7%) | 6 (0.4%) | 21 (2.1%) | 1,071 (2.3%) | 9 (0.6%) | 17 (1.6%) |
| Imaging | 593 (2.0%) | 0 (0.0%) | 837 (1.7%) | 6 (0.4%) | 7 (0.7%) | 514 (1.1%) | 5 (0.4%) | 0 (0.0%) |
| Tests | 5,373 (18.5%) | 20 (3.8%) | 8,723 (17.3%) | 41 (3.0%) | 123 (12.5%) | 7,218 (15.7%) | 38 (2.7%) | 62 (6.0%) |
| Durable Medical Equipment | 5 (0.0%) | 0 (0.0%) | 10 (0.0%) | 0 (0.0%) | 0 (0.0%) | 2 (0.0%) | 0 (0.0%) | 0 (0.0%) |
| Other | 3,436 (11.8%) | 8 (1.5%) | 4,527 (9.0%) | 8 (0.6%) | 37 (3.8%) | 2,504 (5.4%) | 9 (0.6%) | 10 (1.0%) |
| Exceptions/unclassified | 2,975 (10.2%) | 5 (0.9%) | 7,213 (14.3%) | 16 (1.2%) | 123 (12.5%) | 7,225 (15.7%) | 33 (2.3%) | 46 (4.4%) |
| Payments and Charges of ACP Service and Claim | ||||||||
| Amount Medicare paid to practitioner for the ACP service (sd) | $69 ($15.2) | $57 ($16.1) | $65 ($16.8) | $58 ($15.8) | $168 ($37.1) | $67 ($18.3) | $60 ($22.4) | $164 ($44.4) |
| Allowed charges for the ACP service (sd) | $83 ($7.9) | $73 ($19.5) | $79 ($7.6) | $74 ($19.3) | $221 ($35.3) | $82 ($8.3) | $77 ($28.2) | $225 ($31.0) |
| Total amount Medicare paid to practitioners for the ACP service during calendar year | $2,018,842 | $30,640 | $3,315,770 | $81,903 | $165,632 | $3,091,416 | $86,072 | $169,578 |
| Total allowed charges during calendar year (includes Medicare and beneficiary payments) | $2,436,064 | $38,926 | $4,043,707 | $104,806 | $218,173 | $3,797,852 | $110,319 | $233,644 |
| Amount Medicare paid to provider for the entire claim (including the ACP service) (sd) | $208.4 ($114.8) | $208.8 ($121.1) | $205.3 ($114.1) | $206.3 ($115.5) | $225.0 ($120.2) | $205.0 ($112.2) | $216.0 ($113.0) | $177.0 ($74.5) |
| Allowed charges for the entire claim (sd) | $247.3 ($127.6) | $264.7 ($149.0) | $247.2 ($128.6) | $263.6 ($144.6) | $290.1 ($143.6) | $249.9 ($128.0) | $276.4 ($137.9) | $241.6 ($80.3) |
| SOURCE: RTI International analysis of Medicare Part B claims and enrollment data for the 5% random sample of Medicare FFS beneficiaries. NOTES: We restricted each year's sample to claims for beneficiaries continuously enrolled in Medicare FFS throughout the year or until the month of death.
| ||||||||
| EXHIBIT A-14a. Practitioner Characteristics: 2016 | |||||
|---|---|---|---|---|---|
| Characteristics | No ACP Billed | 994971 Billed | Difference Between No ACP and 99497 Billed | 994981 Billed | Difference Between No ACP and 99498 Billed |
| Total Practitioners | 947,091 | 7,989 | --- | 358 | --- |
| Percent providing service | 99.16 | 0.84 | --- | 0.04 | --- |
| Male, % | 57 | 56 | -2*** | 42 | -16*** |
| Female, % | 43 | 44 | 2*** | 58 | 16*** |
| Practitioner is a sole proprietor, % | 20 | 23 | 3*** | 20 | 0 |
| Practitioner is not a sole proprietor, % | 77 | 74 | -3*** | 79 | 2 |
| Practitioner did not answer regarding being a sole proprietor, % | 3 | 2 | -1*** | 1 | -2* |
| Primary care practitioner, % | 36 | 92 | 56*** | 81 | 45*** |
| Palliative care practitioner, % | 0.1 | 1 | 1*** | 7 | 7*** |
| Other practitioner, % | 64 | 6 | -58*** | 12 | -52*** |
| Physician, % | 61 | 81 | 19*** | 64 | 2 |
| Non-physician practitioner, % | 39 | 19 | -19*** | 36 | -2 |
| Characteristics from Medicare's Physician Compare Database | |||||
| Practitioner is in Physician Compare database, %2 | 84 | 89 | 6*** | 85 | 2 |
| Hospital affiliated practitioner, % | 71 | 90 | 19*** | 87 | 16*** |
| Practice size, avg | 367 | 193 | -174*** | 399 | 32 |
| Years since medical school graduation | 21.65 | 23.08 | 1.43*** | 19.54 | -2.11** |
| Practice Type | |||||
| Practice with only primary care practitioner, % | 4 | 23 | 19*** | 14 | 10*** |
| Practice with only palliative care practitioners, % | 0.1 | 0.1 | 0 | 0.1 | 0 |
| Practice with only specialists, % | 18 | 1 | -17*** | 1 | -17*** |
| Practice with primary care and palliative care practitioners, % | 0.1 | 0.1 | 0 | 2 | 2*** |
| Practice with primary care and specialist practitioners, % | 41 | 42 | 1 | 38 | -2 |
| Practice with palliative care and specialist practitioners, % | 0.1 | 0.1 | 0 | 0.1 | 0 |
| Practice with palliative care, primary care, and specialist practitioners, % | 37 | 34 | -3*** | 45 | 8** |
| SOURCE: RTI International analysis of Medicare Part B claims and enrollment data for the 5% random sample of Medicare FFS beneficiaries. NOTES: ** p 0.01, *** p 0.001. We restricted the sample to practitioners with individual National Provider Identifiers who submitted Medicare claims for the 5% random sample of Medicare FFS beneficiaries.
| |||||
| EXHIBIT A-14b. Practitioner Characteristics: 2017 | |||||||
|---|---|---|---|---|---|---|---|
| Characteristics | No ACP Billed | 994971 Billed | Difference Between No ACP and 99497 Billed | 994981 Billed | Difference Between No ACP and 99498 Billed | 99483/ G05051 Billed | Difference Between No ACP and 99483/G0505 Billed |
| Total Practitioners | 977,405 | 12,905 | --- | 714 | --- | 375 | --- |
| Percent providing service | 98.67 | 1.30 | --- | 0.07 | --- | 0.04 | --- |
| Male, % | 56 | 53 | -4*** | 36 | -20*** | 57 | 1 |
| Female, % | 44 | 47 | 4*** | 64 | 20*** | 43 | -1 |
| Practitioner is a sole proprietor, % | 20 | 24 | 3*** | 20 | 8*** | 29 | 8*** |
| Practitioner is not a sole proprietor, % | 77 | 74 | -2*** | 79 | -7*** | 70 | -7*** |
| Practitioner did not answer regarding being a sole proprietor, % | 3 | 2 | -1*** | 1 | -1 | 1 | -1 |
| Primary care practitioner, % | 36 | 92 | 55*** | 83 | 47*** | 73 | 37*** |
| Palliative care practitioner, % | 0.1 | 1 | 1*** | 7 | 7*** | 0.1 | 0 |
| Other practitioner, % | 64 | 7 | -57*** | 10 | -54*** | 26 | -37*** |
| Physician, % | 60 | 77 | 17*** | 58 | -2 | 84 | 24*** |
| Non-physician practitioner, % | 40 | 23 | -17*** | 42 | 2 | 16 | -24*** |
| Characteristics from Medicare's Physician Compare Database | |||||||
| Practitioner is in Physician Compare database, %2 | 87 | 91 | 4*** | 84 | -3* | 97 | 10*** |
| Hospital affiliated practitioner, % | 70 | 88 | 18*** | 88 | 18*** | 86 | 16*** |
| Practice size, avg | 372 | 203 | -170*** | 394 | 22 | 191 | -181*** |
| Years since medical school graduation | 20.60 | 21.29 | 0.69*** | 16.72 | -3.87*** | 23.92 | 3.33*** |
| Practice Type | |||||||
| Practice with only primary care practitioner, % | 4 | 23 | 19*** | 9 | 5*** | 21 | 17*** |
| Practice with only palliative care practitioners, % | 0.1 | 0.1 | 0 | 0.1 | 0 | 0.1 | 0 |
| Practice with only specialists, % | 18 | 1 | -17*** | 1 | -18*** | 4 | -15*** |
| Practice with primary care and palliative care practitioners, % | 0.1 | 0.1 | 0*** | 4 | 3*** | 0.1 | 0 |
| Practice with primary care and specialist practitioners, % | 41 | 42 | 1 | 35 | -6** | 29 | -13*** |
| Practice with palliative care and specialist practitioners, % | 0.1 | 0.1 | 0 | 0.1 | 0 | 0.1 | 0 |
| Practice with palliative care, primary care, and specialist practitioners, % | 36 | 34 | -3*** | 52 | 16*** | 47 | 11*** |
| SOURCE: RTI International analysis of Medicare Part B claims and enrollment data for the 5% random sample of Medicare FFS beneficiaries. NOTES: ** p 0.01, *** p 0.001. We restricted the sample to practitioners with individual National Provider Identifiers who submitted Medicare claims for the 5% random sample of Medicare FFS beneficiaries.
| |||||||
| EXHIBIT A-14c. Practitioner Characteristics: 2018 Quarters 1-3 | |||||||
|---|---|---|---|---|---|---|---|
| Characteristics | No ACP Billed | 994971 Billed | Difference Between No ACP and 99497 Billed | 994981 Billed | Difference Between No ACP and 99498 Billed | 99483/ G05051 Billed | Difference Between No ACP and 99483/G0505 Billed |
| Total Practitioners | 958,872 | 13,846 | --- | 728 | --- | 432 | --- |
| Percent providing service | 98.55 | 1.42 | --- | 0.07 | --- | 0.04 | --- |
| Male, % | 56 | 52 | -3*** | 34 | -22*** | 56 | 0 |
| Female, % | 44 | 48 | 3*** | 66 | 22*** | 44 | 0 |
| Practitioner is a sole proprietor, % | 20 | 24 | 4*** | 20 | 0 | 28 | 8*** |
| Practitioner is not a sole proprietor, % | 77 | 74 | -3*** | 78 | 1 | 72 | -6** |
| Practitioner did not answer regarding being a sole proprietor, % | 3 | 2 | -1*** | 1 | -1* | 0.1 | 0*** |
| Primary care practitioner, % | 37 | 92 | 55*** | 83 | 46*** | 62 | 25*** |
| Palliative care practitioner, % | 0.1 | 1 | 1*** | 9 | 9*** | 0.1 | 0 |
| Other practitioner, % | 63 | 7 | -56*** | 8 | -55*** | 38 | -25*** |
| Physician, % | 60 | 75 | 16*** | 55 | -4* | 81 | 22*** |
| Non-physician practitioner, % | 40 | 25 | -16*** | 45 | 4* | 19 | -22*** |
| Characteristics from Medicare's Physician Compare Database | |||||||
| Practitioner is in Physician Compare database, %2 | 90 | 92 | 2*** | 87 | -2* | 97 | 8*** |
| Hospital affiliated practitioner, % | 70 | 87 | 17*** | 87 | 17*** | 79 | 9*** |
| Practice size, avg | 367 | 204 | -163*** | 433 | 65* | 214 | -154 |
| Years since medical school graduation | 20.08 | 20.41 | 0.33** | 15.63 | -4.45*** | 21 | 1.34* |
| Practice type | |||||||
| Practice with only primary care practitioner, % | 4 | 23 | 19*** | 10 | 6*** | 19 | 15*** |
| Practice with only palliative care practitioners, % | 0.1 | 0.1 | 0 | 0.1 | 0 | 0.1 | 0 |
| Practice with only specialists, % | 18 | 1 | -18*** | 0.1 | -18*** | 5 | -13*** |
| Practice with primary care and palliative care practitioners, % | 0.1 | 0.1 | 0*** | 4 | 4*** | 0.1 | 0 |
| Practice with primary care and specialist practitioners, % | 42 | 42 | 1 | 32 | -10*** | 36 | -6* |
| Practice with palliative care and specialist practitioners, % | 0.1 | 0.1 | 0 | 0.1 | 0 | 0.1 | 0 |
| Practice with palliative care, primary care, and specialist practitioners, % | 36 | 33 | -3*** | 55 | 19*** | 40 | 4 |
| SOURCE: RTI International analysis of Medicare Part B claims and enrollment data for the 5% random sample of Medicare FFS beneficiaries. NOTES: ** p 0.01, *** p 0.001. We restricted the sample to practitioners with individual National Provider Identifiers who submitted Medicare claims for the 5% random sample of Medicare FFS beneficiaries.
| |||||||
| EXHIBIT A-15. Top Ten Practitioner Specialties Billing 99497 in 2016 | |||
|---|---|---|---|
| Rank | Specialty | Proportion of Total Practitioners | Proportion of Practitioners within the Specialty |
| 1 | Physician/Internal Medicine | 0.41 | 0.03 |
| 2 | Physician/Family Practice | 0.29 | 0.03 |
| 3 | Nurse Practitioner | 0.16 | 0.01 |
| 4 | Physician Assistant | 0.03 | 0.00 |
| 5 | Physician/Geriatric Medicine | 0.02 | 0.10 |
| 6 | Physician/Hospice and Palliative Care | 0.01 | 0.14 |
| 7 | Physician/Hematology-Oncology | 0.01 | 0.01 |
| 8 | Physician/Pulmonary Disease | 0.01 | 0.01 |
| 9 | Physician/Cardiovascular Disease (Cardiology) | 0.01 | 0.00 |
| 10 | Physician/Emergency Medicine | 0.01 | 0.00 |
| SOURCE: RTI International analysis of Medicare Part B claims and enrollment data for the 5% random sample of Medicare FFS beneficiaries. NOTES: We restricted the sample to practitioners with individual National Provider Identifiers who submitted Medicare claims for the 5% random sample of Medicare FFS beneficiaries. 99497 is for the first 30 minutes of ACP. | |||
| EXHIBIT A-16. Top Ten Practitioner Specialties Billing 99497 in 2017 | |||
|---|---|---|---|
| Rank | Specialty | Proportion of Total Practitioners | Proportion of Practitioners within the Specialty |
| 1 | Physician/Internal Medicine | 0.39 | 0.05 |
| 2 | Physician/Family Practice | 0.26 | 0.04 |
| 3 | Nurse Practitioner | 0.19 | 0.02 |
| 4 | Physician Assistant | 0.04 | 0.01 |
| 5 | Physician/Geriatric Medicine | 0.02 | 0.13 |
| 6 | Physician/Emergency Medicine | 0.01 | 0.00 |
| 7 | Physician/General Practice | 0.01 | 0.02 |
| 8 | Physician/Hematology-Oncology | 0.01 | 0.02 |
| 9 | Physician/Hospice and Palliative Care | 0.01 | 0.19 |
| 10 | Physician/Nephrology | 0.01 | 0.01 |
| SOURCE: RTI International analysis of Medicare Part B claims and enrollment data for the 5% random sample of Medicare FFS beneficiaries. NOTES: We restricted the sample to practitioners with individual National Provider Identifiers who submitted Medicare claims for the 5% random sample of Medicare FFS beneficiaries. 99497 is for the first 30 minutes of ACP. | |||
| EXHIBIT A-17. Top Ten Practitioner Specialties Billing 99497 in 2018 Quarters 1-3 | |||
|---|---|---|---|
| Rank | Specialty | Proportion of Total Practitioners | Proportion of Practitioners within the Specialty |
| 1 | Physician/Internal Medicine | 0.39 | 0.05 |
| 2 | Physician/Family Practice | 0.26 | 0.04 |
| 3 | Nurse Practitioner | 0.21 | 0.03 |
| 4 | Physician Assistant | 0.04 | 0.01 |
| 5 | Physician/Geriatric Medicine | 0.02 | 0.13 |
| 6 | Physician/Cardiovascular Disease (Cardiology) | 0.01 | 0.00 |
| 7 | Physician/Emergency Medicine | 0.01 | 0.00 |
| 8 | Physician/General Practice | 0.01 | 0.03 |
| 9 | Physician/Hematology-Oncology | 0.01 | 0.01 |
| 10 | Physician/Hospice and Palliative Care | 0.01 | 0.21 |
| SOURCE: RTI International analysis of Medicare Part B claims and enrollment data for the 5% random sample of Medicare FFS beneficiaries. NOTES: We restricted the sample to practitioners with individual National Provider Identifiers who submitted Medicare claims for the 5% random sample of Medicare FFS beneficiaries. 99497 is for the first 30 minutes of ACP. | |||
| EXHIBIT A-18. Top Ten Practitioner Specialties Billing 99498 in 2016 | |||
|---|---|---|---|
| Rank | Specialty | Proportion of Total Practitioners | Proportion of Practitioners within the Specialty |
| 1 | Nurse Practitioner | 0.32 | 0.00 |
| 2 | Physician/Internal Medicine | 0.28 | 0.00 |
| 3 | Physician/Family Practice | 0.13 | 0.00 |
| 4 | Physician/Hospice and Palliative Care | 0.07 | 0.03 |
| 5 | Physician/Geriatric Medicine | 0.04 | 0.01 |
| 6 | Physician Assistant | 0.02 | 0.00 |
| 7 | Physician/Hematology-Oncology | 0.02 | 0.00 |
| 8 | Physician/Pulmonary Disease | 0.02 | 0.00 |
| 9 | Physician/Medical Oncology | 0.02 | 0.00 |
| 10 | Physician/Cardiovascular Disease (Cardiology) | 0.01 | 0.00 |
| SOURCE: RTI International analysis of Medicare Part B claims and enrollment data for the 5% random sample of Medicare FFS beneficiaries. NOTES: We restricted the sample to practitioners with individual National Provider Identifiers who submitted Medicare claims for the 5% random sample of Medicare FFS beneficiaries. 99497 is for the first 30 minutes of ACP. 99498 is for each additional 30 minutes of ACP and is used with 99497. | |||
| EXHIBIT A-19. Top Ten Practitioner Specialties Billing 99498 in 2017 | |||
|---|---|---|---|
| Rank | Specialty | Proportion of Total Practitioners | Proportion of Practitioners within the Specialty |
| 1 | Nurse Practitioner | 0.37 | 0.00 |
| 2 | Physician/Internal Medicine | 0.26 | 0.00 |
| 3 | Physician/Family Practice | 0.11 | 0.00 |
| 4 | Physician/Hospice and Palliative Care | 0.07 | 0.06 |
| 5 | Physician Assistant | 0.03 | 0.00 |
| 6 | Physician/Geriatric Medicine | 0.03 | 0.01 |
| 7 | Physician/Emergency Medicine | 0.02 | 0.00 |
| 8 | Physician/Hematology-Oncology | 0.02 | 0.00 |
| 9 | Certified Clinical Nurse Specialist | 0.02 | 0.01 |
| 10 | Physician/General Practice | 0.01 | 0.00 |
| SOURCE: RTI International analysis of Medicare Part B claims and enrollment data for the 5% random sample of Medicare FFS beneficiaries. NOTES: We restricted the sample to practitioners with individual National Provider Identifiers who submitted Medicare claims for the 5% random sample of Medicare FFS beneficiaries. 99497 is for the first 30 minutes of ACP. 99498 is for each additional 30 minutes of ACP and is used with 99497. | |||
| EXHIBIT A-20. Top Ten Practitioner Specialties Billing 99498 in 2018 Quarters 1-3 | |||
|---|---|---|---|
| Rank | Specialty | Proportion of Total Practitioners | Proportion of Practitioners within the Specialty |
| 1 | Nurse Practitioner | 0.41 | 0.00 |
| 2 | Physician/Internal Medicine | 0.23 | 0.00 |
| 3 | Physician/Family Practice | 0.12 | 0.00 |
| 4 | Physician/Hospice and Palliative Care | 0.09 | 0.07 |
| 5 | Physician/Geriatric Medicine | 0.03 | 0.01 |
| 6 | Physician Assistant | 0.02 | 0.00 |
| 7 | Physician/Emergency Medicine | 0.01 | 0.00 |
| 8 | Physician/General Practice | 0.01 | 0.00 |
| 9 | Physician/Hematology-Oncology | 0.01 | 0.00 |
| 10 | Physician/Pulmonary Disease | 0.01 | 0.00 |
| SOURCE: RTI International analysis of Medicare Part B claims and enrollment data for the 5% random sample of Medicare FFS beneficiaries. NOTES: We restricted the sample to practitioners with individual National Provider Identifiers who submitted Medicare claims for the 5% random sample of Medicare FFS beneficiaries. 99497 is for the first 30 minutes of ACP. 99498 is for each additional 30 minutes of ACP and is used with 99497. | |||
| EXHIBIT A-21. Top Ten Practitioner Specialties Billing 99483/G0505 in 2017 | |||
|---|---|---|---|
| Rank | Specialty | Proportion of Total Practitioners | Proportion of Practitioners within the Specialty |
| 1 | Physician/Internal Medicine | 0.30 | 0.00 |
| 2 | Physician/Neurology | 0.21 | 0.01 |
| 3 | Physician/Family Practice | 0.19 | 0.00 |
| 4 | Nurse Practitioner | 0.12 | 0.00 |
| 5 | Physician/Geriatric Medicine | 0.08 | 0.02 |
| 6 | Physician Assistant | 0.04 | 0.00 |
| 7 | Physician/Psychiatry | 0.02 | 0.00 |
| 8 | Physician/Emergency Medicine | 0.01 | 0.00 |
| 9 | Physician/Nephrology | 0.01 | 0.00 |
| 10 | Physician/Cardiovascular Disease (Cardiology) | 0.01 | 0.00 |
| SOURCE: RTI International analysis of Medicare Part B claims and enrollment data for the 5% random sample of Medicare FFS beneficiaries. NOTES: We restricted the sample to practitioners with individual National Provider Identifiers who submitted Medicare claims for the 5% random sample of Medicare FFS beneficiaries. 99483/G0505 is for cognitive assessment and ACP for individuals with cognitive impairment. | |||
| EXHIBIT A-22. Top Ten Practitioner Specialties Billing 99483/G0505 in 2018 Quarters 1-3 | |||
|---|---|---|---|
| Rank | Specialty | Proportion of Total Practitioners | Proportion of Practitioners within the Specialty |
| 1 | Physician/Neurology | 0.28 | 0.01 |
| 2 | Physician/Internal Medicine | 0.22 | 0.00 |
| 3 | Nurse Practitioner | 0.15 | 0.00 |
| 4 | Physician/Family Practice | 0.15 | 0.00 |
| 5 | Physician/Geriatric Medicine | 0.06 | 0.01 |
| 6 | Physician Assistant | 0.04 | 0.00 |
| 7 | Physician/Psychiatry | 0.04 | 0.00 |
| 8 | Physician/Hematology-Oncology | 0.01 | 0.00 |
| 9 | Physician/Cardiovascular Disease (Cardiology) | 0.01 | 0.00 |
| 10 | Physician/General Surgery | 0.01 | 0.00 |
| SOURCE: RTI International analysis of Medicare Part B claims and enrollment data for the 5% random sample of Medicare FFS beneficiaries. NOTES: We restricted the sample to practitioners with individual National Provider Identifiers who submitted Medicare claims for the 5% random sample of Medicare FFS beneficiaries. 99483/G0505 is for cognitive assessment and ACP for individuals with cognitive impairment. | |||
| EXHIBIT A-23. Top Ten Practitioner Specialties Not Billing ACP in 2016 | ||
|---|---|---|
| Rank | Specialty | Proportion of Total Non-ACP Practitioners |
| 1 | Nurse Practitioner | 0.10 |
| 2 | Physician/Internal Medicine | 0.10 |
| 3 | Physician/Family Practice | 0.08 |
| 4 | Physician Assistant | 0.07 |
| 5 | Physical Therapist in Private Practice | 0.05 |
| 6 | Physician/Emergency Medicine | 0.04 |
| 7 | Certified Registered Nurse Anesthetist (CRNA) | 0.04 |
| 8 | Physician/Anesthesiology | 0.04 |
| 9 | Chiropractic | 0.03 |
| 10 | Optometry | 0.03 |
| SOURCE: RTI International analysis of Medicare Part B claims and enrollment data for the 5% random sample of Medicare FFS beneficiaries. NOTE: We restricted the sample to practitioners with individual National Provider Identifiers who submitted Medicare claims for the 5% random sample of Medicare FFS beneficiaries. | ||
| EXHIBIT A-24. Top Ten Practitioner Specialties Not Billing ACP in 2017 | ||
|---|---|---|
| Rank | Specialty | Proportion of Total Non-ACP Practitioners |
| 1 | Nurse Practitioner | 0.11 |
| 2 | Physician/Internal Medicine | 0.10 |
| 3 | Physician/Family Practice | 0.08 |
| 4 | Physician Assistant | 0.07 |
| 5 | Physical Therapist in Private Practice | 0.05 |
| 6 | Physician/Emergency Medicine | 0.04 |
| 7 | Certified Registered Nurse Anesthetist (CRNA) | 0.04 |
| 8 | Physician/Anesthesiology | 0.04 |
| 9 | Chiropractic | 0.03 |
| 10 | Optometry | 0.03 |
| SOURCE: RTI International analysis of Medicare Part B claims and enrollment data for the 5% random sample of Medicare FFS beneficiaries. NOTE: We restricted the sample to practitioners with individual National Provider Identifiers who submitted Medicare claims for the 5% random sample of Medicare FFS beneficiaries. | ||
| EXHIBIT A-25. Top Ten Practitioner Specialties Not Billing ACP in 2018 Quarters 1-3 | ||
|---|---|---|
| Rank | Specialty | Proportion of Total Non-ACP Practitioners |
| 1 | Nurse Practitioner | 0.11 |
| 2 | Physician/Internal Medicine | 0.10 |
| 3 | Physician/Family Practice | 0.08 |
| 4 | Physician Assistant | 0.07 |
| 5 | Physician/Emergency Medicine | 0.05 |
| 6 | Physical Therapist in Private Practice | 0.05 |
| 7 | Certified Registered Nurse Anesthetist (CRNA) | 0.04 |
| 8 | Physician/Anesthesiology | 0.04 |
| 9 | Chiropractic | 0.03 |
| 10 | Optometry | 0.03 |
| SOURCE: RTI International analysis of Medicare Part B claims and enrollment data for the 5% random sample of Medicare FFS beneficiaries. NOTE: We restricted the sample to practitioners with individual National Provider Identifiers who submitted Medicare claims for the 5% random sample of Medicare FFS beneficiaries. | ||
| EXHIBIT A-26a. Heat Map Indicating Percentage of Practitioners Billing ACP in 2016 (99497/99498 or 99483/G0505) | ||
|---|---|---|
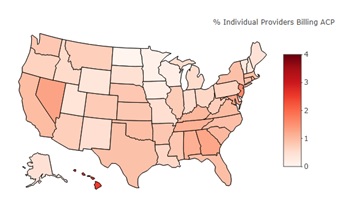 | Highest Percentage States | |
| State | Percentage of Medicare FFS Practitioners Billing ACP | |
| Hawaii | 2.50 | |
| New Jersey | 1.62 | |
| Nevada | 1.30 | |
| Maryland | 1.27 | |
| George | 1.26 | |
| Lowest Percentage States | ||
| State | Percentage of Medicare FFS Practitioners Billing ACP | |
| North Dakota | 0.03 | |
| Minnesota | 0.10 | |
| Wisconsin | 0.17 | |
| Iowa | 0.21 | |
| New Hampshire | 0.34 | |
| SOURCE: RTI International analysis of Medicare Part B claims and enrollment data for the 5% random sample of Medicare FFS beneficiaries. NOTES: We restricted the sample to practitioners with individual National Provider Identifiers who submitted Medicare claims for the 5% random sample of Medicare FFS beneficiaries. To define billed ACP claim, we included billing codes 99497 for the first 30 minutes of ACP, 99498 for each additional 30 minutes of ACP, and 99483/G0505 for cognitive assessment and ACP for individuals with cognitive impairment. | ||
| EXHIBIT A-26b. Heat Map Indicating Percentage of Practitioners Billing ACP in 2017 (99497/99498 or 99483/G0505) | ||
|---|---|---|
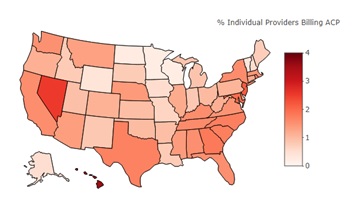 | Highest Percentage States | |
| State | Percentage of Medicare FFS Practitioners Billing ACP | |
| Hawaii | 3.56 | |
| Nevada | 2.53 | |
| New Jersey | 2.19 | |
| Maryland | 1.96 | |
| Georgia | 1.81 | |
| Lowest Percentage States | ||
| State | Percentage of Medicare FFS Practitioners Billing ACP | |
| Wisconsin | 0.19 | |
| Minnesota | 0.21 | |
| North Dakota | 0.25 | |
| Vermont | 0.37 | |
| Wyoming | 0.40 | |
| SOURCE: RTI International analysis of Medicare Part B claims and enrollment data for the 5% random sample of Medicare FFS beneficiaries. NOTES: We restricted the sample to practitioners with individual National Provider Identifiers who submitted Medicare claims for the 5% random sample of Medicare FFS beneficiaries. To define billed ACP claim, we included billing codes 99497 for the first 30 minutes of ACP, 99498 for each additional 30 minutes of ACP, and 99483/G0505 for cognitive assessment and ACP for individuals with cognitive impairment. | ||
| EXHIBIT A-26c. Heat Map Indicating Percentage of Practitioners Billing ACP in 2018 Quarters 1-3 (99497/99498 or 99483/G0505) | ||
|---|---|---|
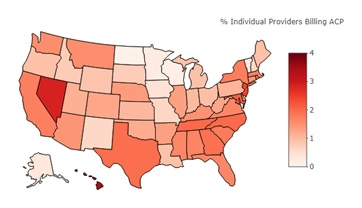 | Highest Percentage States | |
| State | Percentage of Medicare FFS Practitioners Billing ACP | |
| Hawaii | 3.48 | |
| Nevada | 2.87 | |
| New Jersey | 2.43 | |
| Maryland | 2.14 | |
| Tennessee | 2.01 | |
| Lowest Percentage States | ||
| State | Percentage of Medicare FFS Practitioners Billing ACP | |
| North Dakota | 0.12 | |
| Wisconsin | 0.16 | |
| Minnesota | 0.25 | |
| Vermont | 0.31 | |
| Alaska | 0.34 | |
| SOURCE: RTI International analysis of Medicare Part B claims and enrollment data for the 5% random sample of Medicare FFS beneficiaries. NOTES: We restricted the sample to practitioners with individual National Provider Identifiers who submitted Medicare claims for the 5% random sample of Medicare FFS beneficiaries. To define billed ACP claim, we included billing codes 99497 for the first 30 minutes of ACP, 99498 for each additional 30 minutes of ACP, and 99483/G0505 for cognitive assessment and ACP for individuals with cognitive impairment. | ||
| EXHIBIT A-27. Search Terms | |
|---|---|
| Peer-Reviewed Literature | Grey Literature |
2014-present
| 2014-present
|
Databases:
| Payers:
|
Search Terms:
| Provider Organizations:
|
NOTES
-
An AD is a document that appoints an agent and/or records the person's wishes about their medical treatment based on personal values and preferences, to be used at a future time if the individual is unable to speak for themselves (CMS, 2019c).
-
In Sudore et al. (2017), a multidisciplinary Delphi panel consisting of 52 clinicians, researchers, and policy leaders from four countries and a patient/surrogate advisory committee developed this final consensus definition of ACP.
-
The Institute of Medicine is now the National Academy of Medicine.
-
Throughout this report, the term "practitioners" will be used to refer to physicians and other qualified health care professionals.
-
According to a Relative Value Scale Update Committee (RUC) advisor to the AMA, the AMA used their standard RUC methodology to assign relative value units, used to determine payment, for these codes. This methodology is based on a structured process that involves a survey of medical society members on the timing and intensity of these services and whether there are similar services that can be used as reference points for the valuation of the codes.
-
According to a RUC advisor to the AMA, ACP codes cannot be billed alongside critical care codes (99291 and 99292). The AMA does not allow practitioners to bill separately for a service that is included in another service. ACP may be included in critical care services, so it would not be appropriate to bill for both ACP and critical care in the same visit.
-
These billing codes require nine other elements: cognition-focused evaluation including a pertinent history and examination, medical decision making of moderate or high complexity, functional assessment (e.g., basic and instrumental activities of daily living), including decision-making capacity, use of standardized instruments for staging of dementia (e.g., functional assessment staging test, clinical dementia rating), medication reconciliation and review for high-risk medications, evaluation of neuropsychiatric and behavioral symptoms, including depression, including use of standardized screening instrument(s), evaluation of safety (e.g., home), including motor vehicle operation, identification of caregiver(s), caregiver knowledge, caregiver needs, social supports, and the willingness of caregiver to take on caregiving tasks, and creation of a written care plan, including initial plans to address any neuropsychiatric symptoms, neurocognitive symptoms, functional limitations, and referral to community resources as needed (e.g., rehabilitation services, adult day programs, support groups) shared with the patient and/or caregiver with initial education and support. (AMA, 2018)
-
Similar E&M services include office or outpatient visits for an established patient (billed using E&M codes 99211-99215).
-
Under the law, Medicare is required to waive cost-sharing for preventative services recommended by the USPSTF and may not vary cost-sharing according to a patient's condition or diagnosis. Under Medicare Part B, cost-sharing can be waived for ACP when it is billed as part of the annual wellness visit. When ACP is part of the annual wellness visit, it is considered part of a preventative service, so that cost-sharing is waived. Only the USPSTF has the authority to modify or eliminate the coverage of certain preventative services (USPSTF, 2019).
ANALYSIS OF DISABILITY, AGING AND LONG-TERM CARE POLICY AND DATA
This report was prepared under contract #HHSP233201600021I between HHS's ASPE/BHDAP and RTI International. For additional information about this subject, you can visit the BHDAP home page at https://aspe.hhs.gov/bhdap or contact the ASPE Project Officers, at HHS/ASPE/BHDAP, Room 424E, H.H. Humphrey Building, 200 Independence Avenue, S.W., Washington, D.C., 20201; William.Haltermann@hhs.gov, Iara.Oliveira@hhs.gov.
Reports Available
Advance Care Planning Among Medicare Fee-For-Service Beneficiaries and Practitioners: Final Report
- HTML version: https://aspe.hhs.gov/basic-report/advance-care-planning-among-medicare-fee-service-beneficiaries-and-practitioners-final-report
- PDF version: https://aspe.hhs.gov/pdf-report/advance-care-planning-among-medicare-fee-service-beneficiaries-and-practitioners-final-report
Advance Care Planning Among Medicare Fee-For-Service Beneficiaries and Practitioners: Research Brief