
As of August 4, 2021, 70.1 percent of U.S. adults have received at least one dose of a COVID-19 vaccine. However, vaccine coverage varies dramatically across the country, with vaccine coverage being less than 40 percent in a third of U.S. counties. Despite a sufficient supply of COVID-19 vaccines, daily vaccinations have dwindled in recent months. While vaccine hesitancy may contribute to low local vaccination rates, a portion of U.S. adults indicate they may be willing to be vaccinated but have not yet received the vaccine. This suggests that outreach and efforts to improve access to COVID-19 vaccines may be beneficial in trying to increase vaccination rates. To support state and local communication and outreach efforts, this analysis explores data on unvaccinated adults who express a willingness to be vaccinated against COVID-19 (whom we refer to in this report as “unvaccinated but willing”) among different geographic areas and sociodemographic groups. Additionally, this analysis models which factors are associated with being unvaccinated but willing and examines changing trends over time.
This analysis does not attempt to include all potential variables that may impact the decision to vaccinate. Thus, our estimates should be used with caution when attempting to generalize beyond the factors examined. Furthermore, although the patterns are similar to CDC vaccine administration data, the Household Pulse Survey tends to overestimate vaccination rates, which suggests that unvaccinated adults are underrepresented and that our estimates are underestimated. These and other limitations are further discussed in the Issue Brief.
Estimated Percent of Unvaccinated but Willing and Vaccine Coverage by County
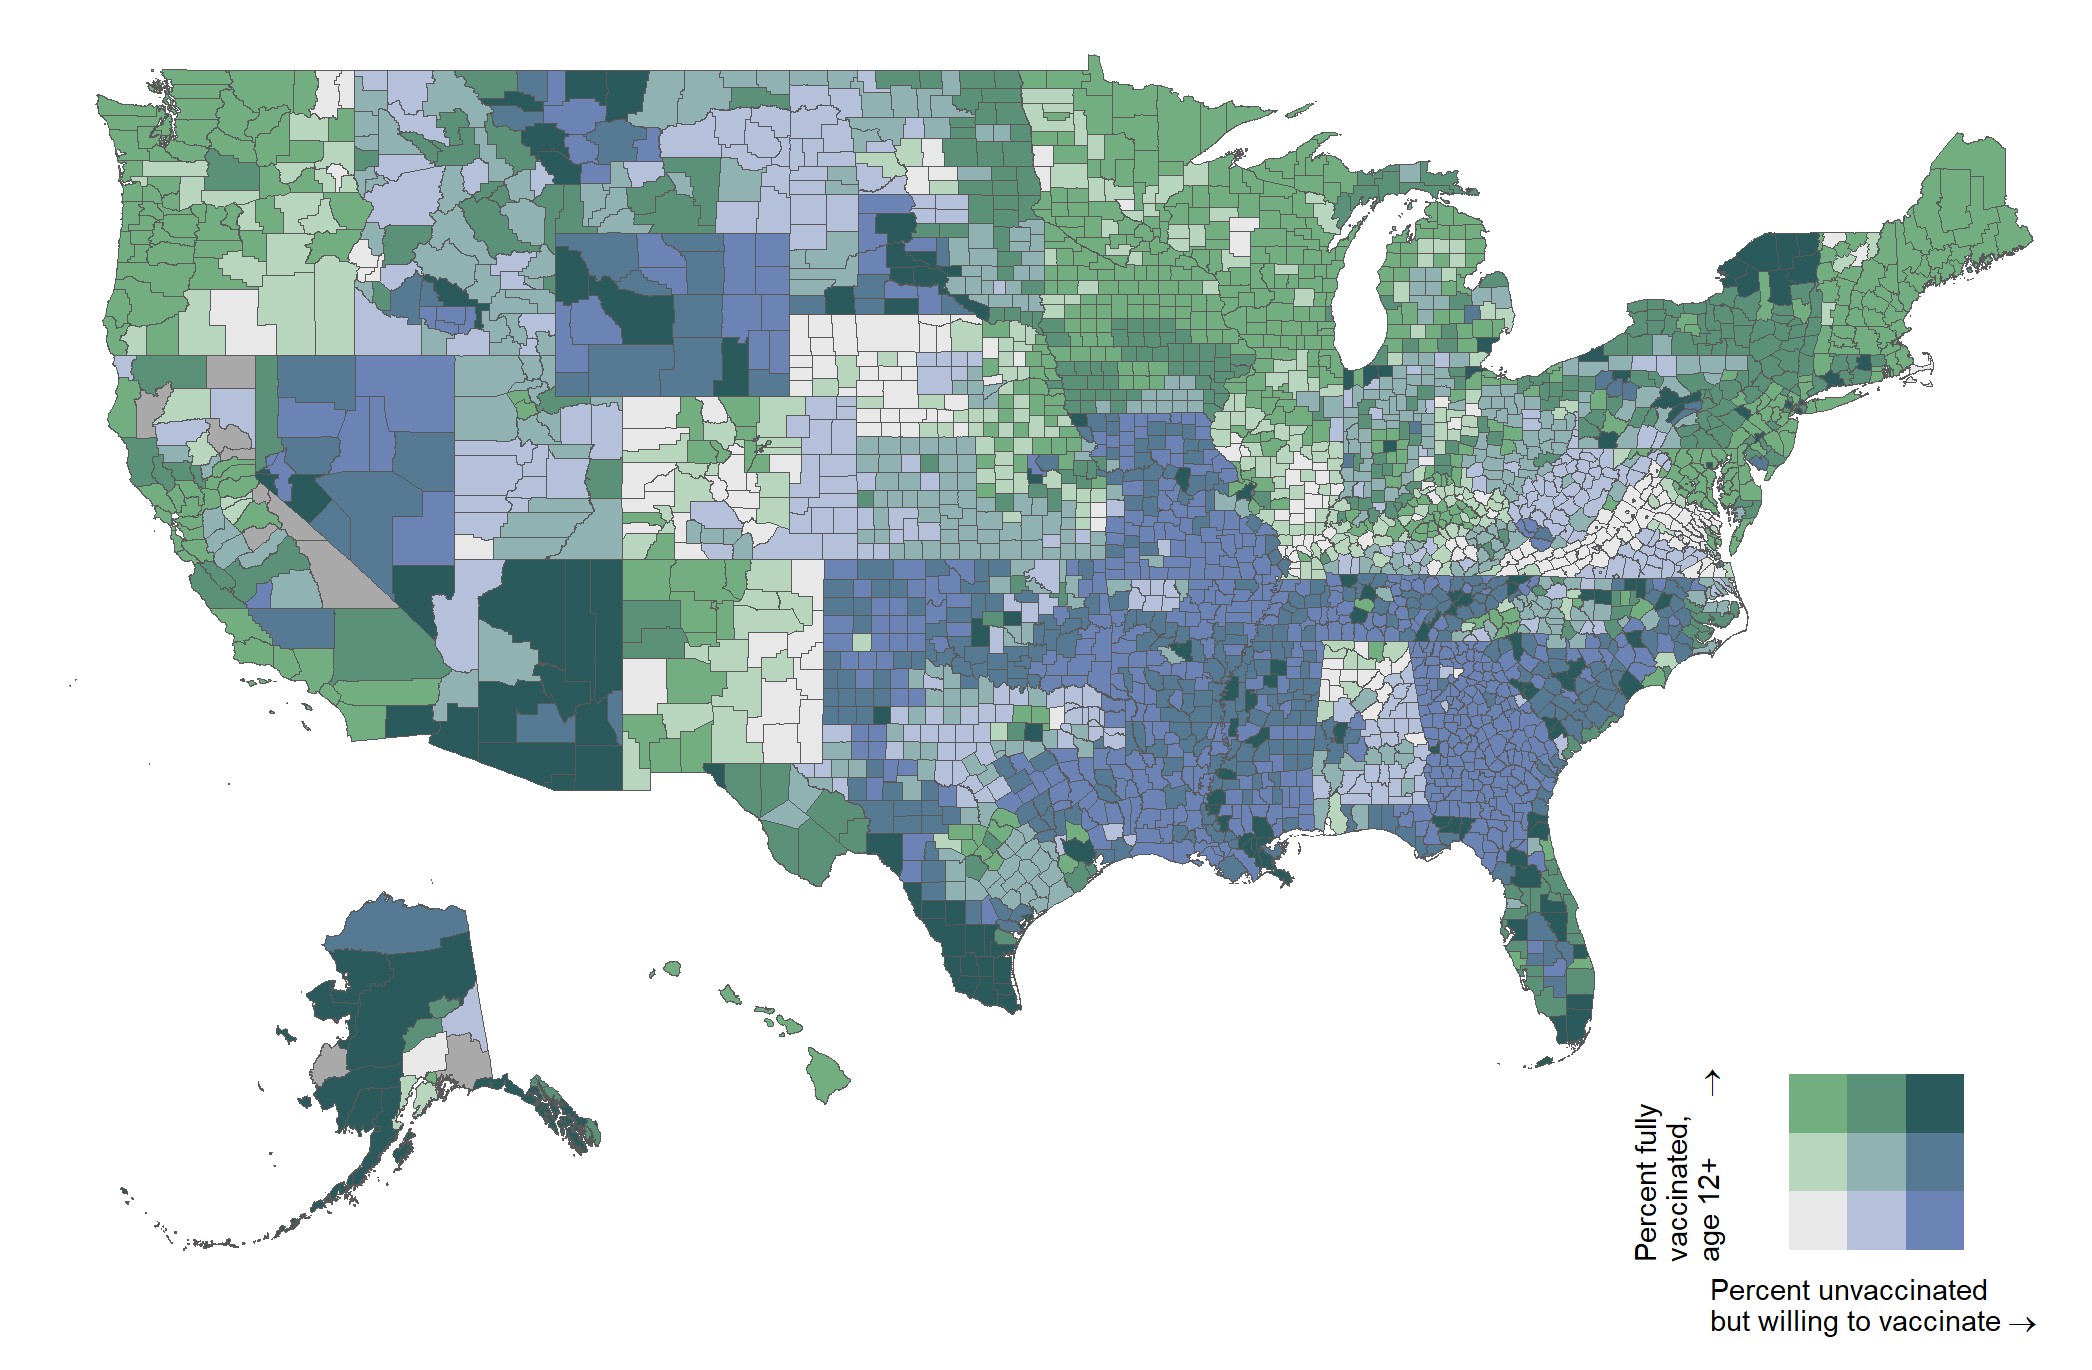
Source: ASPE analysis of Household Pulse Survey for June 23-July 5, 2021.
Related Products
- Vaccine Hesitancy for COVID-19: State, County, and Local Estimates
- Health Disparities by Race and Ethnicity During the COVID-19 Pandemic: Current Evidence and Policy Approaches
- Risk of COVID-19 Infections, Hospitalization, and Death in Fee-for-service Medicare
- Factors Influencing Variation Between States in Efficiency of COVID-19 Vaccine Administration
- Disparities in COVID-19 Vaccination Rates Across Racial and Ethnic Minority Groups in the United States