
September 2020
Printer Friendly Version in PDF Format (200 PDF pages)
ABSTRACT
Per Section 223(d)(7)(A) of the Protecting Access to Medicare Act (PAMA) of 2014 (Public Law 113-93), the U.S. Department of Health and Human Services (HHS) Secretary must submit to Congress an annual report on the use of funds provided under all demonstration programs conducted under this subsection, not later than one year after the date on which the first State is selected for a demonstration program under this subsection, and annually thereafter. Each report shall include assessments of: (1) access to community-based mental health services; (2) the quality and scope of services provided by CCBHCs; and (3) the impact of the demonstration programs on the federal and state costs of a full range of mental health services.
This 2019 report informs the third annual report to Congress and highlights participating states' CCBHC activities that have been associated with improving access to a comprehensive range of treatment and recovery support services. The range of services includes delivery of mental health, addiction, and either screening for general medical conditions or onsite access to primary care during the first year of the demonstration. It draws on qualitative findings gathered from interviews at the state level and data from surveys of CCBHCs.
Subsequent annual reports to Congress on this demonstration will include more details, benefitting from data pending on quality measures and cost reports now being collected by CCBHCs and by demonstration states as required. In addition, claims analyses will be conducted to answer the questions about the demonstration posed by Congress.
This report was prepared under contract #HHSP233201600017I between HHS's ASPE/BHDAP and Mathematica Policy Research to conduct the national evaluation of the demonstration. For additional information about this subject, you can visit the BHDAP home page at https://aspe.hhs.gov/bhdap or contact the ASPE Project Officer, Judith Dey, at HHS/ASPE/BHDAP, Room 424E, H.H. Humphrey Building, 200 Independence Avenue, S.W., Washington, D.C. 20201. Her e-mail address is: Judith.Dey@hhs.gov.
DISCLAIMER: The opinions and views expressed in this report are those of the authors. They do not reflect the views of the Department of Health and Human Services, the contractor or any other funding organization. This report was completed and submitted on September 19, 2019.
"
ACRONYMS
The following acronyms are mentioned in this report and/or appendices.
| ACT | Assertive Community Treatment |
|---|---|
| AOT | Assisted Outpatient Treatment |
| ASAM | American Society of Addiction Medicine |
| ASPE | HHS Office of the Assistant Secretary for Planning and Evaluation |
| CBT | Cognitive Behavioral Therapy |
| CCBHC | Certified Community Behavioral Health Clinic |
| CMHC | Community Mental Health Center |
| CMS | HHS Centers for Medicare & Medicaid Services |
| DBT | Dialectical Behavior Therapy |
| DCO | Designated Collaborating |
| DY | Demonstration Year |
| DY1 | First Demonstration Year |
| DY2 | First Demonstration Year |
| EBP | Evidence-Based Practice |
| ED | Emergency Department |
| EHR | Electronic Health Record |
| FHQC | Federally Qualified Health Center |
| HHS | U.S. Department of Health and Human Services |
| HIT | Health Information Technology |
| IOP | Intensive Outpatient |
| LCSW | Licensed Clinical Social Worker |
| LGBTQ | Lesbian, Gay, Bisexual, Transgender, and Queer (or questioning) |
| MAT | Medication-Assisted Treatment |
| MH | Mental Health |
| PAMA | Protecting Access to Medicare Act |
| PPS | Prospective Payment System |
| PPS-1 | PPS First Model/Methodology |
| PPS-2 | PPS Second Model/Methodology |
| QBP | Quality Bonus Payment |
| RN | Registered Nurse |
| SAMHSA | HHS Substance Abuse and Mental Health Services Administration |
| SMI | Serious Mental Illness |
| SUD | Substance Use Disorder |
| TCM | Targeted Case Management |
| VA | U.S. Department of Veterans Affairs |
EXECUTIVE SUMMARY
Section 223 of the Protecting Access to Medicare Act (PAMA), enacted in April 2014, authorized the Certified Community Behavioral Health Clinic (CCBHC) demonstration to allow states to test new strategies for delivering and reimbursing services provided in community mental health centers (CMHCs). The CCBHC demonstration aims to improve the availability, quality, and outcomes of ambulatory services provided in CMHCs and other providers by establishing a standard definition and criteria for CCBHCs and developing a new payment system that accounts for the total cost of providing comprehensive services to all individuals who seek care. The demonstration also aims to provide coordinated care that addresses both behavioral and physical health conditions.
In October 2015, the U.S. Department of Health and Human Services (HHS) awarded planning grants to 24 states to begin certifying providers to become CCBHCs, develop new prospective payment systems (PPS), and plan for the demonstration's implementation. To support the demonstration's first phase, HHS, as required by PAMA, developed criteria for use in certifying CCBHCs in six important areas: (1) staffing; (2) availability and accessibility of services; (3) care coordination; (4) scope of services; (5) quality and reporting; and (6) organizational authority.[1] The criteria established a minimum threshold for the structures and processes that CCBHCs should have in place to provide high-quality care, although states may exercise some discretion in implementing the criteria to reflect their particular needs.
States used the planning grants to develop infrastructure to support the CCBHC demonstration, and to select a PPS model and develop PPS rates. States chose between two broad PPS models developed by the HHS Centers for Medicare & Medicaid Services (CMS) (although they may exercise some flexibility in operationalizing the models). The first model (PPS-1) is similar to the PPS model used by federally qualified health centers--it reimburses costs by using a fixed daily rate for all services rendered to a Medicaid beneficiary. If a state elected the PPS-1 model, CMS reimburses participating CCBHCs at a fixed daily rate for all services provided to a Medicaid beneficiary. The PPS-1 model also includes a state option to provide quality bonus payments (QBPs) to CCBHCs that meet defined quality metrics. The second model (PPS-2) reimburses costs by using a standard monthly rate per person served, with separate monthly rates that vary with beneficiaries' clinical conditions. Under the PPS-2 model, CMS reimburses participating CCBHCs at a fixed monthly rate for all services provided to a Medicaid beneficiary. The PPS-2 also includes outlier payments for costs above and beyond a specific threshold (that is, payment adjustments for extremely costly Medicaid beneficiaries). The PPS-2 model also requires bonus payments for clinics that meet defined quality metrics. Both PPS models aim to enhance Medicaid reimbursement by ensuring that reimbursement rates more closely reflect the cost of providing an enhanced scope of services. While clinics cannot reject or limit services on the basis of a client's ability to pay, CCBHCs can, however, only bill Medicaid for services provided to Medicaid beneficiaries. In addition, states must establish and publish a sliding fee discount schedule for consumers.
| TABLE ES.1. Number of CCBHCs, Demonstration Start Date, and PPS | |||
|---|---|---|---|
| State | Number of CCBHCs | Demonstration Start Date | PPS |
| Minnesota | 6 | July 1, 2017 | PPS-1* |
| Missouri | 15 | July 1, 2017 | PPS-1* |
| Nevada | 3a | July 1, 2017 | PPS-1* |
| New Jersey | 7 | July 1, 2017 | PPS-2 |
| New York | 13 | July 1, 2017 | PPS-1* |
| Oklahoma | 3 | April 1, 2017 | PPS-2 |
| Oregon | 12 | April 1, 2017 | PPS-1 |
| Pennsylvania | 7 | July 1, 2017 | PPS-1* |
| SOURCE: Mathematica/RAND review of CCBHC demonstration applications and telephone consultations with state officials. NOTES:
|
|||
In December 2016, HHS selected eight states from among the 24 that received planning grants to implement their PPS models and provide services that align with the CCBHC certification criteria. Consistent with PAMA requirements, HHS selected Minnesota, Missouri, Nevada, New Jersey, New York, Oklahoma, Oregon, and Pennsylvania based on the completeness of the scope of services that their CCBHCs will offer; the CCBHCs' ability to improve the availability of, access to, and engagement with a range of services (including assisted outpatient treatment); and their potential to expand mental health services without increasing federal spending. CCBHCs participating in the demonstration must also provide coordinated care and make available a comprehensive range of nine types of services[2] to all who seek help, including but not limited to those with serious mental illness, serious emotional disturbance, and substance use disorder (SUD). Services must be person-centered and family- centered, trauma-informed, and recovery-oriented, and the integration of physical and behavioral health care must serve the "whole person." To ensure the availability of the full scope of CCBHC services, service delivery could involve the participation of Designated Collaborating Organizations (DCO), which are entities not under the direct supervision of a CCBHC but that are engaged in a formal, contractual relationship with a CCBHC to provide selected services. CCBHCs that engage DCOs maintain clinical and financial responsibility for services provided by a DCO to CCBHC consumers, and DCOs provide services under the same requirements as CCBHCs and are reimbursed for these services directly by the CCBHC. In addition, CCBHCs and participating states must be able to collect, track, and report on a wide range of encounter, outcome, cost, and quality data. As summarized in Table ES.1, 66 CCBHCs are participating across eight states; only two states elected the PPS-2 model. As of August 2019, the demonstration will end on September 13, 2019.
In September 2016, the HHS Office of the Assistant Secretary for Planning and Evaluation (ASPE) contracted with Mathematica and its subcontractor, the RAND Corporation, to conduct a comprehensive national evaluation of the demonstration. ASPE is overseeing the evaluation in collaboration with CMS.
Working with these federal partners, Mathematica and RAND designed a mixed-methods evaluation to examine the implementation and outcomes of the demonstration and to provide information for HHS to include in its reports to Congress. Specifically, Section 223 of PAMA mandates that HHS's reports to Congress must include: (1) an assessment of access to community-based mental health services under Medicaid in the area or areas of a state targeted by a demonstration program as compared to other areas of the state; (2) an assessment of the quality and scope of services provided by CCBHCs as compared to community-based mental health services provided in states not participating in a demonstration program and in areas of a demonstration state not participating in the demonstration; and (3) an assessment of the impact of the demonstration on the federal and state costs of a full range of mental health services (including inpatient, emergency, and ambulatory services). To date, the evaluation has focused on providing critical information to Congress and the larger behavioral health community about the strategies that CCBHCs employ to improve care. As more data become available, the evaluation will describe the effects of the demonstration on consumer outcomes and costs.
In June 2018, Mathematica and RAND submitted to ASPE a report titled "Interim Implementation Findings from the National Evaluation of the Certified Community Behavioral Health Clinic Demonstration," which described--through April 2018--the progress that states and CCBHCs made in implementing the demonstration and their successes and challenges. The current report provides updated information on implementation of the demonstration through April 2019 (approximately the first 22 months of the demonstration for six states and 24 months for the remaining two states). The findings in this report draw on data collected from interviews with state Medicaid and behavioral health agency officials and progress reports submitted by all participating CCBHCs (hereafter referred to as clinics). Unless otherwise noted, the 2018 and 2019 findings in this report are based on the number of clinics participating in the demonstration at the time of data collection each year (67 CCBHCs in 2018, and 66 CCBHCs in 2019 respectively).[3]
The clinic profiles in the report are based on site visits to CCBHCs in four states. In future reports, we will examine the impact of the demonstration on health care utilization, quality, and costs, using claims data and information submitted by CCBHCs and states. In August 2019, we will submit a separate report that summarizes states' and clinics' experiences with the required quality measures (based on interview and site visit data) and costs (using data from the CCBHC cost-reporting template).[4]
Implementation Findings
During the demonstration, states and CCBHCs have focused on increasing access to care, maintaining the staffing and scope of services requirements in the certification criteria, and ensuring coordinated care for CCBHC clients. Although some CCBHCs experienced early implementation challenges related to staffing or the implementation of new services, state officials reported that the CCBHCs addressed these challenges and appear to be adhering to the certification criteria in the second demonstration year.
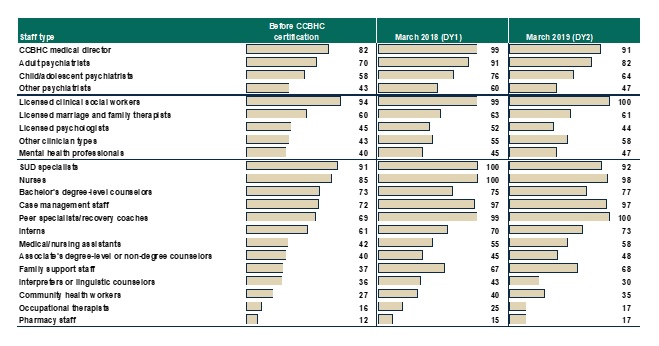
Most CCBHCs hired additional staff as part of the certification process. As shown in Figure ES.1 and detailed in Appendix Table A.1, most CCBHCs already employed licensed clinical social workers (LCSWs), SUD specialists, nurses, a medical director, bachelor's degree-level counselors, case managers, adult psychiatrists, and peer specialists/recovery coaches before they received certification. The CCBHCs most often hired case managers, peer specialists/recovery coaches, and family support workers, perhaps reflecting the criteria's focus on enhancing care coordination and person-centered and family-centered care. In addition, CCBHCs often hired various types of nurses and child/adolescent psychiatrists to provide the full scope of required services. Although states had the latitude to determine the specific types of staff their CCBHCs must employ, as of March 2018 (Demonstration Year 1 [DY1]), nearly all CCBHCs employed the types of staff mentioned in the CCBHC certification criteria.
CCBHCs' ability to maintain the required types of staff throughout the demonstration varied by staff type. For example, as shown in Figure ES.1, there was no substantial difference between DY1 and second Demonstration Year (DY2) in the proportion of clinics that employed the following staff types: LCSWs, nurses, associate's degree-level or non-degree counselors, case management staff, peer specialists/recovery coaches, licensed psychologists, other clinician types, mental health professionals, family support staff, and community health workers. However, the proportion of clinics that employed psychiatrists declined from DY1 to DY2. Seventy-six percent of clinics employed child psychiatrists in DY1 versus 64 percent in DY2. Likewise, 91 percent of clinics employed adult psychiatrists in DY1 versus 82 percent in DY2. There was also a 13 point decline from DY1 to DY2 in the percentage of clinics that employed interpreters or linguistic counselors. Such changes in staffing may suggest clinics' efforts to experiment and identifying ways to use staff and resources more efficiently. CCBHCs and states reported that clinics faced several ongoing challenges associated with hiring and retaining staff, including, for example, uncertainty around the future of the demonstration, retaining enough of each staff type to meet increased demand for services, and increases in caseloads and responsibilities leading to staff burnout. However, officials generally perceived that clinics effectively used strategies such as increased salaries and benefits to overcome challenges.
| FIGURE ES.1. Proportion of CCBHCs that Employed Specific Types of Staff Before Certification and in March 2018 (DY1) and March 2019 (DY2) |
|---|
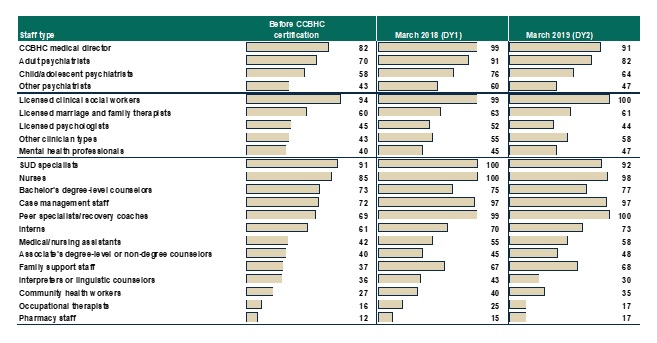 |
| SOURCE: CCBHC Annual Progress Report Demonstration Year 1 and Year 2 data collected by Mathematica and the RAND Corporation, March 2018 and March 2019. NOTES: Denominator is 67 CCBHCs for "Proportion of CCBHCs that employed staff type before certification" and March 2018 findings, and 66 CCBHCs for March 2019 findings. See Appendix Table A.1 for detailed findings and number of clinics corresponding to the percentages. See Appendix Table A.2 for state-level findings. These findings were generally consistent across states, with the exception of Minnesota and Pennsylvania, where the proportion of clinics employing each type of staff did not decrease from 2018 to 2019. Consistent with the CCBHC cost-reporting template, the mental health professional category includes only providers trained and credentialed for psychological testing. "Other clinician types" is a write-in category. |
In the second year of the demonstration, officials in all but one state cited uncertainty around the future of the demonstration as the most significant staffing challenge for clinics. State officials reported that the uncertainty has adversely affected clinics' ability to retain staff and maintain workforce morale as the demonstration draws to a close, noting that clinics have been reluctant to add new positions or fill vacancies for fear of not being able to sustain those staff positions after the demonstration ends.
CCBHCs have worked throughout the demonstration to make services more convenient and tailored to the needs of specific populations. As reported by states, the most common strategy used by CCBHCs to increase access to care was to introduce open-access scheduling. In addition, as shown in Figure ES.2, CCBHCs provided services in locations outside of the clinic, such as consumers' homes and community service agencies like Social Security offices and community centers, in both demonstration years. Clinics also have continued to make broad use of telehealth to extend the reach of CCBHC services. Clinics have used a variety of other strategies to improve accessibility, such as conducting outreach to new and underserved populations, and remodeling the physical space of clinics to accommodate the delivery of new services (such as detoxification and physical health screening and monitoring) Stakeholder organizations representing consumers and their family members reported that the strategies CCBHCs have employed, such as open-access and expanded hours of service provision, have significantly improved access to care for CCBHC clients in their states.
| FIGURE ES.2. Proportion of CCBHCs that Provided Services Outside of Physical Clinic Space in the Past 12 Months |
|---|
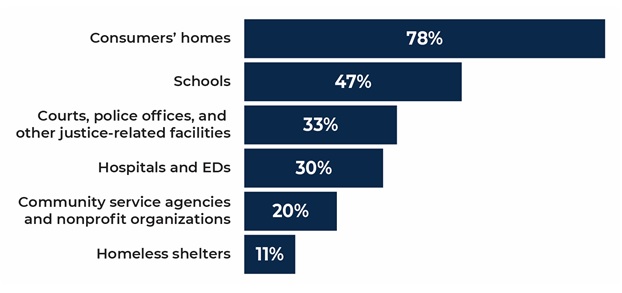 |
| SOURCE: CCBHC Annual Progress Report Demonstration Year 2 data collected by Mathematica and the RAND Corporation, March 2019. NOTES: The denominator is the number of CCBHCs that reported offering services outside of the CCBHC physical buildings in the past 12 months as of March 2019 (n = 64). See Appendix Table A.6 for 2018 findings. See Appendix Table A.7 for state-level findings. The majority of clinics in all 8 demonstration states offered services outside of the CCBHC as of 2018, increasing to 100% of all CCBHCs as of 2019 in all states except New Jersey. |
Most CCBHCs expanded their scope of services to meet the certification requirements. Clinics most often added services within the categories of outpatient mental health and/or SUD services, psychiatric rehabilitation services, crisis services, peer support, services for members of the armed forces and veterans, and primary care screening and monitoring (Figure ES.3). The extent to which the CCBHCs added services to meet the certification requirements varied widely across the states depending on the service infrastructure that existed before the demonstration.
| FIGURE ES.3. Proportion of CCBHCs that Added Each Type of Service as a Result of Certification (as of March 2018) |
|---|
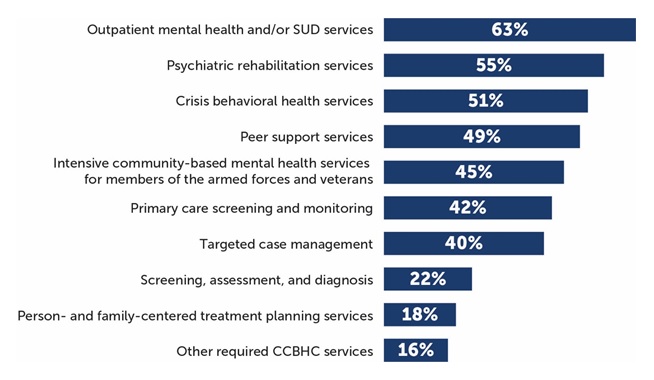 |
| SOURCE: CCBHC Annual Progress Report Demonstration Year 1 data collected by Mathematica and the RAND Corporation, March 2018. NOTES: Denominator is 67 CCBHCs. See Appendix Table A.11 for detailed findings on individual services. CCBHCs may have provided services within each of the service categories illustrated in the figure before CCBHC certification. For example, all clinics provided some type of outpatient mental health and/or SUD treatment before certification. However, 63% of clinics added some type of outpatient mental health and/or SUD treatment as a result of certification. The service categories illustrated in this figure correspond to the service categories described in the CCBHC certification criteria. |
Officials in all states perceived that clinics were able to sustain delivery of the nine core CCBHC services throughout the demonstration, a finding confirmed by clinics in the progress report. As shown in Figure ES.4, nearly all CCBHCs in both DY1 and DY2 reported that they provided the required services, with the exception of intensive community-based mental health services for members of the armed forces and veterans, which were provided by about 70 percent of clinics in both years. State officials speculated that the armed forces/veterans populations did not comprise a large percentage of CCBHC clients and that CCBHCs may have struggled to engage these populations and to develop strong referral relationships and care coordination agreements with the U.S. Department of Veterans Affairs providers. Though not required by the demonstration, about half of clinics provided on-site primary care in each demonstration year.
| FIGURE ES.4. Proportion of CCBHCs that Provided Each Type of Service Either Directly or Through a DCO |
|---|
 |
| SOURCE: CCBHC Annual Progress Report Demonstration Year 1 and Year 2 collected by Mathematica and the RAND Corporation, March 2018 and March 2019. NOTES: Denominator is 67 CCBHCs in 2018 (DY1) and 66 CCBHCs in 2019 (DY2). The "other required CCBHC services" category denotes additional services that do not fall within the 9 service types defined in federal criteria but that may be required by individual states. See Appendix Table A.12 for detailed findings and the number of clinics corresponding to the percentages. See Appendix Table A.13 for state-level findings. |
CCBHCs were able to add and sustain a range of evidence-based practices (EBPs) across demonstration years. In the first year of the demonstration, CCBHCs offered a wide range of EBPs and psychiatric rehabilitation and other services either directly or through DCOs. As shown in Figure ES.5, most clinics were able to sustain or provide more of these services in the second year of the demonstration. For example, 46 percent (n = 31) of clinics added medication-assisted treatment (MAT) for alcohol or opioid use as a result of certification, and 92 percent of clinics (n = 61) offered MAT in DY2 compared to 84 percent (n = 56) in DY1. Even though, early in the demonstration, CCBHCs generally addressed challenges to maintaining EBPs and providing the full scope of CCBHC services, officials continued to explore ways to support clinics in offering the full range of services, such as by providing CCBHCs with increased flexibility to better tailor EBPs and other services to reflect the needs and preferences of their client populations.
CCBHCs have used a variety of strategies to improve care coordination, including adding various provider types to treatment teams and expanding targeted care coordination strategies to different populations and service lines. In the early stages of the demonstration, improvements to electronic health records (EHR) and health information technology aided clinics in their care coordination efforts, in some cases permitting CCBHCs to integrate care plans more fully, connect with external providers, and receive alerts about clients' care transitions. As the demonstration progressed, clinics implemented additional strategies, and initiated collaboration with various external organizations to facilitate coordinated care. For example, some clinics partnered with first responders and law enforcement officials on strategies to intervene in crisis situations and divert those in crisis from the criminal justice system.
CCBHCs, for the most part, elected to offer the full scope of CCBHCs services directly, instead of engaging separate organizations to deliver required services. While the certification criteria allowed for some services to be provided by DCOs, officials suggested that CCBHCs preferred to provide services directly because they wished to embrace the model fully and were reluctant to assume oversight responsibility for another provider's services. CCBHCs did, however, continue to provide and expand services in collateral agencies such as schools and shelters and to build and sustain close formal and informal relationships with a range of external providers.
| FIGURE ES.5. Proportion of CCBHCs that Provided Selected EBPs, Psychiatric Rehabilitation Services, and Other Services, Either Directly or Through a DCO |
|---|
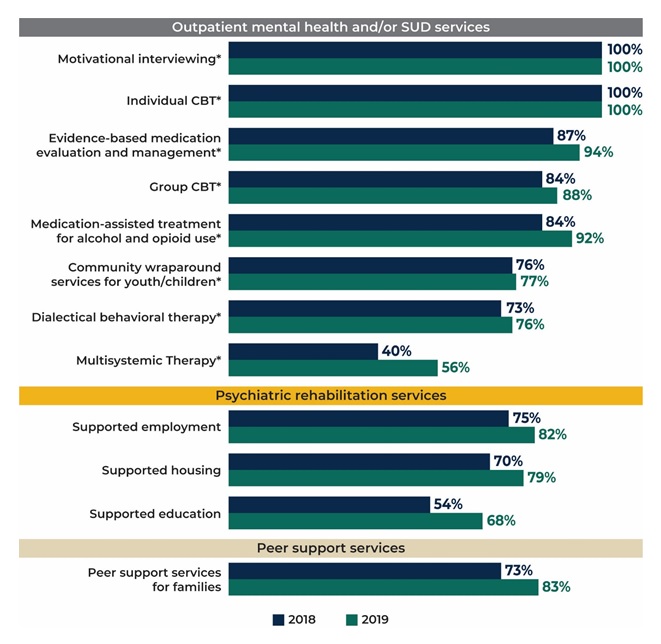 |
| SOURCE: CCBHC Annual Progress Report Demonstration Year 1 and Year 2 collected by Mathematica and the RAND Corporation, March 2018 and March 2019. NOTES: Denominator is 67 CCBHCs in 2018 and 66 CCBHCs in 2019. See Appendix Table A.12 for detailed findings and the number of clinics corresponding to the percentages. See Appendix Table A.11 for the number and percentage of clinics that added each type of service as a result of CCBHC certification. See Appendix Table A.13 for state-level findings. * = EBP listed in CCBHC criteria. |
Future Evaluation Activities
In August 2019, we will submit a report summarizing information from the first year of CCBHC cost reports. The report will also draw on information from interviews and site visits to describe clinics' experience with the PPS and the progress that CCBHCs and states are making toward submission of the required quality measures. We will update the report in August 2020 to include information from the second year of CCBHC cost reports and will summarize the quality of care provided to CCBHC consumers by using data from the CCBHC-reported and state-reported quality measures.
We are in the process of obtaining Medicaid claims and encounter data from states to examine changes in service utilization and costs. We plan to examine the impacts of CCBHC services on: (1) hospitalization rates; (2) emergency department service utilization; and (3) ambulatory care relative to within-state comparison groups (Medicaid beneficiaries with similar diagnostic and demographic characteristics who did not receive care from CCBHCs). Depending on the availability of data within each state, we expect that the impact analyses will use approximately four years of Medicaid claims/encounter data (up to a two-year pre-demonstration period and a two-year post-implementation period). We will report these findings in our final report in May 2021, along with updated findings that draw on both years of CCBHC cost reports and quality measures.
I. BACKGROUND
A. Description of the CCBHC Demonstration
In April 2014, Section 223 of the Protecting Access to Medicare Act (PAMA) authorized the Certified Community Behavioral Health Clinic (CCBHC) demonstration to allow states to test new strategies for delivering and reimbursing services provided in community mental health centers (CMHCs). The CCBHC demonstration aims to improve the availability, quality, and outcomes of ambulatory services provided in CMHCs by establishing a standard definition and criteria for CCBHCs and developing a new payment system that accounts for the total cost of providing comprehensive services to all individuals who seek care. The demonstration also aims to provide coordinated care that addresses both behavioral and physical health conditions.
In October 2015, the U.S. Department of Health and Human Services (HHS) awarded planning grants to 24 states to begin certifying CMHCs to become CCBHCs, develop new prospective payment systems (PPS), and plan for the demonstration's implementation. To support the demonstration's first phase, HHS, as required by PAMA, developed criteria for use in certifying CCBHCs in six important areas: (1) staffing; (2) availability and accessibility of services; (3) care coordination; (4) scope of services; (5) quality and reporting; and (6) organizational authority.[5] The criteria established a minimum threshold for the structures and processes that CCBHCs should have in place to provide high-quality care, although states may exercise some discretion in implementing the criteria to reflect their particular needs.
States used the planning grants to develop infrastructure to support the CCBHC demonstration, and to select a PPS model and develop PPS rates. States chose between two broad PPS models developed by the HHS Centers for Medicare & Medicaid Services (CMS) (although they may exercise some flexibility in operationalizing the models). The first model (PPS-1) is similar to the PPS model used by federally qualified health centers (FHQCs)--it reimburses costs by using a fixed daily rate for all services rendered to a Medicaid beneficiary. If a state elected the PPS-1 model, CMS reimburses participating CCBHCs at a fixed daily rate for all services provided to a Medicaid beneficiary. The PPS-1 model also includes a state option to provide quality bonus payments (QBPs) to CCBHCs that meet defined quality metrics. The second model (PPS-2) reimburses costs by using a standard monthly rate per person served, with separate monthly rates that vary with beneficiaries' clinical conditions. Under the PPS-2 model, CMS reimburses participating CCBHCs at a fixed monthly rate for all services provided to a Medicaid beneficiary. The PPS-2 also includes outlier payments for costs above and beyond a specific threshold (that is, payment adjustments for extremely costly Medicaid beneficiaries). The PPS-2 model also requires bonus payments for clinics that meet defined quality metrics. Both PPS models aim to enhance Medicaid reimbursement by ensuring that reimbursement rates more closely reflect the cost of providing an enhanced scope of services. The use of a PPS provides a unique opportunity for states and CCBHCs to develop rates based on the expected cost of care that accounted for total costs associated with delivering the nine required services to Medicaid beneficiaries. This included the ability to use a mix of staffing models, as well as pay for services that were allowed under the demonstration, but might not have been traditionally covered under Medicaid, such as those that do not involve face-to-face contact with the consumer. These PPS reflect HHS's broader strategy of encouraging the development of a health care system that results in better care, smarter spending, and healthier people. While clinics cannot reject or limit services on the basis of a client's ability to pay, CCBHCs can, however, only bill Medicaid for services provided to Medicaid beneficiaries. In addition, states must establish and publish a sliding fee discount schedule for clients.
In December 2016, HHS selected eight states from among the 24 that received planning grants to implement their PPS models and provide services that align with the CCBHC certification criteria. Consistent with PAMA requirements, HHS selected Minnesota, Missouri, Nevada, New Jersey, New York, Oklahoma, Oregon, and Pennsylvania based on the completeness of the scope of services their CCBHCs will offer; the CCBHCs' ability to improve the availability of, access to, and engagement with a range of services (including assisted outpatient treatment [AOT]); and their potential to expand mental health services without increasing federal spending. CCBHCs participating in the demonstration must also provide coordinated care and make available a comprehensive range of nine types of services[6] to all who seek help, including but not limited to those with serious mental illness (SMI), serious emotional disturbance (SED), and substance use disorder (SUD). Services must be person-centered and family-centered, trauma-informed, and recovery-oriented, and the integration of physical and behavioral health care must serve the "whole person." To ensure the availability of the full scope of CCBHC services, service delivery could involve the participation of other Designated Collaborating Organizations (DCO), which are entities not under the direct supervision of a CCBHC but that are engaged in a formal relationship with a CCBHC to provide selected services. DCOs provide services under the same requirements as CCBHCs. CCBHCs that engage DCOs maintain clinical and financial responsibility for services provided by a DCO to CCBHC consumers, and directly reimburse DCOs for provided services. CCBHCs and participating states must be able to collect, track, and report on a wide range of encounter, outcome, cost, and quality data. As summarized in Table I.1, 66 CCBHCs are participating across eight states; only two states elected the PPS-2 model. As of August 2019, the demonstration will end on September 13, 2019.
| TABLE I.1. Number of CCBHCs, Demonstration Start Date, and PPS | |||
|---|---|---|---|
| State | Number of CCBHCs | Demonstration Start Date | PPS |
| Minnesota | 6 | July 1, 2017 | PPS-1* |
| Missouri | 15 | July 1, 2017 | PPS-1* |
| Nevada | 3a | July 1, 2017 | PPS-1* |
| New Jersey | 7 | July 1, 2017 | PPS-2 |
| New York | 13 | July 1, 2017 | PPS-1* |
| Oklahoma | 3 | April 1, 2017 | PPS-2 |
| Oregon | 12 | April 1, 2017 | PPS-1 |
| Pennsylvania | 7 | July 1, 2017 | PPS-1* |
| SOURCE: Mathematica/RAND review of CCBHC demonstration applications and telephone consultations with state officials. NOTES:
|
|||
1. Goals of the National Evaluation
In September 2016, the HHS Office of the Assistant Secretary for Planning and Evaluation (ASPE) contracted with Mathematica and its subcontractor, the RAND Corporation, to conduct a comprehensive national evaluation of the demonstration. ASPE is overseeing the evaluation in collaboration with CMS.
Working with these federal partners, Mathematica and RAND designed a mixed-methods evaluation to examine the implementation and outcomes of the demonstration and to provide information for HHS to include in its reports to Congress. Specifically, Section 223 of PAMA mandates HHS's reports to Congress to include: (1) an assessment of access to community-based mental health services under Medicaid in the area or areas of a state targeted by a demonstration program as compared to other areas of the state; (2) an assessment of the quality and scope of services provided by CCBHCs as compared to community-based mental health services provided in states not participating in a demonstration program and in areas of a demonstration state not participating in the demonstration; and (3) an assessment of the impact of the demonstration on the federal and state costs of a full range of mental health services (including inpatient, emergency, and ambulatory services). To date, the evaluation has focused on providing critical information to Congress and the larger behavioral health community about the strategies that CCBHCs employ to improve care. As more data become available, the evaluation will describe the effects of the demonstration on consumer outcomes and costs.
2. Purpose of Report
In June 2018, Mathematica and RAND submitted to ASPE a report titled "Interim Implementation Findings from the National Evaluation of the Certified Community Behavioral Health Clinic Demonstration," which described--through April 2018--the progress that states and CCBHCs made in implementing the demonstration and their successes and challenges. The current report provides updated information on the implementation of the demonstration through April 2019 (approximately the first 22 months of the demonstration for six states and 24 months for the remaining two states). The findings in this report draw on data collected from interviews with state Medicaid and behavioral health agency officials and progress reports submitted by all participating CCBHCs (hereafter referred to as clinics). The clinic profiles in the report are based on site visits to CCBHCs in four states. Chapter II of the report describes the data collection and analytic methods. Chapter III provides updated findings on implementation progress, successes, and challenges with respect to CCBHCs' staffing (Chapter III.A), access to care (Chapter III.B), scope of services (Chapter III.C), and care coordination (Chapter III.D). The final chapter summarizes overarching themes that emerged from our analysis and briefly describes next steps for the evaluation. In future reports, we will examine the impact of the demonstration on health care utilization, quality, and costs, using claims data and information submitted by CCBHCs and states. In August 2019, we will submit a separate report that summarizes states' and clinics' experiences with the required quality measures (based on interview and site visit data) and costs (using data from the CCBHC cost-reporting template).[7]
II. METHODS
The findings in this report are based on: (1) responses to progress reports each clinic completed in spring 2018 and 2019; (2) three rounds of interviews with state Medicaid and behavioral health officials; and (3) site visits to clinics in four demonstration states.
CCBHC progress reports. In spring 2018 (Demonstration Year 1 [DY1]), clinics submitted an online progress report that included information about their staffing, training, accessibility of services, scope of services, electronic health record (EHR)/health information technology (HIT) capabilities, care coordination activities, and relationships with other providers. Clinics submitted a second progress report in spring 2019 to report on Demonstration Year 2 (DY2) activities (the 2018 and 2019 progress report templates appears in Appendix B). Questions in the DY2 progress report were almost identical to those in the DY1 progress report, with a few minor changes to streamline data collection for clinics and update the timeframes referenced by the questions. In collaboration with the CCBHC demonstration program leadership in each state, we conducted extensive outreach to clinic leaders via telephone and email before and during collection of the progress reports to encourage clinics' participation and answer any questions. In 2018, all 67 participating clinics completed the progress report. In 2019, the remaining 66 clinics completed the report. At both time points, all participating CCBHCs completed the progress reports--a 100 percent response rate.[8] Unless otherwise noted, the 2018 and 2019 findings in this report are based on the number of clinics participating in the demonstration at the time of data collection each year (67 CCBHCs in 2018, and 66 CCBHCs in 2019 respectively).
We computed descriptive statistics (for example, means, percentages) by using Excel and SAS to analyze the clinic progress report data. We summarize findings across all clinics and within each state. However, readers should interpret state-level variation in the findings cautiously, given that some states such as Nevada and Oklahoma account for a small number of clinics participating in the demonstration (n = 3 each), whereas others, such as New York and Missouri, have over a dozen clinics. In addition, the service systems and policy context in which clinics operate vary considerably across states, posing a challenge to direct cross-state comparisons. Finally, although we compare across the first and second demonstration years across similar items, we focus in this report on the status of implementation as of March 2019 (three months prior to the end of DY2), when the clinics submitted their second progress reports to us. CCBHCs have also continued to make changes and implement new programs and procedures since completion of the progress reports as they approach the end of the demonstration period; thus, the progress report findings reported here do not capture the most recent developments.
Telephone interviews. We conducted three rounds of telephone interviews with state behavioral health and Medicaid officials involved in leading implementation of the CCBHC demonstration in each state. We conducted the first round of interviews early in DY1--September and October 2017. We conducted the second round from February to March 2018 and the third round from February to April 2019. The first round of interview questions gathered information about early implementation, decisions made during the demonstration planning phase, early successes and challenges in fulfilling the certification requirements and following the data collection and monitoring procedures, and projected challenges or barriers to successful implementation. The second round of interviews gathered information on interim successes and challenges since the initial interview; successes in implementing demonstration cost-reporting procedures and quality measures; and early experiences with the PPS systems. The third round of interviews collected information on implementation successes and challenges in the second demonstration year. The interview guides for each round appear in Appendix C.
We conducted 29 state official interviews (ten interviews during the first two rounds and nine during the third). In seven states, the behavioral health and Medicaid officials asked to participate in the interviews together to reduce scheduling burden and provide comprehensive answers.[9] Each state interview required approximately 90 minutes. In the third round, we also conducted interviews with consumer and family representative organizations in four states in order to gather the perspective of consumers and families on the demonstration.
Two researchers conducted each interview, with one leading the interview and one taking notes. We asked interviewees' permission to audio record the discussions for purposes of confirming the accuracy and completeness of interview notes. Following the interviews, to expedite analysis, we organized the interview information into categories defined by the CCBHC certification criteria. We summarized interviewees' responses about implementation experiences within each domain of the certification criteria covered by this report (that is, staffing; access to care; scope of services; care coordination) separately for each state and then identified cross-state themes in the findings.
Site visits. We conducted site visits to two clinics in each of four demonstration states in February and March 2018. In collaboration with ASPE, we selected the four states to visit: Missouri, Oklahoma, Oregon, and Pennsylvania.[10] Using information from clinic responses to the progress report and interview transcripts, we selected two clinics within each state to visit that varied in terms of the following characteristics: urban-rural designation, location and proximity to other CCBHCs, size and number of CCBHC service locations, implementation of intensive team-based supports, Assertive Community Treatment (ACT), medication-assisted treatment (MAT), and any innovative engagement strategies or mobile/community-based supports that clinics' reported in their progress reports or that we learned about during interviews with state officials. During the site visits, we conducted in-depth discussions with clinic administrators and frontline clinical staff about how care has changed following implementation of the demonstration. Interview topics included successes and barriers related to CCBHC staffing, steps clinics have taken to improve access to care and expand their scope of services, CCBHCs' experience with payments and the PPS, and quality reporting practices. The interview guides for each staff type appear in Appendix D. We asked interviewees' permission to audio record the discussions to facilitate our analysis. Following the interviews, we organized the interview information into categories defined by the CCBHC certification criteria to facilitate analysis and to develop the clinic profiles in Chapter III.
III. IMPLEMENTATION FINDINGS
This chapter updates interim findings on the implementation of the demonstration presented in our June 2018 report to incorporate data gathered through April 2019. The chapter presents findings on implementation progress, successes, and challenges with respect to CCBHC staffing (Chapter III.A), access to care (Chapter III.B), scope of required services (Chapter III.C), and care coordination (Chapter III.D).
A. Staffing
The certification criteria require CCBHCs to maintain staff appropriate to providing comprehensive behavioral health care. The criteria include some specific staffing requirements; for example, clinics are required to have a psychiatrist serving in the role of medical director[11] as well as the following staff: a medically trained behavioral health care provider who can prescribe and manage medications independently under state law; credentialed SUD specialists; and individuals with expertise in addressing trauma and promoting the recovery of children and adolescents with SED and adults with SMI and/or SUD. However, the certification criteria allow states flexibility to develop more detailed plans for appropriately staffing CCBHCs according to their existing systems of licensure and accreditation and based on the needs of the populations served by the states' CCBHCs. The criteria provides examples of CCBHC staff types states could require, including the following: (1) psychiatrists (including child, adolescent, and geriatric psychiatrists); (2) nurses trained to work with consumers across the lifespan; (3) licensed independent clinical social workers; (4) licensed mental health counselors; (5) licensed psychologists; (6) licensed marriage and family therapists; (7) licensed occupational therapists; (8) staff trained to provide case management; (9) peer specialists/recovery coaches; (10) licensed addiction counselors; (11) staff trained to provide family support; (12) medical assistants; and (13) community health workers.[12] The certification criteria also require CCBHCs to provide staff training in a variety of topics, including provision of culturally competent care, patient-centered care, risk assessment, suicide prevention, and suicide response.
This section of the report summarizes: (1) the types of staff that clinics hired; (2) the challenges that clinics encountered in maintaining the required staff during the demonstration; and (3) the types of training that CCBHC staff received since the demonstration's outset.
1. What Types of Staff did CCBHCs Hire as a Result of Certification?
CCBHCs employed a wide variety of clinical staff before the demonstration. As shown in Figure III.1, before CCBHC certification, most clinics employed licensed clinical social workers (LCSWs), SUD specialists, nurses, a medical director, bachelor's degree-level counselors, case managers, adult psychiatrists, peer specialists/recovery coaches, and child/adolescent psychiatrists. However, before CCBHC certification, fewer clinics employed family support staff, community health workers, interpreters or linguistic counselors, occupational therapists, and mental health professionals trained and credentialed to provide psychological testing.
Interviews with state officials suggested that variation across clinics in the types of staff that they employed before the demonstration was related in part to the types of services the clinic historically provided. For example, before the demonstration, the CCBHCs in Nevada focused primarily on the delivery of treatment for SUD, whereas the CCBHCs in New York primarily provided services for mental health disorders. Consequently, Nevada's CCBHCs had relatively few mental health providers on staff before the demonstration, whereas New York's CCBHCs employed a broad range of mental health providers but fewer substance use treatment providers.
Officials across all states reported that clinics were able to ramp up quickly and begin hiring staff as the demonstration began; they succeeded in filling the required staff positions in the first demonstration year. Officials in one state, for example, noted that its clinics created and filled 167 new staff positions during the demonstration's first year. Accordingly, as of March 2018 (DY1 Progress Report), the majority of clinics reported employing staff to fulfill the following positions, which are required or recommended in the certification criteria:
-
Ninety-nine percent of clinics (n = 66) reported employing a CCBHC medical director compared to 82 percent (n = 55) before certification (Figure III.1). Ninety-one percent of clinics (n = 61) reported employing a psychiatrist as medical director (not shown in Figure III.1). In the few clinics that did not have psychiatrists as medical directors, clinics hired psychiatric nurse practitioners to fulfill the role of director, as permitted by the CCBHC criteria when psychiatrists are unavailable because of workforce shortages.
-
Ninety-one percent of clinics (n = 61) employed adult psychiatrists compared to 70 percent (n = 47) before certification.
-
Seventy-six percent of clinics (n = 51) employed child/adolescent psychiatrists compared to 58 percent (n = 39) before certification.
-
All clinics employed SUD specialists compared to 91 percent (n = 61) before certification.
After the certification process, a substantially larger proportion of CCBHCs employed case managers, peer specialists/recovery coaches, child/adolescent psychiatrists, and family support workers in DY1 than before certification. For example, 69 percent of clinics (n = 46) employed peer specialists/recovery coaches before certification; by DY1, however, almost all did so (n = 66; 99 percent) (Figure III.1). Likewise, only 37 percent (n = 25) of clinics employed family support staff before certification, but 67 percent (n = 45) did so in DY1. In contrast, the proportion of clinics that employed LCSWs, bachelor's degree-level counselors, and mental health professionals trained and credentialed for psychological testing before the demonstration did not change substantially as a result of certification. These findings varied somewhat across states, given differences in the treatment focus of CCBHCs before the demonstration (state-level findings appear in Appendix Table A.2).
In several open-ended questions in the progress report, clinics reported that they hired specific types of nurses and other clinical staff as part of the certification process (not shown in Figure III.1). For example, in DY1:
-
Fifty-eight percent of clinics (n = 38) hired registered nurses (RNs), especially RNs with psychiatric experience (n = 11; 16 percent of CCBHCs).
-
Thirteen percent of clinics (n = 9) hired nurses with SUD experience (one clinic reported hiring a nurse with experience in providing MAT for SUD).
-
Fifty-five percent of clinics (n = 37) reported hiring "other clinician types." The most common of these other staff types were licensed professional counselors (n = 10; 15 percent of clinics), qualified mental health professionals or licensed mental health counselors (n = 7; 10 percent of clinics),[13] and licensed master social workers (n = 5; 8 percent of clinics).
In interviews, officials in several states suggested that the enhanced payment rates provided as part of the PPS may have played an important role in helping CCBHCs build their provider workforce by allowing CCBHCs to offer higher salaries and hire different types or greater numbers of staff than they previously had the capacity to employ. Officials in three states reported that the enhanced payment rates under the PPS were especially helpful in hiring and retaining psychiatrists. The rates allowed clinics to offer higher salaries and better benefits than those offered by other potential employers.
State officials suggested that experiences in hiring and maintaining required staff may also have varied somewhat by geographic designation (i.e., urban versus rural areas), noting that hiring in rural communities proved more challenging, but that clinics have developed creative solutions to rural hiring challenges. For example, officials in Nevada commented that the flexibility to employ interns and cultivate a preprofessional student workforce has been helpful to CCBHCs operating in the state's rural areas. According to state officials, these rural clinics have been able to provide training, supervision, and experience to social work students and then retain those students in their workforces after graduation.
|
CCBHC Spotlight: Nurses as Key Players to Address Medical Issues in CCBHCs |
||
|---|---|---|
|
A rural CCBHC provides outpatient behavioral health services to a large number of homeless and uninsured individuals. In addition to providing the required CCBHC services, the clinic's behavioral health staff collaborate with an on-site FQHC--in a non-DCO relationship--to provide clients with access to physical health care. Before the demonstration, the clinic had one nurse on staff who served a subset of the clinic's clients. When the clinic became a CCBHC, it hired four RNs and one licensed practical nurse, and restructured and expand the nurse role to provide primary care screening and monitoring (CCBHC Requirement 4.a.1), on-site primary care services, and to coordinate physical health care with external providers. A primary focus of the nurse role under the demonstration also is to provide education to behavioral health staff on physical health topics. Clinic leadership reported that the PPS reimbursement model allowed the clinic to hire additional nursing staff, and remarked that adding nurses to the care team was "one of the biggest successes of the CCBHC demonstration."
Under the demonstration, each nurse partners with a psychiatrist in the clinic to collect labs and complete nursing assessments to collect clients' vitals and history when clients attend psychiatric appointments. Clinic leadership explained that the nurse is strategically placed with the psychiatrist as a way to encourage clients to address their physical health. The nurse introduces primary care services to clients and helps then overcome any fear or mistrust of primary care providers. Behavioral health providers and clinic leadership value the nurses in that they provide access to physical health services for clients who otherwise might not have considered engaging in physical health care. Nurses at this CCBHC also provide care coordination services for clients who receive physical health services outside of the clinic. For these clients, the nurse obtains permission from the client and calls the external provider's office to discuss plans for behavioral and physical health care and to review labs. Nurses also refer clients to medical specialists and follow up with clients to ensure that they completed the referral. If a client visits an emergency department or is hospitalized, the clinic's transition team notifies the nurse, who calls the client to review discharge instructions and medication changes, and to schedule a follow-up appointment.
The nursing staff also provides training to behavioral health providers at the CCBHC. The clinic implemented a "nurse college," a 16-week program that educates behavioral health staff on common chronic physical illnesses in the client population. One nurse explained the goal of the one-hour sessions as follows: "To introduce the clinical staff to the physical side of the clients and explaining the disease process, like diabetes and upper respiratory diseases." Behavioral health staff and clinic leadership believe that the nurse college complemented and enhanced the program's existing training opportunities and encouraged behavioral health staff to consider their clients' physical health issues and address them with their clients. CCBHC behavioral health staff also view the nurse as a valuable resource for consultation on clients' medical needs. According to behavioral health providers, the presence of nurses on-site provided staff with access to physical health expertise and reduced the burden of having to address all of the clients' concerns alone. As one provider noted, "I don't need to know everything about diabetes, I have a team I can connect you to. I can walk to a nurse and tell them I am worried about this person. Doesn't have to be my scope of practice, I just know what path to go to." One therapist echoed the sentiment, remarking that "We don't feel like we have to [address physical health needs] on our own...I can utilize the nurses. That's the great change from me being here before CCBHC." |
2. Have CCBHCs Maintained Required Staffing?
Officials across all demonstration states indicated that CCBHCs generally succeeded in meeting and maintaining the required types of staff throughout the demonstration, noting few instances of clinics struggling to sustain at least the minimum staffing requirements. Consistent with state officials' perceptions, there was no substantial difference between DY1 and DY2 in the proportion of clinics that employed the following staff types: LCSWs, nurses, associate's degree-level or non-degree counselors, case management staff, peer specialists/recovery coaches, licensed psychologists, other clinician types, mental health professionals, family support staff, and community health workers (Figure III.1).
However, fewer clinics employed the following types of staff in DY2 compared with DY1:
-
SUD specialists (92 percent of clinics in DY2 versus 100 percent in DY1).
-
CCBHC medical directors (91 percent in DY2 versus 99 percent in DY1).
-
Adult psychiatrists (82 percent in DY2 versus 91 percent in DY1), child/adolescent psychiatrists (64 percent in DY2 versus 76 percent in DY1), and other psychiatrists (47 percent in DY2 versus 60 percent in DY1).
-
Licensed psychologists (44 percent in DY2 versus 52 percent in DY1).
-
Interpreters or linguistic counselors (30 percent in DY2 versus 43 percent in DY1) and community health workers (35 percent in DY2 versus 40 percent in DY1).
-
Occupational therapists (17 percent in DY2 versus 25 percent in DY1).
CCBHCs continued to report a few ongoing challenges related to hiring and retaining staff. In DY2, 76 percent (n = 50) of clinics reported that at least one position in the required staff categories was vacant for at least 2 months during the past 12 months, a small increase of 4 percentage points from DY1. This finding was generally consistent across states (state-level findings appear in Appendix Table A.3). Clinics most frequently reported vacancies for the following positions: adult and child/adolescent psychiatrists, peer support staff/recovery coaches, SUD specialists such as licensed alcohol and drug abuse counselors, and LCSWs. (These findings were similar to findings from the DY1 progress reports.) However, in 2019, clinics reported several additional staff types as being difficult to fill, especially nursing staff and licensed professional counselors.
State officials universally echoed the responses to the clinic progress report, noting that psychiatrists were the most challenging to recruit and retain; officials also noted difficulties in hiring and maintaining the following staff types: licensed psychologists and clinical social workers, licensed alcohol and drug counselors, and peers. Officials shared that the licensure requirements and credentialing processes associated with these types of licensed staff often made it more difficult to find and onboard qualified providers than other non-licensed or credentialed staff types. Officials suggested that these staffing challenges may be related to the relative scarcity of these types of providers across the states, with the challenges particularly acute in rural and frontier communities. In addition, officials in all demonstration states remarked that, even though clinics generally were able to hire and maintain staff in the required positions, they often struggled to hire and retain enough of each staff type to meet the increased demand for clinics' services created by the demonstration. One state official in Minnesota noted that clinics "all had staffing plans in place based on their needs assessments, but there were some clinics that had increased demand beyond what their expectations were and then they needed to start hiring more staff."
| FIGURE III.1. Proportion of CCBHCs that Employed Specific Types of Staff before Certification and in March 2018 (DY1) and March 2019 (DY2) |
|---|
 |
| SOURCE: CCBHC Annual Progress Report Demonstration Year 1 and Year 2 data collected by Mathematica and the RAND Corporation, March 2018 and March 2019. NOTES: Denominator is 67 CCBHCs for "Proportion of CCBHCs that employed staff type before certification" and March 2018 findings, and 66 CCBHCs for March 2019 findings. See Appendix Table A.1 for detailed findings and number of clinics corresponding to the percentages. See Appendix Table A.2 for state-level findings. These findings were generally consistent across states, with the exception of Minnesota and Pennsylvania, where the proportion of clinics employing each type of staff did not decrease from 2018 to 2019. Consistent with the CCBHC cost-reporting template, the mental health professional category includes only providers trained and credentialed for psychological testing. "Other clinician types" is a write-in category. |
In both the DY1 and DY2 progress reports, clinics described a variety of reasons for experiencing difficulty in hiring and/or retaining staff. The most common included: (1) rural or remote CCBHC locations; (2) the inability to meet salary expectations; (3) regional and state workforce shortages, especially in behavioral health; and (4) competition with other health care facilities such as hospitals and non-profit and for-profit health systems (not reported in the DY1 progress reports). Officials in three states echoed the issue of competition. For example, one official commented that "we still have some clinics that have competition with other health care systems or industries in the area and have trouble filling positions. One area in particular has hospitals, prisons, and other social service entities which are all very hard to compete with."
In the second year of the demonstration, officials in all but one state cited uncertainty around the future of the demonstration as the most significant staffing challenge for clinics. Drawing on feedback from the clinics, officials reported that the uncertainty has adversely affected their ability to retain staff and maintain workforce morale as the demonstration draws to a close. Concerns about the effects of uncertainty on staff appeared most acute in states that have not developed a plan to sustain components of the demonstration, although state officials nearly unanimously voiced the same concern. Officials in two states that are working to continue parts of the demonstration mentioned that, even though clinics have maintained the required staffing, clinic leaders have been reluctant to add new positions or fill vacancies occasioned by turnover for fear of not being able to sustain those staff positions after the demonstration concludes.
Staffing challenges cited by state officials differed somewhat in DY2 from those in DY1, and across states. In the earlier year, officials cited long-standing workforce issues, such as staff turnover and low compensation for public sector mental health positions, as the primary challenges to maintaining CCBHC staffing requirements. These officials viewed turnover not only as a barrier to CCBHC implementation but also as a more general and pervasive issue across states' behavioral health systems. During the demonstration's second year, state officials cited some specific factors associated with the CCBHC model that may have positively or negatively affected staff turnover. Two state officials perceived that increases in caseloads as a result of the expansion of services and client outreach were unmanageable and led to staff burnout. Officials also noted that the more comprehensive and collaborative nature of the CCBHC model required shifts in staff responsibilities and culture that may have led some staff to seek employment elsewhere. In contrast, officials in other states suggested that the CCBHC model had significantly reduced turnover by allowing clinics to offer improved benefits and salaries.
State officials outlined several strategies adopted by clinics to address ongoing staffing challenges. For example, officials in four states reported that a primary strategy employed by clinics throughout the demonstration was to offer enhanced salaries, noting that the offer was possible only because of increased funding under the demonstration's PPS. One official noted that "one of the CCBHCs had been able to be more successful because they finally realized that they had to pay more. And once that clinic did, they all started paying more. The CCBHCs were stuck in the [pre-demonstration] mentality that 'we can't afford to pay it' but realized that, in order to staff up as quickly as necessary and stay staffed up, we're going to have to increase salaries. And because of the PPS, they did." Officials highlighted several other strategies that clinics have used to combat staffing challenges in the second demonstration year, including the following:
-
Relying on telehealth to fill gaps and extend staff reach while seeking additional staff (in progress reports, three clinics mentioned the addition of telehealth positions to their staff in order to address staffing challenges, especially telepsychiatry).
-
Engaging recruiters to advertise to and hire professionals from out of state.
-
Engaging the state's credentialing board to share job announcements with all credentialed providers in the state.
3. What Training have CCBHC Staff Received?
All clinics reported that, in the past 12 months, they provided at least one of the types of staff training required by the CCBHC criteria. In DY2, all clinics (n = 66) had provided training in the past 12 months in risk assessment, suicide prevention, and suicide response, and nearly all had provided training in evidence-based and trauma-informed care (95 percent, n = 63) and cultural competency (91 percent, n = 60) (Table III.1). For most of the training types listed in Table III.1, the proportion of CCBHCs that reported providing the training in the DY2 progress report was similar to that in DY1, except for risk assessment, suicide prevention, suicide response, and person-centered and family-centered care, all of which increased by more than a few percentage points.
| TABLE III.1. CCBHC Staff Training in Required and Other Topics | ||||
|---|---|---|---|---|
| Topic of Training | CCBHCs that Provided Training in Past 12 Months, March 2018 (DY1) |
CCBHCs that Provided Training in Past 12 Months, March 2019 (DY2) |
||
| N | % | N | % | |
| Required by CCBHC certification criteria | ||||
| Risk assessment, suicide prevention, and suicide response | 62 | 93 | 66 | 100 |
| Evidence-based and trauma-informed care | 61 | 91 | 63 | 95 |
| Cultural competency training to address diversity within the organization's service population | 59 | 88 | 60 | 91 |
| The role of family and peers in the delivery of care | 52 | 78 | 51 | 77 |
| Person and family-centered care | 51 | 76 | 56 | 85 |
| Recovery-oriented care | 51 | 76 | 51 | 77 |
| Primary and behavioral health care integration | 51 | 76 | 52 | 79 |
| Other training (not required by CCBHC certification criteria) | ||||
| Other (see Table III.2) | 40 | 60 | 38 | 58 |
| Any training listed abovea | 66 | 99 | 66 | 100 |
| No training | 1 | 1 | 0 | 0 |
| Total CCBHCs | 67 | 100 | 66 | 100 |
| SOURCES: CCBHC Annual Progress Report Demonstration Year 1 and Year 2 data collected by Mathematica and the RAND Corporation, March 2018 and March 2019. NOTES: See Appendix Table A.4 for state-level findings. The proportion of clinics that provided each type of training varied across states to some extent, but the proportion within each state was relatively consistent from March 2018 to March 2019, except for in New Jersey, where it appeared that a larger proportion of clinics delivered various types of training in 2019 compared with 2018.
|
||||
Clinics reported that they provided a diverse range of non-required "other" trainings. In DY2, the most commonly reported non-required trainings included (Table III.2) motivational interviewing (an evidence-based practice [EBP] included in the CCBHC criteria) (18 percent of CCBHCs, n = 12); training focused on serving veterans and "military culture" (14 percent, n = 9); and training in two other EBPs, cognitive behavioral therapy (CBT) (9 percent, n = 6) and MAT (8 percent, n = 5). Clinics delivered training in these most commonly delivered non-required topics in the previous year, though at lower rates except for training in serving veterans and "military culture," which 22 percent of clinics (n = 15) provided as of DY1, a decrease of 8 percentage points from DY1 to DY2. Finally, 5 percent of clinics (n = 3) offered training in disaster preparedness and response in DY1 while no clinics reported offering such training in DY2.
| TABLE III.2. CCBHC Staff Training in Non-Required "Other" Topics | ||||
|---|---|---|---|---|
| Topic of "Other" Training | CCBHCs that Provided "Other" Training, March 2018 (DY1) |
CCBHCs that Provided "Other" Training, March 2019 (DY2) |
||
| N | % | N | % | |
| Motivational interviewinga | 7 | 10 | 12 | 18 |
| Serving veterans and "military culture" | 15 | 22 | 9 | 14 |
| CBTa | 6 | 9 | 6 | 9 |
| MATa | 3 | 5 | 5 | 8 |
| Ethics | 2 | 3 | 5 | 8 |
| DBTa | 2 | 3 | 5 | 8 |
| Trauma-informed care | 4 | 6 | 4 | 6 |
| Serving LGBTQ individuals | 1 | 2 | 3 | 5 |
| Eye movement desensitization and reprocessing | 3 | 5 | 2 | 3 |
| Disaster preparedness and response training | 3 | 5 | 0 | 0 |
| Total CCBHCs | 67 | 100 | 66 | 100 |
| SOURCE: CCBHC Annual Progress Report Demonstration Year 1 and Year 2 data collected by Mathematica and the RAND Corporation, March 2018 and March 2019. NOTE:
|
||||
States provided ongoing support for CCBHC staff training as the demonstration was implemented. In preparation for and throughout the demonstration's implementation, all states developed structured networks for regular communication with their CCBHCs to identify gaps in knowledge and provide formal and informal training and support activities. State officials viewed such efforts as essential in identifying and responding to emerging training needs.
In the demonstration's first year, officials from all states reported that they held regular meetings with CCBHCs during the early stages of implementation to identify and address CCBHC training and technical assistance needs. As one official stated, "Training topics have covered the entirety of the CCBHC project." Officials described state-led trainings for CCBHC clinical and administrative staff in the following topics:
-
CCBHC certification requirements.
-
Best practices such as trauma-informed care and motivational interviewing.
-
Serving special populations such as children, high school students, or veterans.
-
Regulations regarding licensing for clinicians, including peer specialists.
-
PPS.
-
Billing, quality measure reporting, cost-reporting (for example, Pennsylvania required CCBHCs to complete a test run of their cost reports six months into the first demonstration year to ensure that clinic administrative staff would be able to complete the forms for the official deadline at the end of 12 months).
In the second demonstration year, officials reported that much of the training offered by states and clinics took place during the initial stages of the demonstration, noting that, by the second year, states exhibited less focus on formalized training. One state official mentioned feedback from clinics as a primary impetus for tapering training, remarking that "clinics have been giving the state a lot of feedback that they are 'trained out' when the state asks if they want more. They had to do an enormous amount of staff training in the first year to satisfy the criteria and now they're burned out on training. Because of that feedback, we ourselves as a state have been focusing on exploring what it takes to change practice and what could we be implementing rather than continuing to throw required training at [the CCBHCs]." Officials in two other states commented that, even though their states had reduced the number of training opportunities offered to CCBHCs and clinic staff, state demonstration leadership have continued to identify and alert clinic leadership to external training opportunities for their staff.
B. Access to Care
The certification criteria specify that CCBHCs must provide accessible care, including 24-hour crisis management services; engage consumers quickly through prompt intake services; and treat all consumers, regardless of their ability to pay. This section summarizes states' projections for the number of individuals to be served by the demonstration and describes the activities that states and CCBHCs have undertaken to expand access to care.
1. How many Medicaid (including dually eligible) Beneficiaries did CCBHCs Expect to Serve in the First Demonstration Year, and How Many were Served?
In DY1, officials in all but two of the demonstration states expected that, during the demonstration's first year, CCBHCs would serve the number of consumers as originally projected. State officials in New Jersey and Oregon reported in DY1 that, based on the lower-than-expected number of consumers that CCBHCs served in the first two quarters of the demonstration, the number of consumers served during the demonstration's first year would likely be lower than originally envisioned. Table III.3 summarizes states' projections at the beginning of the demonstration, the projected changes at the demonstration's mid-point (2018), and, drawing on interviews with state officials in 2019, actual beneficiaries served in the first demonstration year. While states generally reported that clinics were on track to serve expected or fewer than expected numbers of consumers, in interviews some states reported that certain clinics experienced higher than anticipated volume which stretched resources and staff.
| TABLE III.3. Projected and Actual CCBHC DY1 Enrollment | |||||
|---|---|---|---|---|---|
| State | State Population (in millions) |
Number of CCBHCs | DY1--Total Projected CCBHC Consumers to Receive CCBHC Services (all pay sources) |
DY1--Projected CCBHC Consumers Who Were Medicaid Beneficiariesa |
Actual Number of Consumers Served in DY1 |
| Minnesota | 5.52 | 6 | 17,600 | 15,000 | 20,000b (15,000 Medicaid) |
| Missouri | 6.09 | 15 | 127,083 | 87,284 | 86,002 (55,362 Medicaid) |
| Nevada | 2.94 | 3c | 7,305 | 5,844c | 2,312 Medicaidd |
| New Jersey | 8.94 | 7 | 79,782 | 50,882 | 79,800 (9,500 Medicaid)e |
| New York | 19.75 | 13 | 40,000 | 32,000 | 49,301f |
| Oklahoma | 3.92 | 3 | 23,076 | 11,077 | 16,836f |
| Oregon | 4.09 | 12 | 61,700 | 50,000 | 52,911 (32,859 Medicaid) |
| Pennsylvania | 12.80 | 7 | 24,800 | 17,800 | 19,190f |
| SOURCE: Table 5 in Certified Community Behavioral Health Clinics Demonstration Program, Report to Congress, 2017. Mathematica/RAND obtained information for the "Changes to Projected Total CCBHC Consumers" during interviews with state officials in March 2018 and for actual Medicaid beneficiaries during interviews with state officials in March 2019. NOTES:
|
|||||
2. What Steps have the CCBHCs and DCOs Taken to Increase Access to Care?
CCBHCs have worked to make services more convenient and tailored to the needs of specific populations. According to state officials, one of the most common ways clinics have enhanced access to care is to institute open-access scheduling, or same-day scheduling, which is a scheduling method that allows all clients to receive an appointment on the day they request one. Officials in five states mentioned that most or all CCBHCs in their state have now adopted open-access scheduling. One state official in Nevada noted that CCBHCs instituted open-access scheduling because "the clinics acknowledge that it is important to meet the client in a moment of need and be able to start to establish services so that the client doesn't leave and never come back." State officials pointed to several other positive effects of open-access scheduling, such as the elimination of wait lists and a reduction in the burden on other external community resources. As one official in Missouri remarked, "People are able to have same-day access in areas where that has never before been possible, and in turn the access reduces the burden on hospitals, emergency departments, and law enforcement. People getting into CCBHC services quickly is a big deal."
|
CCBHC Spotlight: Availability and Accessibility of Services: "Meet the Client Where They're At" |
||
|---|---|---|
|
This CCBHC is a rural behavioral health center that provides outpatient behavioral health services and includes medical nursing staff on its care teams. The clinic serves a primarily Medicaid-covered or Medicaid-eligible population that experiences challenges such as homelessness and transportation barriers in addition to mental and substance use disorders. The clinic created an open-access scheduling policy to enhance the availability and accessibility of services as required under the demonstration. Specifically, the clinic modified its scheduling system to accommodate open-access times between scheduled appointment slots. To support the effort, the clinic made at least one therapist available each day to conduct intake assessments and created same-day appointment slots for services. This arrangement allowed potential and existing clients to walk in or call when they were ready to seek help. Clinic leadership credited the PPS with facilitating these changes. Under the demonstration, the clinic developed a systematic process that streamlines client enrollment into services. Potential clients who walk into the clinic meet with a referral coordinator who conducts a preliminary screening and then connects the client to a therapist to complete the intake assessment. For clients who contact the clinic by telephone, a referral coordinator screens such clients and then schedules an intake within one week of the initial contact; the clinic reported that intake often takes place within 1-2 days. A therapist then meets with the client for a full intake session, including a drug and alcohol assessment, evaluation of case management needs, and a review of physical health conditions.
Once a client is enrolled in services, the clinic fosters access and ongoing engagement by providing services in a variety of locations. For example, case managers and peer specialists meet with clients in their homes or at community locations. In addition, clinic therapists provide services to youth in schools with three groups per week at no cost to those receiving services. Care management staff explained that they occasionally provided community-based services before the clinic became a CCBHC, but, under the demonstration, they increased their efforts to "meet the client where they're at." Staff stressed that service provision in the community allowed them to establish more trusting relationships with clients while providing opportunities for better understanding clients' family and living environments, which staff would not have fully appreciated if they saw clients only in the clinic. As part of the demonstration, the clinic also made group therapy sessions available during evenings and weekends. Before the demonstration, the clinic opened Monday through Friday during business hours. Clinic leaders reported that the change in business hours have been positive, but not without some challenges. Clinic leadership reported that the availability of services beyond business hours required a cultural adjustment among staff members, who were reluctant to provide services on evenings and weekends. Likewise, clinic leaders reported that clients perceived that attending treatment outside normal business hours "took up their weekend." Staff expressed concern when clients did not use the available services. According to one staff member, "Very few have come even though we have expressed the availability of the services. It has felt like we are begging people to come on Saturdays because we're trying to build that piece out."
Overall, clinic staff and leadership acknowledged the benefits of enhancing service accessibility and availability. Clinic leadership explained that clients are more likely to engage in treatment if they can begin receiving services when they seek help. Clinic leadership and staff perceived that becoming a CCBHC helped optimize client readiness by initiating enrollment immediately rather than scheduling it several weeks out, thereby allowing staff to provide more services in the community. |
In addition to same-day appointments, officials in three states suggested that the demonstration's requirements for extended service hours have significantly enhanced access for CCBHC clients in their states, noting that CCBHCs further tailored their extended hours and after-hours availability according to the needs expressed by clients and the client service use patterns in the demonstration's second year. Some respondents suggested that clients at some clinics did not take advantage of required extended service hours to the extent they expected, and clinics made changes to their availability to meet clients' needs while fulfilling the requirement. For example, an official in Minnesota said that "maybe they realized [in DY1] that having evening or Saturday hours, that wasn't working, so they moved to just have it on an on-call basis...the program intent was being met, but it wasn't necessarily that they have set [extended] hours."
Similarly, officials in two states mentioned that, as a key strategy for increasing the CCBHC population's access, clinics now schedule more frequent and shorter appointments for high-need consumer populations. For example, officials in Missouri reported that, since the demonstration's launch, community support specialists or intensive case managers at CCBHCs schedule frequent (e.g., several times per week) 30-minute sessions with consumers with SMI and youth with SED in order to target specific problems. Officials reported that CCBHCs expect that these frequent, brief visits will reduce crises as well as the use of emergency services among these populations. Officials in two states also indicated that the demonstration has had a major effect on access by streamlining the initial assessment processes and reducing intake and wait-times for the initial evaluation. An official in Minnesota, for instance, reported that initial evaluations occurring within ten days as required by the demonstration are simply "earth-shattering in the mental health world" and facilitate consumer engagement from the outset.
To meet the certification criteria, most clinics made changes to their physical space as a result of the demonstration (in the DY1 progress report) and/or in the past 12 months (in the DY2 progress report). The certification criteria require CCBHCs to provide a safe, functional, clean, and welcoming environment conducive to service provision. Changes to the physical structure of the clinic may facilitate access to care for certain populations, such as those with physical disabilities. Clinics in all states reported that they undertook some type of renovations to their physical space in DY1 and DY2. As summarized in Table III.4, the most common changes to their physical space included the following:
-
Forty-eight percent of clinics (n = 32) in DY2 and 49 percent (n = 33) in DY1 reported expanding the CCBHC building space.
-
Sixty-four percent (n = 42) in DY2 and 67 percent (n = 45) in DY1 reported renovating existing facilities.
-
Fifty-two percent (n = 34) in DY2 and 40 percent (n = 27) in DY1 reported making improvements to facility safety features, such as installing defibrillators and accessible bathrooms.
Almost one-fourth of clinics (n = 15 in each year) reported making "other changes" to their physical space in DY1 or DY2. The most commonly cited "other changes" in DY1 were: (1) improving the physical space to accommodate new CCBHC care features, such as adding physical health examination rooms, improving the space for child and adolescent consumers, and expanding office space for new staff such as peers and case managers (33 percent of the 15 clinics; n = 5); and (2) creating dedicated space for ambulatory detoxification services (13 percent of the 15 clinics; n = 2) (not shown in table). In the DY2 progress report, CCBHCs also reported the reasons for making these "other changes," including: (1) moving to new locations or new buildings in existing locations (40 percent of the 15 clinics; n = 6); (2) making improvements to the aesthetic look and feel of CCBHC facilities to improve the client experience (20 percent of the 15 clinics; n = 3); and (3) making improvements to staff workspaces (13 percent of the 15 clinics; n = 2). In the DY2 progress report, one CCBHC also reported undertaking construction for an FQHC in order to open a primary care clinic on-site.
All CCBHCs reported that they provided translation services in DY2, representing an increase from DY1 when nearly all clinics (96 percent, n = 64) reported providing translation services. As in DY1, almost all clinics reported that they offered translation services through an external interpreter contract in DY2--usually telephonic interpreting services. One clinic provided translation services through DCO contracts in DY2, a change from DY1, when no translation services were provided through DCOs. State-level findings appear in Appendix Table A.5. These findings are consistent with changes in staffing from DY1 to DY2. As noted in Chapter III.A, fewer clinics directly employed interpreters or linguistic counselors in the second demonstration year, which may suggest that some clinics determined that external contracts for such services were more appropriate and feasible.
| TABLE III.4. Changes to CCBHCs' Physical Space | ||||
|---|---|---|---|---|
| Change to Physical Space and Accessibility |
Number and Proportion of CCBHCs that Made Changes, 2018 |
Number and Proportion of CCBHCs that Made Changes, 2019 |
||
| N | % | N | % | |
| Expansions or additions to the CCBHC building space | 33 | 49 | 32 | 48 |
| Renovations to existing CCBHC facilities | 45 | 67 | 42 | 64 |
| Improvements to facility safety features | 27 | 40 | 34 | 52 |
| Other changes to CCBHC physical space | 15 | 22 | 15 | 23 |
| Total CCBHCs | 67 | 100 | 66 | 100 |
| SOURCE: CCBHC Annual Progress Report Demonstration Year 1 and Year 2 data collected by Mathematica and the RAND Corporation, March 2018 and March 2019. NOTE: See Appendix Table A.5 for state-level findings. |
||||
Almost all CCBHCs provided transportation services or transportation vouchers in DY1 and DY2 (n = 60), representing about 90 percent of clinics in each year. Clinics in both years reported that they provided transportation through bus or cab vouchers, via care manager or peer support, directly in CCBHC-owned vehicles, and by helping consumers obtain the Medicaid transportation benefit (if the consumer was eligible and the benefit was available in the given state).[14] Five percent of the clinics providing transportation services in DY2 (n = 3) reported that they used Uber services, a new finding for DY2. State-level findings appear in Appendix Table A.5.
Almost all CCBHCs provided services in locations outside of their physical building(s). As of The DY1 progress report, 93 percent of clinics (n = 62) reported that they offered services outside of CCBHCs' physical buildings, including in consumers' homes, schools, or other community-based settings such as libraries, community centers, or coffee shops; 85 percent of these clinics (n = 53) were already providing off-site services before the demonstration (Appendix Table A.6). As of the DY2 progress report, 97 percent of clinics (n = 64) reported that they offered services outside CCBHCs' physical buildings, in similar locations as reported the previous year. Figure III.2 shows the most common locations where clinics have provided services outside of CCBHCs' physical buildings, which include locations such as consumers' homes, and community service agencies such as Social Security offices, food pantries, Department of Human Services offices, and community centers. Officials in four states cited CCBHCs' focus on the provision of services outside of the clinic location as a primary success of the demonstration. For example, an official in Minnesota mentioned that, in a particularly helpful strategy, one CCBHC has embedded staff at the local library in order to engage people experiencing homelessness who frequently use library services.
| FIGURE III.2. Proportion of CCBHCs that Provided Services Outside of Physical Clinic Space in the Past 12 Months |
|---|
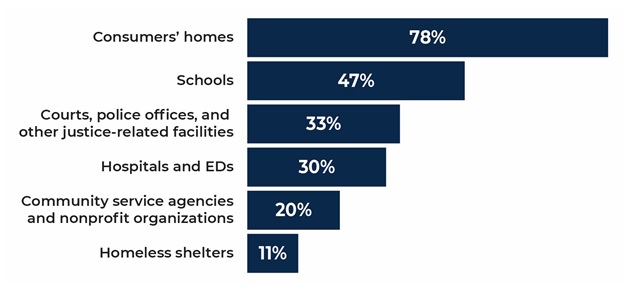 |
| SOURCE: CCBHC Annual Progress Report Demonstration Year 2 data collected by Mathematica and the RAND Corporation, March 2019. NOTES: The denominator is the number of CCBHCs that reported offering services outside the CCBHC physical buildings in the past 12 months as of March 2019 (n = 64). See Appendix Table A.6 for 2018 findings. See Appendix Table A.7 for state-level findings. The majority of clinics in all 8 demonstration states offered services outside of CCBHCs as of 2018, increasing to 100% of all CCBHCs as of 2019 in all states except New Jersey. |
Other, less common locations where CCBHCs provided services included primary care offices and FQHCs, in public spaces, or even on the street (not included in Figure III.2); these locations were similar in DY1 and DY2. State officials highlighted some of these efforts; for example, officials in Oklahoma and Minnesota reported on clinics deploying clinical staff such as LCSWs in tandem with emergency responders, such as police or emergency medical service teams, to provide care wherever it is required. Officials in Oregon highlighted one clinic's efforts to provide services in rural and frontier communities by specially outfitting and delivering care in a mobile van. Officials in three states noted that the demonstration requirements for outreach and engagement were particularly helpful for assisting first responders and intervening during crisis situations.
Most CCBHCs reported that they targeted outreach and engagement efforts to new populations and continued or expanded outreach into the second demonstration year. In both DY1 and DY2, the populations of interest most frequently included school-age youth, veterans, previously incarcerated individuals, and people experiencing homelessness (Figure III.3). From DY1 to DY2, outreach to consumers experiencing homelessness increased by 22 percentage points, and outreach to consumers who were previously incarcerated increased by 16 percentage points; outreach to the other main targeted populations stayed approximately the same.
Fifty-three percent of clinics (n = 35) reported targeting "other populations" with outreach in DY2 compared to 42 percent (n = 28) in DY1 (Figure III.3). These other populations included the following:
-
People with SUD: 37 percent (n = 13) of these clinics in DY2 and 36 percent (n = 10) in DY1.
-
People with frequent emergency department and inpatient use: 17 percent (n = 6) of these clinics in DY2 and 21 percent (n = 6) in DY1.
-
People with mental health diagnoses: 11 percent (n = 4) of these clinics in DY2 and 18 percent (n = 5) in DY1.
-
People with psychiatric diagnoses and comorbid chronic physical health conditions: 9 percent (n = 3) of these clinics in DY2 and 18 percent (n = 5) in DY1.
-
People who identify as sexual or gender minorities, especially youth: 14 percent (n = 5) of these clinics in DY2 and 14 percent (n = 4) in DY1.
-
People with law enforcement/corrections contact, which was a new finding for 2019: 20 percent of these clinics (n = 7) reported targeting outreach to this population as of the DY2 progress report, whereas only 4 percent of these clinics (n = 1) did so of the DY1 progress report.
To increase outreach to special populations, officials in two states mentioned the importance of population-specific strategies. For example, an official in Minnesota noted one clinic's efforts to develop care coordination teams to address the unique needs of specific groups by, for example, deploying a corrections care coordinator and an American Indian population coordinator, both of whom provide services in locations where they come into contact with these target populations, as a key strategy for engaging clients.
CCBHCs in some states implemented processes to improve client engagement and retention in services by, for example, monitoring the frequency of telephone follow-ups and increasing reminder calls for consumers before appointments. In Oregon, for instance, one CCBHC set forth the goal of three interactions or "touches" following closely after the initial engagement with each new consumer. Similarly, after examining preliminary data indicating low client retention, Pennsylvania decided to focus on improving follow-up with consumers after initial telephone contact with a CCBHC. Pennsylvania officials provided feedback and support to CCBHCs with respect to clinics' plans for improving their follow-up rates, and the state plans to review CCBHCs' progress toward improving follow-up rates over time.
| FIGURE III.3. Proportion of CCBHCs that Targeted Outreach to Specific Populations since the Start of the Demonstration or in the Last 12 Months |
|---|
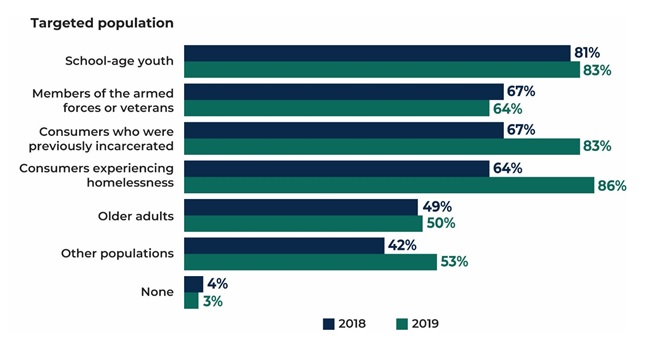 |
| SOURCE: CCBHC Annual Progress Report Demonstration Year 1 and Year 2 data collected by Mathematica and the RAND Corporation, March 2018 and March 2019. NOTES: The denominator is 67 CCBHCs in 2018 and 66 CCBHCs in 2019. See Appendix Table A.8 for the number of clinics corresponding to the percentages. See Appendix Table A.9 for state-level findings. At least 1 clinic in each state reported that it targeted outreach as of March 2019 to each of the populations in Figure III.3, a minor increase from the previous year when no clinics in Minnesota reported that they targeted older adults. Nevada and Oklahoma were the only states in which all clinics reported that they targeted outreach efforts to all of the specified populations in 2018; in 2019, Nevada clinics' level of outreach stayed the same, but Oklahoma clinics' outreach to several populations decreased. |
3. Do Consumer and/or Family Organizations Perceive Improvements in the Accessibility of Care?
Stakeholder organizations representing consumers and families overwhelmingly reported that the CCBHC model has improved access to care for CCBHC clients in their states. Respondents from groups in three states reported that the move to open-access scheduling and expanded hours of service in particular have significantly improved consumer engagement and the availability of care. One consumer representative noted, for example, that "the wait-times in CCBHCs are down. We get calls from people dissatisfied with services or that they have three to five months for waits. For the CCBHCs, there are no [lengthy] waits in any of the clinics." Another consumer representative commented that consumers experience much faster access, noting that the relevant organization has heard that some consumers are surprised by the short lead time for an appointment. Consumer group representatives in another state noted that they observed quicker access among CCBHC consumers for certain services, including medication and therapy.
Consumer and family representatives noted that the comprehensive, one-stop-shop nature of the demonstration has engendered greater access to a full range of services. One representative remarked, for example, that "the advantage of the CCBHC is the wraparound services, the full spectrum of services, integrated mental health and SUD or getting peer support and therapy and having it all available there. In some places, especially in rural areas, the advantage of multiple providers in one location [is significant]." Other representatives commented that bringing services for both adults and children, including mental health and SUD services, under one roof and has facilitated greater access to comprehensive services for whole families, noting that CCBHCs have become "family-oriented" environments that offer care to children and their parents alike. In addition, a representative from another state reported that state officials shared information on CCBHC quality measures with stakeholders through the state's quality "dashboard" system, which displays data on quality measure performance aggregated at the clinic-level. The respondent appreciated the clarity of information presented in this tool and emphasized its utility in tracking the availability and use of EBPs across CCBHCs in the state.
Consumer and family organization representatives also cited the PPS as a major facilitator of access by allowing clinics to hire the types and number of staff, including peers, required for fully addressing consumers' mental health and SUD service needs. The use of a PPS provides a unique opportunity for states and CCBHCs to develop rates based on the expected cost of care that accounted for total costs associated with delivering the nine required services to Medicaid beneficiaries. This included the ability to use a mix of staffing models, as well as pay for services that were allowed under the demonstration, but might not have been traditionally covered under Medicaid. In particular, representatives noted that the ability to hire and retain peers has substantially increased consumer engagement. In one state, for example, a representative reported that several CCBHCs have partnered with hospitals and other organizations to embed peers in order to engage consumers in times of crisis, noting "the peers bring a lot to the table to help individuals and families navigate the systems with a lived experience perspective." Representatives from organizations in the other states noted that CCBHCs have continued to create and fill peer specialist and recovery coach positions throughout the demonstration, further confirming peers' importance to the model. One representative reported an increase of 10-15 percent in the hiring of peer support and recovery support specialists, with room to grow.
Consumer and family representatives generally credited the demonstration with increasing access to care, yet representatives also identified several ways CCBHCs could further improve access. For example, one representative described ongoing challenges with transportation in rural and frontier communities and pointed to the need to intensify current CCBHC efforts to address transportation issues. In addition, although consumer and family representatives applauded efforts and strides to incorporate peers into the CCBHC workforce, representatives in three states believed that even greater access to peers would be helpful to CCBHC clients. One representative noted, for example, that it would be ideal if anyone entering treatment could have access to a certified peer specialist or family support professional if so desired. Another representative conveyed their organization's belief that CCBHCs need to hire at least several peers so that they "can support one another and change the culture in the clinic and change the attitudes towards [sic] positive regarding mental illness and wellness."
4. Are CCBHCs in the State Providing Care through the Internet, Telehealth, and Other Technologies?
Most CCBHCs provided telehealth services in DY1 and DY2, but most did not indicate that they added these services as a result of certification. Sixty-seven percent of clinics (n = 45) reported that they offered telehealth services as of the DY1 progress report, 80 percent of which (n = 36) already did so before the demonstration (Figure III.4). State officials confirmed in March 2018 (DY1) that most clinics initiated telehealth services (specifically, telepsychiatry) to help expand access to services. Use of telehealth services varied somewhat among CCBHCs before the demonstration's launch; some clinics had robust and long-standing telehealth programs, whereas others were in the early stages of developing telehealth platforms. The Medicaid program in Missouri approved telehealth SUD services in 2015 and made telehealth billable via billing code modifiers in 2017; however, state officials were unsure of the extent to which CCBHCs in the state were using telehealth.
As of the DY2 progress report, 70 percent of clinics (n = 46) reported that they offered telehealth services, at an increase of 3 percentage points from the previous year (not shown in Figure III.4; detailed findings appear in Appendix Table A.6). Of the 70 percent of clinics offering telehealth services in DY2, the most common services were the following:
-
Telepsychiatry, offered by 67 percent of clinics (n = 31) compared to 64 percent of clinics (n = 29) in DY1.
-
Therapy or counseling, offered by 39 percent of clinics (n = 18) compared to 24 percent (n = 11) in DY1.
-
Medication management, offered by 30 percent of clinics (n = 14) compared to 20 percent (n = 9) in DY1.
As in DY1, most CCBHCs in DY2 reported that they provided telehealth for all consumers who needed it, with a few focusing on children and youth and incarcerated individuals.[15] In addition, as we described in Section A, three clinics reported the addition of telehealth positions to their staff in order to address common staffing challenges such as rural locations, unrealistic salary expectations, workforce shortages, and competition with other health care facilities.
| FIGURE III.4. Proportion of CCBHCs that Provided Telehealth Services (as of March 2018) |
|---|
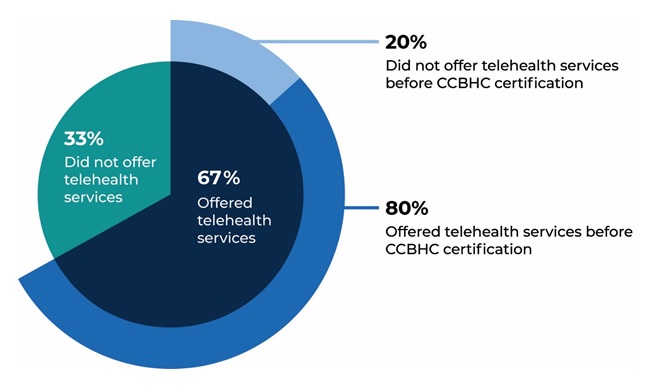 |
| SOURCE: CCBHC Annual Progress Report Demonstration Year 1 data collected by Mathematica and the RAND Corporation, March 2018. NOTES: See Appendix Table A.6 for the number of clinics corresponding to the percentages and for 2019 findings. See Appendix Table A.7 for state-level findings. There was no meaningful change at the state level in the proportion of CCBHCs that offered telehealth services. |
State officials in most states described telehealth services provided by clinics as a particularly valuable tool for increasing access to CCBHC services in rural or frontier areas. In Nevada, for example, rural and frontier CCBHCs use telehealth tools, as needed, to deliver MAT services, specialty medical care, and child psychiatry. In particular, the frontier clinics reportedly have a long-standing history of using telehealth to overcome consumer transportation barriers. States varied, however, in their support for and adoption of technological strategies to expand access to care. For example, even though officials in Nevada recognized the value of telehealth in certain situations, officials cautioned against the widespread use of telehealth, noting that the state wanted clinics "to focus on implementation, and be able to fulfill the demand for services in person." Nevada officials also remarked that "importantly, a client of the CCBHC should have access to all CCBHC core services, and telehealth is not clinically appropriate for some core services. Therefore, a client cannot have some services via telehealth and we wanted to be cautious and provide services medically necessary and clinically appropriate." Officials in other states noted that while some CCBHCs use telehealth, it does not account for a large share of service provision.
Officials in states that reported broader use of telehealth saw the technology as serving two purposes: (1) to assist with filling gaps occasioned by staff shortages; and (2) to expand the reach of CCBHCs into consumers' homes and communities. For example, in Oklahoma, CCBHCs rely on various technology provided to consumers, law enforcement officers, and emergency departments to help link consumers to needed services with the intention of reducing hospitalizations. One CCBHC in Oklahoma has distributed more than 1,000 tablet computers (iPads) with built-in communication systems to consumers for use in their homes, to on-call psychiatrists, to sheriffs and police departments in several counties surrounding the CCBHC, and to emergency departments, with the goal of overcoming traditional transportation barriers to accessing care in rural communities. Via the tablets, individuals can communicate with staff at intensive outpatient (IOP) centers, which are open and available via telehealth 24 hours a day, seven days a week. In addition to gaining access to crisis services, consumers can access other CCBHC services remotely through their tablets, including individual therapy/counseling, psychiatric rehabilitation, and treatment planning and assessment services. Officials reported that, in the second demonstration year, the other two CCBHCs in Oklahoma also began using iPads to expand access to services. Similarly, officials in Minnesota noted that one clinic decided that traditional in-office telehealth did not go far enough and wanted clients to be able to receive services in their home. "So [the clinic] purchased a bunch of tablets and provided them to their clients so they could have them at home, and people were able to receive their services and be at home and have their therapy sessions...truly how I've always envisioned telehealth. One client had been coming to the clinic for quite a while, and had been really engaged in services, and was pregnant and put on bed rest. And she was still able to be engaged in her services until her baby was born. Another was a client who was in a lot of crises, and got caught in a traffic jam, and realized that she wasn't going to make her appointment, and pulled off the highway and had her session right then."
5. What has been the Role of CCBHCs in Delivering Services to Individuals in AOT?
Almost all clinics reported that, in DY2, they accepted referrals from courts or consumers with AOT orders. Ninety-eight percent of clinics (n = 65) accepted referrals from courts for individuals with involuntary treatment or AOT orders as of the DY2 progress report, an increase from 91 percent of clinics (n = 61) in DY1. As of the DY2 progress report, all clinics in all states except New York accepted AOT orders (state-level findings appear in Appendix Table A.10). In interviews, Pennsylvania was the only state reporting potential changes to the way its CCBHCs may have supported AOT in the second demonstration year but these potential changes were not the result of the demonstration. In Pennsylvania a law was passed during the 2018-2019 winter legislative session that established standards for AOT in the state, with implementation required on April 22, 2019. Officials in the state speculated that the law could encourage some CCBHCs to begin participating in AOT but they also noted that the law was not specific to CCBHCs.
C. Services
CCBHCs are required to provide a broad set of services that include but are not limited to the following nine service types listed in the authorizing legislation:
-
Twenty-four-hour crisis services.
-
Screening, assessment, and diagnosis.
-
Patient-centered treatment planning.
-
Outpatient mental health and substance use treatment.
-
Screening and monitoring of key health indicators.
-
TCM.
-
Psychiatric rehabilitation services.
-
Peer and family support and counselor services.
-
Intensive, community-based mental health care for members of the armed forces and veterans.
PAMA lists the minimum scope of service requirements for CCBHCs but also affords states flexibility in establishing those requirements, thereby ensuring alignment of the scope of services with states' respective Medicaid State Plans and other state regulations and goals. For example, in addition to federal requirements for screening and monitoring of health indicators, Oregon required its clinics to provide 20 hours of on-site primary care services per week in the second demonstration year. Given that that providing the full scope of services might challenge many CMHCs, the demonstration allows CCBHCs to provide directly the first four services listed above and to provide the remaining services either directly or through a relationship with an external provider known under the demonstration as a DCO--an entity engaged in a formal financial relationship with CCBHCs to deliver some of the nine required services under the same requirements.[16] This section summarizes: (1) the types of services that CCBHCs added or expanded as a result of the certification process; (2) CCBHCs' experience with sustaining the full scope of services into the second demonstration year and any barriers encountered in providing those services; and (3) the EBPs that CCBHCs provided as a result of the demonstration.
1. What Types of Health and Behavioral Health Services did CCBHCs and DCOs Offer in the First Demonstration Year?
In the first demonstration year, most clinics reported that they expanded their scope of services to meet CCBHC certification criteria. Eighty-four percent (n = 56) reported that they made changes to the range of services they provided to consumers. They most often added services to meet certification requirements in the areas of outpatient mental health and/or SUD services, psychiatric rehabilitation services, and crisis behavioral health services (Figure III.5). Other services commonly added services as a result of certification included peer support services, intensive community-based mental health services for members of the armed forces and veterans, primary care screening and monitoring, and TCM. Fewer clinics reported the addition of other types of screening and assessment services or person-centered and family-centered treatment planning.
| FIGURE III.5. Proportion of CCBHCs that Added Each Type of Service as a Result of Certification (as of March 2018) |
|---|
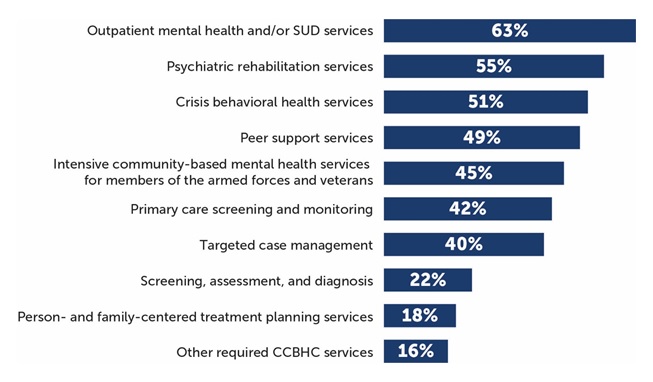 |
| SOURCE: CCBHC Annual Progress Report Demonstration Year 1 data collected by Mathematica and the RAND Corporation, March 2018. NOTES: Denominator is 67 CCBHCs. See Appendix Table A.11 for detailed findings on individual services. CCBHCs may have provided services within each of the service categories illustrated in the figure before CCBHC certification. For example, all clinics provided some type of outpatient MH and/or SUD treatment before certification. However, 63% of clinics added some type of outpatient MH and/or SUD treatment as a result of certification. The service categories illustrated in this figure correspond to the service categories described in the CCBHC certification criteria. |
During the first demonstration year, CCBHCs provided crisis behavioral health services both directly and through DCOs. In the DY1 progress report, at least three-quarters of clinics reported that they provided crisis behavioral health services directly (these individual services appear in Appendix Table A.12), and at least one-third reported that they added such services as a result of certification (these individual services appear in Appendix Table A.11). The criteria require CCBHCs to provide crisis behavioral services directly unless an existing state-sanctioned, certified, or licensed system or network is functioning as a DCO. The relatively high proportion of clinics that also rely on DCOs to provide crisis behavioral services suggests that CCBHCs may contract with DCOs to supplement their own services or perhaps to provide services that are more targeted than they can offer directly. Interviews with state officials echoed this finding; for example, in Minnesota and Missouri, the DCOs provided crisis services only for the clinics that do not directly provide such services.
As of the DY1 progress report, 33 percent of clinics (n = 22) reported in a write-in progress question that they provided some "other" CCBHC services. Of these, 41 percent (n = 9, all in Missouri) provided emergency room enhancement services (three added this service as a result of certification); 41 percent (n = 9) provided community mental health liaisons[17] (none added this service as a result of certification); and 14 percent (n = 3) offered withdrawal management services (all added as a result of certification). None of these services were provided through DCO partnerships. See Appendix Table A.12 for detailed findings on the availability of each type of service provided by CCBHCs and DCOs, and Appendix Table A.11 for the frequency with which the service was added as a result of certification. State-level findings appear in Appendix Table A.13.
Nearly all CCBHCs provided primary care screening and monitoring, but only 55 percent also provided on-site primary care services during the first demonstration year. In the DY1 progress report, 97 percent of clinics (n = 65) reported that they provided primary care "screening and monitoring" (as required by the certification criteria) either on-site or through DCOs (Appendix Table A.12). Fifty-five percent of clinics (n = 37) also provided on-site primary care services in the first year (provision of these services is not required by the certification criteria) (Appendix Table A.14). Among CCBHCs that provided on-site primary care, 84 percent (n = 31) provided these services before certification; the remaining 16 percent (n = 6) added on-site primary care during or after the certification process. Some clinics in all states provided on-site primary care in the first demonstration year, ranging from 75 percent in Nevada (n = 3) and Oregon (n = 9) to 29 percent in Pennsylvania (n = 2). In addition, 8 percent of clinics (n = 5) reported that they were FQHCs as of the DY1 progress report.
State officials noted that changes to the scope of services to meet certification requirements varied across states, depending on the existing service array offered by the clinics before the demonstration. According to officials in Pennsylvania, New York, and Missouri, the clinics that became CCBHCs provided--before certification--the full scope of services through a mix of in-house (i.e., services provided on-site by CCBHC staff) and externally contracted services. CCBHCs commonly brought some of those previously contracted services in-house during the certification process. These services were new to the clinics, but not necessarily new to the care network. As one official in Missouri said, "Clinics were doing many aspects of the required services already, so to fulfill the requirements it was a matter of bringing the aspects together under one roof, adding staff, some training, serving more people and covering costs for the full complement of services." In other states, certification required the dramatic expansion of clinics' scope of services. For instance, in Nevada, the clinics that became CCBHCs were previously SUD treatment clinics. To meet certification criteria, the clinics had to add the full range of specialty mental health services, including psychiatric rehabilitation and child/adolescent services.
|
CCBHC Spotlight: Scope of Services: Expansion of Therapeutic Group Services |
|
|---|---|
|
This CCBHC is a non-profit behavioral health center located in an urban setting. The organization operates two locations for the delivery of behavioral health services (one for adults and one for children and families), as well as operates several additional locations for residential addiction recovery services. As part of the demonstration, the CCBHC focused on enhancing its scope of services and creating a person-centered and family-centered atmosphere. To this end, the clinic expanded the breadth of group services that it offered. Since the demonstration's outset, the clinic introduced several new group services, including art therapy, health and wellness, yoga, meditation, teen discussion, family change transition, mindfulness, and anger management. The CCBHC took steps to promote client participation in the new services. For example, each week the clinic posted a schedule of group activities in the common areas of the clinic and encouraged staff to distribute copies of the schedule to clients during routine encounters. Staff reported that they introduced existing clients to the groups through internal referrals; any staff member could suggest a group to a client who might benefit or be interested. Further, clinicians advertised the group services during intake sessions in order to make new clients aware of the clinic's offerings.
CCBHC staff and leaders highlighted the benefits of the new group services, noting that the groups promote positive self-care and coping strategies to help clients manage their symptoms. In addition, staff commented that the groups help keep high-need clients engaged in services. One therapist remarked on the difficulty of keeping clients who are less verbal engaged in services, stating, "Because we provide groups...We can see more clients' experiences and we can keep them engaged." Overall, clinic staff and leadership echoed that the expansion of groups was pivotal in fostering a client-centered environment, promoting resiliency, and creating community. As one psychiatrist said, "The clients love the groups because they don't feel alone, and they enjoy it, and we see that the groups have made a positive change in the clients." Although the clinic perceived that the groups were successful, the clinic faced some challenges in expanding its group services. Clinic staff and leadership voiced concern that the small physical setting made it difficult to secure meeting spaces suitable for larger groups. In addition, interviewees focused on the costs of offering more groups. While some services, such as art therapy and music therapy, are billable under the state's Medicaid program, others are not. For example, when reflecting on the PPS, the clinic director stated, "The rate sounds fair at face value, but from a programmatic standpoint [the rate] is not enough in order to meet the steady increase of clients that continues to grow. The [service provision] trend is holistic, but some of those things are not billable, for example, the yoga group therapy is not billable." The clinic valued the additional group services for its given client population and therefore planned to continue searching for solutions that will maximize physical space and fund non-billable services. |
2. Have CCBHCs and DCOs Sustained the Delivery of Required Services in the Second Year of the Demonstration?
During interviews in the second year of the demonstration, officials in all states indicated that clinics were able to sustain delivery of the nine core CCBHC services throughout the demonstration. As one official in New York noted, "The first year [of the demonstration] was building the full scope of services. The clinics have been able to address all of the core services more effectively moving into Year 2. Now, we are looking to effectively maximize the core services based on client needs...[and]...to help clinics see the shift to multiple services in the same visit."
CCBHCs reported maintaining most of the required services in the second demonstration year. All or nearly all clinics in both DY1 and DY2 reported that they provided crisis behavioral health services; screening, assessment, and diagnosis services; person-centered and family-centered treatment planning services; outpatient mental health and/or SUD services; psychiatric rehabilitation services; peer support services; and TCM either directly or through DCOs (Figure III.6).
| FIGURE III.6. Proportion of CCBHCs that Provided Each Type of Service Either Directly or Through a DCO |
|---|
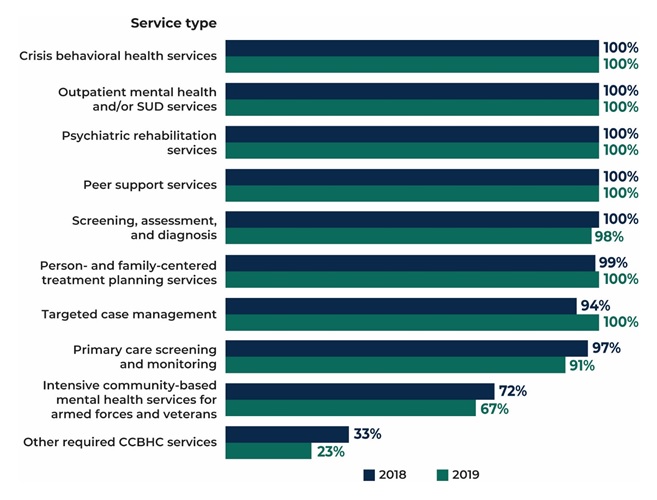 |
| SOURCE: CCBHC Annual Progress Report Demonstration Year 1 and Year 2 collected by Mathematica and the RAND Corporation, March 2018 and March 2019. NOTES: Denominator is 67 CCBHCs in 2018 and 66 CCBHCs in 2019. See Appendix Table A.12 for detailed findings and the number of clinics corresponding to the percentages. See Appendix Table A.13 for state-level findings. |
Unlike the previous services that were provided by practically all CCBHCs, only 72 percent of clinics (n = 48) reported that, in DY1, they provided intensive community-based mental health services for members of the armed forces and veterans either directly or through a DCO, and only 67 percent (n = 44) reported that they provided such services in DY2 (Figure III.6). State officials offered some explanations for why these services were not offered more frequently. Some state officials perceived that CCBHCs were not located in communities in which a large number of members of the armed forces or veterans sought services from CMHCs. However, they also reported that some CCBHCs struggled to engage these populations and to develop referral relationships with agencies that serve veterans and military members. In New Jersey, for example, officials indicated that the clinics that provided a greater number of services to larger numbers of members of the armed forces and veterans either hired peer-veterans to conduct outreach or had been providing services to veterans before the demonstration and thus had existing relationships with other community providers.
Ninety-one percent of CCBHCs (n = 60) provided primary care screening and monitoring in the second year of the demonstration compared to 97 percent (n = 65) in DY1 (Figure III.6). The following findings from the progress reports suggest that some CCBHCs shifted responsibility for primary care screening and monitoring to DCOs in the second year of the demonstration (Appendix Table A.12):
-
In DY1, only 4 percent of clinics (n = 3) provided primary care screening and monitoring through a DCO relationship, but the proportion increased to 14 percent of clinics (n = 9) in DY2 (a difference of six clinics).
-
Of the six clinics that reported newly partnering with DCOs to provide primary care screening and monitoring in DY2, five reported that they provided the service directly in DY1; the other clinic did not provide this service at all in DY1.
The reasons for the shift to DCOs for primary care screening and monitoring are unclear from the progress report data alone, but it is possible that CCBHCs found the service difficult to provide directly.
All CCBHCs provided crisis behavioral health services in both years of the demonstration (Figure III.6). There were some shifts over time in the proportion of clinics that provided individual crisis behavioral health services directly versus through a DCO relationship (Appendix Table A.12):
-
Ninety-five percent (n = 63) of clinics directly provided emergency crisis intervention services in DY2 compared with 88 percent (n = 59) in DY1.
-
At the same time, 27 percent of clinics (n = 18) provided crisis stabilization through a DCO relationship in DY2 compared with 21 percent (n = 14) in DY1.
-
Eighty percent (n = 53) of clinics directly provided 24-hour mobile crisis teams in DY2 compared with 73 percent (n = 49) in DY1. DCO provision of 24-hour mobile crisis teams (one of the most commonly provided DCO services) decreased correspondingly from 34 percent of clinics (n = 23) in DY1 to 29 percent (n = 19) in DY2.
Fifty-five percent of CCBHCs (n = 36) provided on-site primary care during the second year of the demonstration (Figure III.7), the same proportion of CCBHCs that reported provision of this service in DY1 (Appendix Table A.14). All clinics in Nevada and Oregon reported that they provided on-site primary care services, whereas only some clinics in other states reported the provision of these services. Officials in Oregon reported a new state requirement for CCBHCs in the second demonstration year that mandated the provision of 20 hours per week of on-site primary care. When discussing the addition of primary care, one official commented that "the federal [CCBHC] requirements set us up, so really trying to meet the federal requirements in year one allowed us to ramp up in year two." Only in New York did on-site primary care services decrease, from 54 percent of clinics (n = 7) in DY1 to 15 percent (n = 2) in DY2. New York clinics reported several DCO relationships with FQHCs in DY2, perhaps helping to explain the decrease in direct service provision (more information appears in Section III.D).
Provision of "other" services decreased by the second year of the demonstration. In a write-in question in the DY2 progress report, 23 percent of clinics (n = 15) reported that they provided some "other" CCBHC services, a decrease from the 33 percent (n = 22) that reported the same in DY1. More specifically, among these clinics, they wrote in similar "other" services as in the previous year, but at lower rates: 20 percent (n = 3) provided emergency room enhancement services (compared to 41 percent [n = 9] in DY1); 13 percent (n = 2) provided withdrawal management services (compared to 14 percent [n = 3] in DY1); and 7 percent (n = 1) provided community mental health liaisons (compared to 41 percent (n = 9) in DY1). None of these services was provided through DCO partnerships in either year.
| FIGURE III.7. Proportion of CCBHCs that Provided On-Site Primary Care in DY2 and Before CCBHC Certification |
|---|
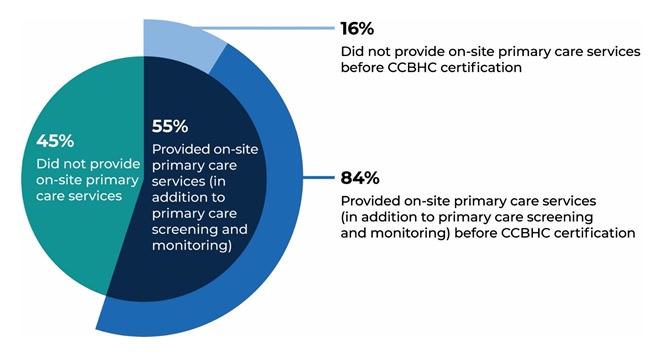 |
| SOURCE: CCBHC Annual Progress Report Demonstration Year 1 and Year 2 collected by Mathematica and the RAND Corporation, March 2018 and March 2019. NOTES: See Appendix Table A.14 for detailed findings and the number of clinics corresponding to the percentages. See Appendix Table A.15 for state-level findings. |
3. What EBPs did CCBHCs Adopt as a Result of Certification? Were CCBHCs able to Sustain These Practices?
In the first year of the demonstration, CCBHCs offered a wide range of EBPs and psychiatric rehabilitation and other services either directly or through DCOs. Most clinics were able to sustain or provide more of these services in the second year of the demonstration (Figure III.8).
-
All or almost all CCBHCs provided many EBPs in both DY1 and DY2, including motivational interviewing, individual and group CBT, dialectical behavior therapy (DBT), evidence-based medication evaluation and management, and community wraparound services for youth/children.
-
Ninety-two percent of clinics (n = 61) offered MAT in DY2 compared to 84 percent (n = 56) in DY1.
-
Fifty-six percent of clinics (n = 37) offered Multisystemic Therapy services in DY2 compared to 40 percent (n = 27) in DY1.
Some CCBHCs shifted the delivery of certain EBPs and psychiatric rehabilitation services to DCOs in the second year of the demonstration (Appendix Table A.12).
-
Five percent of CCBHCs (n = 3) delivered individual or group CBT through DCOs in DY2 compared to no CCBHCs in DY1.
-
Three percent of clinics (n = 2) delivered Multisystemic Therapy through DCOs in DY2 compared to no clinics in DY1.
-
Three percent of clinics (n = 2) delivered evidence-based medication evaluation and management through DCOs in DY2 compared to no clinics in DY1.
CCBHCs adopted several of the following services as a result of certification, as reported in the DY1 progress report (Appendix Table A.11).
-
Forty-six percent (n = 31) added MAT for alcohol or opioid use as a result of certification.
-
Forty percent (n = 27) added TCM.
-
Thirty-one percent (n = 21) added Illness Management and Recovery.
-
Fifteen percent (n = 10) added community wraparound services for youth/children.
At the state level, New York saw the most change in delivering EBPs from DY1 to DY2, with many more CCBHCs reporting that they provided these services either directly or through DCOs in the demonstration's second year (state-level findings appear in Appendix Table A.13). CCBHCs in Minnesota and Oregon substantially increased their provision of MAT from DY1 to DY2.
| FIGURE III.8. Proportion of CCBHCs that Provide Selected EBPs, Psychiatric Rehabilitation Services, or Other Services, Either Directly or Through a DCO |
|---|
 |
| SOURCE: CCBHC Annual Progress Report Demonstration Year 1 and Year 2 collected by Mathematica and the RAND Corporation, March 2018 and March 2019. NOTES: Denominator is 67 CCBHCs in 2018 and 66 CCBHCs in 2019. See Appendix Table A.12 for detailed findings and the number of clinics corresponding to the percentages. See Appendix Table A.11 for the number and percentage of clinics that added each type of service as a result of CCBHC certification. See Appendix Table A.13 for state-level findings. * = EBP listed in CCBHC criteria. |
Provision of several key psychiatric rehabilitation and other services increased in the second demonstration year (Figure III.8) as noted below.
-
Eighty-two percent of clinics (n = 54) offered supported employment in DY2 compared to 75 percent (n = 50) in DY1.
-
Eighty-three percent of clinics (n = 55) offered peer support services for families in DY2 compared to 73 percent (n = 49) in DY1.
-
Seventy-nine percent of clinics (n = 52) offered supported housing in DY2 compared to 70 percent (n = 47) in DY1.
-
Sixty-eight percent of clinics (n = 45) offered supported education in DY2 compared to 54 percent (n = 36) in DY1.
CCBHCs used several best practices to facilitate crisis planning, with little change from DY1 to DY2. A similar proportion of clinics in both years reported the use of wellness recovery action plans, psychiatric advance directives, and safety or crisis plans (Table III.5). Nevada was the only state in which CCBHCs did not use all of the strategies: zero percent of clinics in either year reported the use of safety/crisis plans.
Fifty-five percent of clinics (n = 37) reported reliance on some "other" strategy to facilitate crisis planning in DY1, increasing to 64 percent (n = 42) in DY2 (Table III.5). In a write-in question in the progress report, clinics listed a range of such strategies that were similar in DY1 and DY2, including suicide assessments (for example, the Columbia Scale), relapse prevention and planning, critical/crisis intervention planning, and working with external partners and stakeholders to provide patient-centered services in the area of crisis planning.
| TABLE III.5. Strategies Used by CCBHCs to Facilitate Crisis Planning | ||||
|---|---|---|---|---|
| Strategy | Number and Proportion of CCBHCs that Used Strategy, 2018 |
Number and Proportion of CCBHCs that Used Strategy, 2019 |
||
| N | % | N | % | |
| Wellness recovery action plan | 49 | 73 | 49 | 74 |
| Psychiatric advance directives | 46 | 69 | 49 | 74 |
| Develop a safety or crisis plan | 29 | 43 | 27 | 41 |
| Other | 37 | 55 | 42 | 64 |
| Total CCBHCs | 67 | 100 | 66 | 100 |
| SOURCE: CCBHC Annual Progress Report Demonstration Year 1 and Year 2 collected by Mathematica and the RAND Corporation, March 2018 and March 2019. NOTE: See Appendix Table A.16 for state-level findings. |
||||
Officials in most states indicated that, even though individual CCBHCs may have added a few new practices, clinics, in general, have consistently implemented the EBPs required by states across demonstration years. One state official remarked, for example, that the "CCBHC model in the state was a launching point for clinics to embed EBPs into their clinic models and all clinics have grown their trainings and monitoring processes for EBPs in the second year." To support CCBHCs' efforts to enhance the provision of EBPs, officials in two states mentioned the initiation of learning collaboratives to help clinics work toward adopting and using different EBPs.
Officials in two states noted that, even though EBPs have been an important component of the CCBHC service array, states have found it necessary to grant CCBHCs some flexibility to adjust their offerings to ensure that their services reflected the needs of their client populations as those needs came into focus during the first demonstration year. In Nevada, for example, state officials mentioned that they initially asked CCBHCs to provide specific EBPs; however, the state later recognized that requiring clinics to expend significant resources to provide a service used by only a small percentage of consumers was not a judicious use of funds for CCBHCs, particularly when other less resource-intensive services were available to meet the same need. Nevada, therefore, was planning to provide CCBHCs with more flexibility to meet what it perceived as the underlying intent of the EBP requirement. For example, the state initially expected CCBHCs to provide a specific EBP, namely, Trauma-Focused CBT, to ensure that clients received trauma-focused care; however, the state has broadened the requirement to allow CCBHCs to establish a trauma-specific framework for interventions without limiting them to delivery of the provider-intensive and resource-intensive specific Trauma-Focused CBT EBP. An official in the state reported that the state "received feedback over the 18 months and [is] evaluating how we can stay true to the intent of EBPs but give flexibility to the clinic that is appropriate to meet the need of their clients and not completely dictated by the state."
Some states reported that the demonstration is dovetailing with other efforts underway to expand EBPs across the demonstration states. For example, in the second demonstration year, Minnesota decided that, given the nationwide focus on the ongoing opioid crisis, the state needed a clear policy document about MAT, what it is and why it works, and how to integrate it into a behavioral health clinic. The state also mentioned that, as part of its Opioid State Targeted Response grant, it developed three opioid-specific hub-and-spoke networks by adopting the ECHO model.[18] Minnesota noted that CCBHCs have been closely involved with these efforts and "were oriented before everyone else and invited to participate. And we've heard fantastic feedback from the physicians and psychiatrists in the clinics who have attended and said the ECHO model has done a lot to help them prescribe buprenorphine when they were quite uncomfortable with it before. This mainly is a psychiatry population that has been in CMHCs and mental health clinics and they haven't been thinking about MAT, so this was a big push for them to feel comfortable, and the ECHO model has helped a lot."
4. What Barriers have CCBHCs Encountered in Providing the Full Scope of Services?
State officials identified some services as initially challenging for some CCBHCs to implement but indicated that the states generally addressed these challenges early in the demonstration. At the beginning of the demonstration, state officials most commonly reported that outpatient SUD treatment and peer support services were the most challenging for CCBHCs to provide. However, at the time of the second round of interviews, officials in most states noted that CCBHCs and states had resolved most challenges. State officials described overcoming several barriers to the implementation of the full scope of services, including the following:
-
Inexperience in providing specific services to certain populations. As described above, CCBHCs in some states were required to add new service lines or types of services to fulfill the demonstration criteria. For example, Nevada's CCBHCs provided primarily SUD services before the demonstration and thus had to add outpatient mental health services. Some CCBHCs in other states had to expand certain services to new populations. In Minnesota, for example, before the demonstration, CCBHCs provided some services only to adults and others only to children.
-
State credentialing and licensure requirements. Officials in some states described challenges either in obtaining licensure to provide certain required services or hiring staff with the credentials needed to provide such services. For example, stringent state requirements for licensure for ambulatory withdrawal management in New Jersey initially posed a challenge for the state in certifying its CCBHCs. The state worked closely with its CCBHCs and state licensure office to help the former meet the licensure requirements. Similarly, some CCBHCs initially faced challenges in delivering peer support services because of state regulations governing the credentialing of peer support staff.
-
Workforce shortages. As described earlier, some states initially experienced challenges in recruiting and hiring certain types of staff. Officials in several states, including Minnesota, New Jersey, and New York, noted particular challenges in hiring peer support staff in rural areas.
In the second year of the demonstration, officials confirmed that states and clinics no longer encountered major barriers to providing the full scope of services. As the demonstration winds down and states reflect on how to improve the model in the future, officials noted several lessons learned regarding the implementation of services. Officials in New Jersey, for instance, indicated that a more prescriptive approach to certain services at the beginning of the demonstration could perhaps have engendered the more widespread availability and use of those services. For example, the state reported that it hoped that clinics would provide more and better-integrated peer services than ultimately were available and suggested that: (1) the lack of a state definition or credentialing process for peers; and (2) the need for more guidance from state demonstration leadership on how to provide peer services may have contributed. Even though peer services were available, clinics struggled to incorporate such services into all facets of CCBHC service provision and care coordination as was envisioned by the state. A New Jersey official noted that "when we started doing our site visits we asked them...where are your peers, where are they involved...and we started to see this that peers were not an active component. They were available, but they weren't a big part of the program. That's one of the areas where we would have been more prescriptive."
Officials in most states also suggested that the comprehensive and collaborative nature of service provision represented a paradigm shift for their states, clinics, and consumers alike, and two states reported surprise at the way CCBHC clients responded to the availability of certain services.
-
Officials in Oklahoma, for example, noted that, even though clinics have been able to incorporate the components needed to deliver an IOP level of services for SUD, including MAT and recovery-focused services, persuading clients to make use of such services posed a challenge. As one official noted, "For many years all there was [for SUD treatment] were residential and 12-step programs. So that's still embedded in our culture, so it's convincing people that 'yes you can get better by going to MAT, and we have these IOP services you can get and not have to wait until you go off to a residential bed.' But I think that shift in culture is a process, I think once people realize how much easier it is not to have to put lives on hold, give up jobs, and leave families in order to go somewhere and get treatment, we'll see people using the services more."
-
Similarly, Minnesota officials voiced surprise over consumer reactions to the demonstration's requirements for an initial assessment to be completed within ten days and a much more comprehensive assessment within 60 days. The state expected CCBHC clients to favor this approach, which would allow time for providers and clients to build rapport before delving into sensitive topics. Instead, officials noted that clients expressed a clear preference for the completion of all assessments at one time because "trying to convince clients to come into the clinic for evaluation twice or more was a hard sell, particularly for clinics in remote areas where clients live far from their clinic. The clients wanted to come in for 2-3 hours and get it all done at once. This was a surprise because the thought was that clients felt that it was frontloaded and here's this stranger asking personal questions at the beginning...but it didn't work that way." The state has since created a work group to explore ways to improve the assessment process that will better meet client preferences and needs.
D. Care Coordination
The CCBHC certification criteria describe care coordination as the "linchpin" of the CCBHC model. The criteria require CCBHCs to provide integrated and coordinated care that is person-centered and family-centered and addresses all aspects of a person's health. The authorizing statute requires CCBHCs to coordinate care across settings and providers, and to establish partnerships and formal relationships with a range of other providers. CCBHCs must ensure adequate communication and collaboration between and among them, including formal relationships with DCOs. This section summarizes: (1) the types of care coordination services offered by CCBHCs; (2) changes that CCBHCs implemented in their treatment teams to support care coordination; and (3) the extent to which CCBHCs expanded the network of care providers participating in the treatment of their clients, including DCOs.
1. What Processes have CCBHCs and DCOs Implemented to Share Information across Providers and Coordinate Care?
Officials in most states acknowledged that CCBHCs and other behavioral health providers generally engage in care coordination across their respective states by relying on a variety of specific care management programs or care models. Officials described some of the specific ways in which CCBHCs have leveraged or expanded these models under the demonstration, including the following:
-
Several state officials pointed to the importance of TCM for CCBHC consumers. In particular, officials in New Jersey and Pennsylvania mentioned plans for expanding TCM to populations served by CCBHCs. In New Jersey, outside of the demonstration, providers primarily offer TCM to people released from state psychiatric hospitals who have serious and persistent mental illness and/or are considered "high acuity."[19] New Jersey officials commented that the state's goal is to expand and make structured care coordination and case management available to all populations served by CCBHCs, including those with SUD or a lower level of need for whom TCM is not traditionally available. Pennsylvania CCBHCs are providing TCM for all CCBHC consumers and using two other models of care coordination: (1) a nurse navigator model in rural areas that focuses on improving medication adherence for both physical and behavioral conditions; and (2) a case management model in urban and rural areas that focuses on SUD treatment for individuals receiving MAT.
-
Officials in Oklahoma characterized care coordination before the demonstration as generally "one size fits all," noting that the state's CCBHCs are becoming much more sophisticated in providing care coordination. For example, one CCBHC has started to use a one-page CCBHC consumer "report card," accessible to staff, that shows laboratory results, medication compliance, the number of services received, and screenings for a given consumer. The report cards assign a grade to the agency on how well the services provided to each CCBHC consumer are coordinated, with those results also available to all staff involved in the individual's care.
-
Officials in Oregon noted that "the main difference [between what CCBHCs and other behavioral health providers are providing] is the standards that go along with CCBHC care coordination. We had care coordination before, but now we have the care coordination agreements with the various entities that are required, so it's really an increase in intensity of care coordination."
-
Officials in Missouri reported that CCBHCs leveraged existing care coordination efforts in the state, commenting that "the state already had initiatives for Health Home and care management that all CCBHCs leveraged to fulfill and expand care coordination--related services for CCBHC consumers." Similarly, officials in Minnesota and New Jersey mentioned that care coordination, now available to all CCBHC clients, had previously been available only to certain populations or service lines.
Most CCBHCs made changes to the composition of their treatment teams as a result of the certification process and then continued to refine the membership of the teams during the demonstration's second year. In DY1, 76 percent of clinics (n = 51) reported a change in the membership of their treatment teams as a result of the certification process; in DY2, 58 percent (n = 38) reported that members of their treatment teams changed in the last 12 months. However, as noted below, clinics reported few substantial differences from DY1 to DY2 in the proportion of clinics that reported the participation of specific types of providers in their treatment teams (Table III.6).[20]
|
CCBHC Spotlight: Risk-Stratification for Tailoring Scope of Services and Care Coordination |
|
|---|---|
|
Snapshot of CCBHC. This CCBHC is a non-profit behavioral health center within a larger health system network. It is located in an urban area and is considered the largest behavioral health provider in its region. As part of the demonstration, the CCBHC developed an algorithm to classify clients into four levels of risk based on a client's biopsychosocial factors. The risk score is documented in the client's health records and then used to identify clients in need of more intensive services and/or care coordination. The CCBHC reassesses the risk level every six months or when the client experiences a change in health status. Before the demonstration, the clinic did not have a strategy for risk-stratifying clients. Program staff and leadership reported on the several benefits of the risk-stratification process. For example, the clinic developed care teams charged with specializing in and treating specific conditions and addressing specific needs such as SMI, SUD, and medical complexities. The risk-stratification process allows the clinic to assign clients to the care team that best meets their particular care needs, and guides the teams' care decisions related to each client. Stratification also allows staff to enhance services to meet the needs of high-risk clients and proactively identify moderate-risk clients. Staff reported that the risk scores proved helpful with intervening and reducing the likelihood that clients would transition to the higher-risk categories, noting that "it is not just the squeaky wheel that gets our attention. Sometimes it is the consumer who is not engaged who might not be the highest risk and needs our attention."
Staff also used the risk categories to tailor care coordination to clients' needs. For example, clients considered "high-risk" receive high priority in treatment team discussions, leading to enhanced care management for those clients. In addition, to enhance care coordination across the service landscape, CCBHC staff members collaborate with internal and external providers who serve the same clients. One provider said, "The meetings to discuss the groups of consumers, especially the high-risk group, bring together providers from the multiple locations--and consumers may get services from the multiple service locations--so that helps us provide person-centered care." |
The proportion of CCBHCs that changed their treatment teams as a result of certification in DY1 was generally consistent across states; the exception was Missouri, where only about one-third of clinics reported that they made changes. However, state officials in Missouri described well-established care coordination efforts across the state before the demonstration, perhaps explaining in part the low percentage of changes to treatment teams in their state as a result of certification. The state-level proportion of clinics reporting in DY2 that members of their treatment teams changed in the last 12 months was more variable.
In interviews, state officials described clinics' efforts in the demonstration's second year to enhance treatment teams by more successfully incorporating certain provider types. In Nevada, for example, officials described efforts aimed at better integrating psychiatrists into treatment planning and treatment teams as required under the demonstration. Officials noted that, before the demonstration, clinics typically contracted with psychiatrists in private practice for psychiatry services. One official commented that the demonstration has therefore "created a very different utilization of psychiatry by integrating the medical doctor into the therapeutic team. The clinic size influences how that is implemented...comprehensive team meetings once per week...has been feasible at small clinics. At the urban [larger] clinic, the clinic needed to really work hard to change the approach to psychiatry to get the medical doctors involved and have team meetings. The change took a lot of coaching from the CCBHC administration with the staff."
For most provider types, the proportion of CCBHCs that included them on treatment teams did not change substantially from DY1 to DY2 (Table III.6). A larger proportion of clinics wrote in "other" types of providers as participants in treatment teams in DY2 compared with DY1 (an explanation of these providers appears in Table III.7). However, the proportion of clinics that reported the inclusion of consumers or clients on treatment teams decreased by 10 percentage points from DY1 to DY2. We have no further information to validate or explain this finding. In Nevada, all of the CCBHCs continued to include primary care providers on treatment teams in DY2, whereas the same approach was less common in other states.
| TABLE III.6. Types of Providers Participating in CCBHC Treatment Teams | ||||
|---|---|---|---|---|
| Type of Provider | Number and Proportion of CCBHCs that Included Providers on Treatment Teams, 2018 |
Number and Proportion of CCBHCs that Included Providers on Treatment Teams, 2019 |
||
| N | % | N | % | |
| MH clinicians | 67 | 100 | 66 | 100 |
| Case managers | 67 | 100 | 64 | 97 |
| SUD treatment providers | 66 | 99 | 64 | 97 |
| Psychiatrists | 63 | 94 | 60 | 91 |
| Consumers/clients | 62 | 93 | 55 | 83 |
| Community support and social service providers | 56 | 84 | 51 | 77 |
| Consumer/client family members | 52 | 78 | 51 | 77 |
| Primary care physicians | 36 | 54 | 32 | 48 |
| Other | 31 | 46 | 36 | 55 |
| Total CCBHCs | 67 | 100 | 66 | 100 |
| SOURCE: CCBHC Annual Progress Report Demonstration Year 1 and Year 2 data collected by Mathematica and the RAND Corporation, March 2018 and March 2019. NOTES: See Appendix Table A.17 for state-level findings. |
||||
CCBHCs reported that a wide range of "other" types of providers and partners participated in treatment teams in both years of the demonstration (Table III.7), as demonstrated by the following:
-
Twenty-nine percent of clinics (n = 19) included peers on treatment teams in DY2 compared to 19 percent (n = 13) in DY1.
-
Twenty percent of clinics (n =19) included nursing staff on treatment teams in DY2 compared to 8 percent (n = 5) in DY1.
-
Five percent of clinics (n = 3) included corrections staff, such as external probation or parole officers, on treatment teams in DY2 compared to zero percent in DY1.
The findings underscore the importance of these various provider types in CCBHCs' delivery of services, which seems to have grown as the demonstration progressed. Consistent with these findings, and as noted in previous sections, officials in most states mentioned the crucial role played by peers on treatment teams.
| TABLE III.7. Types of "Other" Providers or Partners that Participated in CCBHC Treatment Teams | ||||
|---|---|---|---|---|
| "Other" Provider or Partner Type | "Other" Providers or Partners that Participated in CCBHC Treatment Teams, March 2018 (DY1) |
"Other" Providers or Partners that Participated in CCBHC Treatment Teams, March 2019 (DY2) |
||
| N | % | N | % | |
| Peer support staff | 13 | 19 | 19 | 29 |
| Family support providers | 5 | 8 | 3 | 5 |
| Nursing staff | 5 | 8 | 13 | 20 |
| Care coordinators | 3 | 5 | 3 | 5 |
| Guardians | 2 | 3 | 3 | 5 |
| School staff | 1 | 2 | 4 | 6 |
| Corrections staff | 0 | 0 | 3 | 5 |
| Total CCBHCs | 67 | 100 | 66 | 100 |
| SOURCE: CCBHC Annual Progress Report Demonstration Year 1 and Year 2 data collected by Mathematica and the RAND Corporation, March 2018 and March 2019. | ||||
In both years, CCBHCs more often received notifications about consumers' treatment at external facilities for behavioral health conditions than for physical health conditions (Figure III.9 and Figure III.10). However, the rate of notifications about physical health conditions increased between DY1 and DY2, whereas some notifications for behavioral health conditions declined. In DY1, 88 percent of clinics (n = 59) reported that they received notifications when hospitals treated their consumers' behavioral health conditions compared with 71 percent (n = 47) in DY2 (Figure III.9). Conversely, 37 percent of clinics (n = 25) reported that they received notification from emergency departments when they treated consumers' physical health conditions in DY1 compared with 53 percent (n = 35) in DY2 (Figure III.10).
| FIGURE III.9. Proportion of CCBHCs that Received Notification about Consumers' Treatment for Behavioral Health Conditions |
|---|
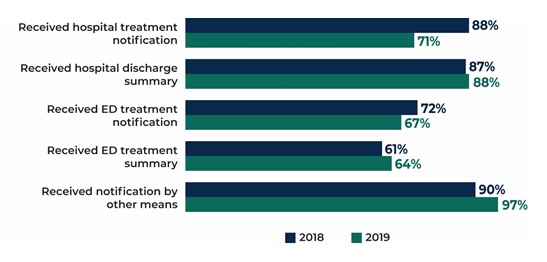 |
| SOURCE: CCBHC Annual Progress Report Demonstration Year 1 and Year 2 data collected by Mathematica and the RAND Corporation, March 2018 and March 2019. NOTES: See Appendix Table A.18 for detailed findings and the number of clinics that correspond to the percentages. See Appendix Table A.19 for state-level findings. |
| FIGURE III.10. Proportion of CCBHCs that Received Notification about Consumers' Treatment for Physical Health Conditions |
|---|
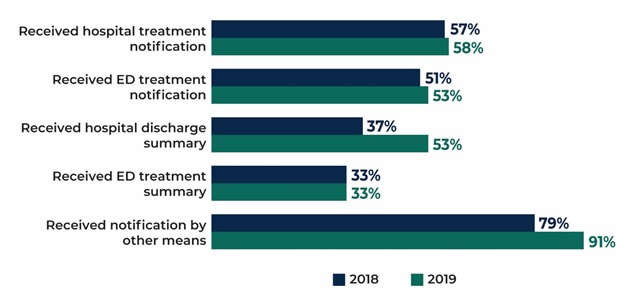 |
| SOURCE: CCBHC Annual Progress Report Demonstration Year 1 and Year 2 data collected by Mathematica and the RAND Corporation, March 2018 and March 2019. NOTES: See Appendix Table A.18 for detailed findings and the number of clinics that correspond to the percentages. See Appendix Table A.20 for state-level findings. |
Over 90 percent of CCBHCs reported that they received notifications by "other means" when their consumers were treated for either behavioral health (97 percent of clinics, n = 64) or physical health conditions (91 percent, n = 60) in DY2. The figures represent an increase of 9 percentage points for behavioral health conditions and 13 percentage points for physical health conditions from DY1 (Figure III.9 and Figure III.10). A new progress report question in DY2 allowed clinics to describe these "other means" (not shown in the below figures). By far the most common were direct reports by consumers (33 percent, n = 22) and consumers' families (38 percent, n = 25). Other notification sources included consumers' PCPs and other providers (12 percent, n = 8), corrections and law enforcement officers (9 percent, n = 6), crisis centers including crisis DCOs (6 percent, n = 4), and insurance agencies (6 percent, n = 4).
Although not a widespread practice, officials in some states described statewide efforts to use HIT to alert clinics about CCBHC consumers' use of other health care services. For example, in Missouri, the state Medicaid agency provides CCBHCs with lists of Medicaid consumers who are hospitalized once Medicaid is notified via authorization. In New Jersey, CCBHCs receive Admission, Discharge, Transfer alerts electronically when a client is admitted to a hospital, transferred to another facility, or discharged from the hospital, thereby allowing clinics to follow up with clients while in the hospital or shortly after discharge.
2. Have CCBHCs Sustained Relationships with DCOs?
Although still relatively uncommon, the number and variety of DCO relationships increased from DY1 to DY2. As of the DY1 progress report, CCBHCs most frequently relied on DCOs for the provision of suicide/crisis services; otherwise, DCO relationships were not common (Table III.8). In DY2, DCOs providing suicide/crisis services were still by far the most common type of DCO; 30 percent of CCBHCs (n = 20) reported a relationship with a DCO to provide suicide/crisis hotlines or warmlines compared with 28 percent (n = 19) in DY1. Clinics in the same four of the eight demonstration states (Missouri, New Jersey, New York, and Pennsylvania) reported DCO relationships with suicide/crisis hotlines and warmlines in DY1 and DY2. Officials in these states noted that reliance on a DCO for such services made sense because the services are specialized and relatively low-volume.
Other than suicide/crisis services, the variety of facility/provider types with which CCBHCs established DCO partnerships as of the DY2 progress report increased from the previous year (Table III.8). CCBHCs reported DCO relationships with the following ten new types of providers in DY2, eight of which are not traditional health care providers:
-
Post-detoxification step-down facilities (5 percent of CCBHs, n = 3).
-
Schools (3 percent of CCBHs, n = 2).
-
Adult criminal justice agencies/courts (3 percent of CCBHs, n = 2).
-
Mental health/drug courts (3 percent of CCBHs, n = 2).
-
School-based health centers (2 percent of CCBHs, n = 1).
-
Homeless shelters (2 percent of CCBHs, n = 1).
-
Housing agencies (2 percent of CCBHs, n = 1).
-
Older adult services (2 percent of CCBHs, n = 1).
-
U.S. Department of Veterans Affairs (VA) treatment facilities (2 percent of CCBHs, n = 1).
-
Urgent care centers (2 percent of CCBHCs, n = 1).
In addition, the number of DCO relationships with facility/provider types with which clinics reported DCO relationships in DY1 increased in DY2, including, for example:
-
MAT providers (from 3 percent of CCBHCs [n = 2] in DY1 to 9 percent [n = 6] in DY2).
-
FQHCs (from 3 percent of CCBHCs [n = 2] in DY1 to 8 percent [n = 5] in DY2).
-
Employment services and/or supported employment (from 3 percent of CCBHCs [n = 2] in DY1 to 8 percent [n = 5] in DY2).
In general, social and human service providers such as schools; criminal justice agencies; and employment, older adult, and peer service providers seemed to be emerging as increasingly important for DCO relationships, whereas inpatient behavioral health-related facilities were the only type of DCO to decrease in number from DY1 to DY2. However, the findings in this paragraph and in the above bullets should be interpreted with caution. Although CCBHCs reported that they established formal DCO relationships with a variety of new types of providers, it is unclear how some of these entities (e.g., criminal justice agencies/courts and mental health/drug courts) could provide CCBHC services on clinics' behalf. In addition, as indicated below, state officials maintained throughout both demonstration years that CCBHCs rarely engaged DCOs and instead preferred to provide CCBHC services directly.
At the state level, Minnesota, Missouri, and especially New York reported substantial increases in DCO relationships from DY1 to DY2. CCBHCs in New York doubled the number of DCOs, from 15 in DY1 to 30 in DY2. CCBHCs in Minnesota reported zero DCOs in DY1 but added three in DY2. With Minnesota CCBHCs establishing their first DCOs in the 12 months before the DY2 progress report, Oklahoma became the only state without a DCO as of the DY2 progress report.
| TABLE III.8. Number and Proportion of CCBHCs that had DCO Relationships with Other Facilities and Providers in DY1 and DY2 | ||||
|---|---|---|---|---|
| Facility/Provider Typea | DCO (as of March 2018) | DCO (as of March 2019) | ||
| N | % | N | % | |
| FQHCs | 2 | 3 | 5 | 8 |
| Rural health clinics | 0 | 0 | 0 | 0 |
| Primary care providers | 2 | 3 | 3 | 5 |
| Inpatient psychiatric facilities | 1 | 1 | 0 | 0 |
| Psychiatric residential treatment facilities | 1 | 1 | 0 | 0 |
| SUD residential treatment facilities | 3 | 4 | 3 | 5 |
| Medical detoxification facilities | 2 | 3 | 2 | 3 |
| Ambulatory detoxification facilities | 1 | 1 | 2 | 3 |
| Post-detoxification step-down facilities | 0 | 0 | 3 | 5 |
| Residential (non-hospital) crisis settings | 3 | 4 | 2 | 3 |
| MAT providers for substance use | 2 | 3 | 6 | 9 |
| Schools | 0 | 0 | 2 | 3 |
| School-based health centers | 0 | 0 | 1 | 2 |
| Child welfare agencies | 0 | 0 | 0 | 0 |
| Therapeutic foster care service agencies | 0 | 0 | 0 | 0 |
| Juvenile justice agencies | 0 | 0 | 0 | 0 |
| Adult criminal justice agencies/courts | 0 | 0 | 2 | 3 |
| MH/drug courts | 0 | 0 | 2 | 3 |
| Law enforcement | 0 | 0 | 0 | 0 |
| Indian Health Service or other tribal programs | 0 | 0 | 0 | 0 |
| Indian Health Service youth regional treatment centers | 0 | 0 | 0 | 0 |
| Homeless shelters | 0 | 0 | 1 | 2 |
| Housing agencies | 0 | 0 | 1 | 2 |
| Suicide/crisis hotlines and warmlines | 19 | 28 | 20 | 30 |
| Employment services and/or supported employment | 2 | 3 | 5 | 8 |
| Older adult services | 0 | 0 | 1 | 2 |
| Other social and human service providers | 2 | 3 | 4 | 6 |
| Consumer-operated/peer service provider organizations | 3 | 4 | 4 | 6 |
| VA treatment facilities | 0 | 0 | 1 | 2 |
| Urgent care centers | 0 | 0 | 1 | 2 |
| EDs | 2 | 3 | 4 | 6 |
| Hospital outpatient clinics | 0 | 0 | 0 | 0 |
| Total CCBHCs | 67 | 100 | 66 | 100 |
| SOURCE: CCBHC Annual Progress Report Demonstration Year 1 and Year 2 data collected by Mathematica and the RAND Corporation, March 2018 and March 2019. NOTES: See Appendix Table A.21 for state-level findings.
|
||||
In the first year of the demonstration, state officials offered several reasons for why CCBHCs strongly prefer to provide services directly rather than establish a formal financial relationship with a DCO. CCBHCs' concerns extend to the legal requirements governing and other specifications related to formal DCO agreements, the need to share sensitive information about clients with external providers, and uncertainties about payment through the PPS. Consistent with their perceptions reported during the demonstration's first year, state officials universally indicated in DY2 that DCOs have not been an important component of the CCBHC model in their states. Officials reported that most clinics preferred to build and provide the full scope of CCBHC services directly for the following three primary reasons:
-
Officials in three states remarked that an overarching deterrent to widespread development of DCO relationships was clinics' reluctance to assume responsibility for the oversight of another provider's services and data. As an official in Minnesota noted, clinics "shied away from wanting to have to hold other organizations accountable for the quality standards and training and everything so chose to develop services they didn't already offer internally."
-
Officials also suggested that CCBHCs wished to meet fully all the CCBHC criteria on their own and to develop comprehensive programs themselves. An official in New Jersey perceived that the state's clinics "all truly wanted to meet the requirements and wanted to be the true CCBHC and meet the model...for all the work they were going to have to do to manage the DCO relationship, it was going to be better for their models and financing models to grow their programs in house."
-
Officials also cited ongoing concerns about the process for billing for services provided by DCOs. Officials in two states noted that CCBHCs were unfamiliar with and challenged by the provider-to-provider reimbursement arrangement required for DCOs. Setting up agreements and contracts and then adjusting accounting systems to allow for payments to be made to DCOs took time and required significant state oversight and monitoring to ensure compliance with billing requirements.
Officials in three states noted that crisis services were the exception to CCBHCs' reluctance to engage DCOs; in part, the exception reflects the close formal partnerships between CCBHCs and crisis providers that predated the demonstration, thus making reliance on these providers much less complicated and more familiar for clinics.
3. Are CCBHCs in the State Providing CCBHC Services in Collateral Agencies such as Schools and Shelters?
CCBHCs reported that they worked with and in a wide variety of facilities and providers to deliver services to consumers, including social and human service agencies such as schools and shelters. Fifty-five percent of clinics (n = 34) in DY1 and 45 percent (n = 30) in DY2 described delivering services in a wide range of external locations, including schools and shelters, as a way for best reaching consumers. Nine percent of clinics (n = 6) reported that they provided services in homeless shelters in DY1, increasing slightly to 11 percent (n = 7) in DY2. More information about CCBHCs' service provision in external locations appears in Section B.
As mentioned, DCO relationships with schools, school-based health centers, and homeless shelters increased from DY1 to DY2 (Table III.8). Outside of formal DCO partnerships, CCBHCs continued to work with a broad range of facilities and providers, again including schools and shelters (Table III.9), as described below:
-
Other formal (non-DCO) relationships with schools stayed relatively steady at about three-quarters of clinics in both DY1 and DY2; in fact, schools were the facilities/providers with which CCBHCs most often reported a formal (non-DCO) relationship in DY2.
-
Informal relationships with schools decreased from 29 percent of clinics (n = 19) in DY1 to 18 percent (n = 12) in DY2.
-
Informal relationships with school-based health centers decreased from 30 percent of clinics (n = 20) in DY1 to 18 percent (n = 12) in DY2, but formal (non-DCO) relationships with school-based health centers increased from 31 percent of clinics (n = 21) in DY1 to 42 percent (n = 28) in DY2.
-
CCBHC relationships with homeless shelters stayed relatively steady over time, with approximately 43 percent of clinics reporting formal (non-DCO) relationships with shelters and approximately 48 percent reporting informal relationships in both DY1 and DY2.
In interviews, officials highlighted several specific efforts to extend the reach of CCBHCs into external organizations, such as the following:
-
New York officials discussed efforts to enhance services in schools, noting that clinics "are doing a lot of school-based expansions and establishing satellites in the schools. The school districts want staff on-site, so they are supportive, and the relationships are good." Officials in Missouri also mentioned growth in school-based services throughout the demonstration.
-
As noted in Section A, one Minnesota clinic was able to embed staff at a local library as a way to address mental health challenges for people experiencing homelessness who often spend time at the library. The state also reported on efforts to develop and embed care coordination staff in locations specific to particular target populations, such as those in the criminal justice system and tribal populations.
-
Officials in three states commented that CCBHCs have made efforts to send a variety of staff (peers and care coordinators, for example) into hospitals and crisis centers and to work with first responders to engage clients experiencing crises. An official in Oklahoma, for example, noted that "CCBHCs are getting much more proactive about having staff that go regularly to the crisis centers or urgent care centers so that they can intervene as quickly as possible with their clients who may be going into...to get them out of crisis as quickly as possible. And to go regularly to the hospital...to ensure more smooth transitions."
4. Have CCBHCs and DCOs Sustained Relationships with Other Providers?
CCBHCs have established and maintained formal (non-DCO) and informal relationships with a wide variety of external providers, with some variation over time (Table III.9). Fifty percent of clinics reported formal (non-DCO) relationships with external facilities/providers in DY2, slightly lower than the 53 percent that reported such relationships in DY1. The most common types of facilities/providers with which clinics reported having formal (non-DCO) relationships follow (Table III.9):
-
In DY1, inpatient psychiatric facilities (78 percent of clinics; n = 52) and mental health/drug courts (78 percent of clinics; n = 52).
-
In DY2, schools (79 percent of clinics; n = 52) and mental health/drug courts (76 percent of clinics; n = 50).
The least common type of facilities/providers with which CCBHCs reported formal (non-DCO) relationships in both years were HHS Indian Health Service youth regional treatment centers; only 6 percent of clinics (n = 4) had established such relationships in DY1 or DY2.
Formal (non-DCO) relationships increased with two types of facilities/providers over time: school-based health centers--from 31 percent of clinics (n = 21) in DY1 to 42 percent (n = 28) in DY2--and urgent care centers--from 31 percent of clinics (n = 21) in DY1 to 41 percent (n = 27) in DY2. However, formal (non-DCO) relationships decreased over time with a greater number of facility/provider types: primary care providers, inpatient psychiatric facilities, medical detoxification facilities, MAT providers, child welfare agencies, and suicide/crisis hotlines and warmlines (percentages and numbers appear in Table III.9).
Thirty-six percent of CCBHCs reported informal relationships with external facilities/providers in DY2, similar to the 37 percent reporting the same relationships in DY1. Hospital outpatient clinics were the facility with which the highest proportion of CCBHCs reported informal relationships in both years: 55 percent (n = 37) in DY1 and 52 percent (n = 34) in DY2 (Table III.8). Similar to formal relationships, informal relationships with Indian Health Services youth regional treatment centers were uncommon, with only 19 percent of clinics (n = 13) reporting such relationships in DY1 and 15 percent (n = 10) in DY2.
In general, informal relationships between CCBHCs and external facilities/providers were somewhat steadier over time than formal (non-DCO) relationships, with only VA treatment facilities, emergency departments, and schools and school-based health centers showing meaningful decreases over time, and only inpatient psychiatric facilities showing a meaningful increase (numbers and percentages in Table III.9). The latter may be related to the decrease in DCO and other formal (non-DCO) relationships with inpatient psychiatric facilities from DY1 to DY2. Similarly, the decrease in informal CCBHC relationships with schools and school-based health centers may be related to the increase in DCO and other formal (non-DCO) relationships with these facilities (Table III.8 and Table III.9).
| TABLE III.9. Number and Proportion of CCBHCs that have Formal (non-DCO) and Informal Relationships with Other Facilities and Providers in DY1 and DY2 | ||||||||
|---|---|---|---|---|---|---|---|---|
| Facility/Provider Typea | Formal (non-DCO) Relationship (as of March 2018) |
Formal (non-DCO) Relationship (as of March 2019) |
Informal Relationship (as of March 2018) |
Informal Relationship (as of March 2019) |
||||
| N | % | N | % | N | % | N | % | |
| FQHCs | 40 | 60 | 39 | 59 | 19 | 28 | 17 | 26 |
| Rural health clinics | 21 | 31 | 21 | 32 | 12 | 18 | 13 | 20 |
| Primary care providers | 48 | 72 | 41 | 62 | 25 | 37 | 27 | 41 |
| Inpatient psychiatric facilities | 52 | 78 | 45 | 68 | 19 | 28 | 26 | 39 |
| Psychiatric residential treatment facilities | 40 | 60 | 35 | 53 | 28 | 42 | 30 | 45 |
| SUD residential treatment facilities | 43 | 64 | 40 | 61 | 28 | 42 | 24 | 36 |
| Medical detoxification facilities | 42 | 63 | 34 | 52 | 23 | 34 | 28 | 42 |
| Ambulatory detoxification facilities | 32 | 48 | 30 | 45 | 26 | 39 | 27 | 41 |
| Post-detoxification step-down facilities | 31 | 46 | 28 | 42 | 24 | 36 | 27 | 41 |
| Residential (non-hospital) crisis settings | 35 | 52 | 31 | 47 | 24 | 36 | 21 | 32 |
| MAT providers for substance use | 43 | 64 | 35 | 53 | 20 | 30 | 25 | 38 |
| Schools | 51 | 76 | 52 | 79 | 19 | 28 | 12 | 18 |
| School-based health centers | 21 | 31 | 28 | 42 | 20 | 30 | 12 | 18 |
| Child welfare agencies | 43 | 64 | 36 | 55 | 26 | 39 | 31 | 47 |
| Therapeutic foster care service agencies | 31 | 46 | 26 | 39 | 31 | 46 | 31 | 47 |
| Juvenile justice agencies | 38 | 57 | 34 | 52 | 26 | 39 | 29 | 44 |
| Adult criminal justice agencies/courts | 51 | 76 | 45 | 68 | 19 | 28 | 19 | 29 |
| MH/drug courts | 52 | 78 | 50 | 76 | 15 | 22 | 16 | 24 |
| Law enforcement | 36 | 54 | 35 | 53 | 32 | 48 | 31 | 47 |
| Indian Health Service or other tribal programs | 10 | 15 | 11 | 17 | 18 | 27 | 13 | 20 |
| Indian Health Service youth regional treatment centers | 4 | 6 | 4 | 6 | 13 | 19 | 10 | 15 |
| Homeless shelters | 28 | 42 | 29 | 44 | 33 | 49 | 31 | 47 |
| Housing agencies | 40 | 60 | 40 | 61 | 30 | 45 | 25 | 38 |
| Suicide/crisis hotlines and warmlines | 38 | 57 | 30 | 45 | 15 | 22 | 16 | 24 |
| Employment services and/or supported employment | 35 | 52 | 34 | 52 | 29 | 43 | 24 | 36 |
| Older adult services | 27 | 40 | 26 | 39 | 30 | 45 | 33 | 50 |
| Other social and human service providers | 38 | 57 | 34 | 52 | 35 | 52 | 31 | 47 |
| Consumer-operated/peer service provider organizations | 26 | 39 | 29 | 44 | 31 | 46 | 28 | 42 |
| VA treatment facilities | 37 | 55 | 33 | 50 | 32 | 48 | 26 | 39 |
| Urgent care centers | 21 | 31 | 27 | 41 | 29 | 43 | 24 | 36 |
| EDs | 45 | 67 | 48 | 73 | 26 | 39 | 20 | 30 |
| Hospital outpatient clinics | 29 | 43 | 28 | 42 | 37 | 55 | 34 | 52 |
| Total CCBHCs | 67 | 100 | 67 | 100 | 66 | 100 | 66 | 100 |
| SOURCE: CCBHC Annual Progress Report Demonstration Year 1 and Year 2 data collected by Mathematica and the RAND Corporation, March 2018 and March 2019. NOTES: Columns are not mutually exclusive. See Appendix Table A.22 for state-level findings.
|
||||||||
Officials in all states confirmed that CCBHCs have succeeded in building and sustaining relationships with external providers. Officials in most states suggested that clinics focused more on fostering informal rather than formal relationships because the execution of formal care coordination agreements with external organizations was burdensome and not needed to maintain effective relationships. For example, an official in Minnesota commented that "the piece that they found really challenging is that getting actual written care coordination agreements in place. It was pretty easy getting them from community providers they've been working with for years. But what was very difficult to do was getting care coordination agreements with hospitals, getting through the legal systems with hospitals. I don't know that anyone got one. Schools were another. Places where they were already providing mental health services in schools could go with a simpler agreement. But overall they didn't find care coordination agreements helpful." Officials in three states mentioned that establishing formal partnerships with VA facilities proved particularly challenging. The challenges stemmed primarily from an inability to execute formal care coordination agreements. One official noted, for instance, that the VA requested changes to the care coordination agreement that would not align with demonstration requirements for such agreements. Despite challenges with entering into formal care coordination agreements, officials in the three states indicated that CCBHCs maintained productive informal relationships with local VA providers in order to coordinate care for veterans.
Despite the challenges associated with entering into formal care coordination agreements, officials universally agreed that CCBHCs have succeeded in cultivating informal relationships with partner community organizations, noting, for example, that "it helps that these clinics had already done a tremendous amount of work forging connections; that's just how it works with community mental health that you are building connections in the community. They've built new connections through CCBHC, and have even made very strong connections with one another." An official in New Jersey commented that, during state site visits, one clinic reported that it participated in daily telephone calls with the other entities with which it coordinates service delivery, such as hospitals and urgent care centers, to ensure that it works "the human angle with partners."
Some states have taken extra steps to help foster relationships between CCBHCs and external providers and facilitate coordinated care. Oklahoma, for example, developed a "most in need" list of consumers who account for the most crisis center and inpatient stays, distributed a clinic-specific list to each CMHC with a state contract that identified the clinic's consumers who are on the state's "most in need" list, and asked the clinics to prioritize stabilization of these individuals. The state has convened and participated in "grand staffing" conversations that bring together different types of providers and entities (e.g., CCBHCs, law enforcement, hospitals) to develop strategies for assisting those in greatest need of care coordination. The state noted that the enhanced funding that CCBHCs receive under the demonstration permits CCBHCs to think "outside the box" and develop different or more creative solutions to meeting the needs of high-need clients.
In Nevada, officials described as particularly helpful a set of demonstration requirements for outreach to and engagement with a variety of external providers, such as hospitals and law enforcement, noting that "the collaboration was profound because CCBHCs engaged law enforcement and other providers so the CCBHC became the initial point of contact for people in need of behavioral health [care] instead of civil commitment, jail, or emergency room...their presence and action have now made them a reliable resource for people in need of BH instead of civil commitment, jail, or emergency room." To assist clinics further in measuring the effect of and improving such coordination efforts, the state has developed a concise data collection tool to capture the number of individuals diverted from jail or emergency rooms.
5. Have CCBHCs Adopted or Altered EHR or HIT Systems as a Result of the Demonstration?
A majority of CCBHCs made changes to their EHR or HIT systems as a result of the CCBHC certification process and during the demonstration period. As of the DY1 progress report, 97 percent of clinics (n = 65) reported that they altered their EHR or HIT systems to meet CCBHC certification, and 33 percent (n = 22) adopted a new EHR or HIT system as part of the CCBHC certification process. As of the DY2 progress report, 67 percent of clinics (n = 44) reported that they modified their EHR or HIT systems in the past 12 months (state-level findings appear in Appendix Table A.23).
The CCBHCs demonstrated wide variation in the functionalities of their EHR systems, although those functionalities did not change in any meaningful way over time (Table III.10). All clinics reported that their EHRs included mental health, SUD, and case management or care coordination records in both DY1 and DY2. (For most clinics, these features were not new as a result of CCBHC certification [not shown in Table III.10].) Quality measure reporting capability, generation of electronic care plans, and electronic prescribing were also available in over 90 percent of clinics in both years. Less common EHR features in both years included the incorporation of primary care records, the ability to communicate with laboratories to request tests or receive results, and the capacity for electronic exchange of clinical information with DCOs or other external providers.
| TABLE III.10. Functions of CCBHC EHR and HIT Systems | ||||
|---|---|---|---|---|
| Function | Number and Proportion of CCBHCs that Reported Function, 2018 |
Number and Proportion of CCBHCs that Reported Function, 2019 |
||
| N | % | N | % | |
| EHR contains MH records | 67 | 100 | 66 | 100 |
| EHR contains SUD records | 67 | 100 | 66 | 100 |
| EHR contains case management or care coordination records | 67 | 100 | 66 | 100 |
| EHR has quality measure reporting capabilities | 63 | 94 | 61 | 92 |
| EHR generates electronic care plan | 62 | 93 | 61 | 92 |
| EHR uses any form of electronic prescribing | 61 | 91 | 63 | 95 |
| EHR incorporates laboratory results into health record | 55 | 82 | 53 | 80 |
| EHR provides clinical decision support | 52 | 79 | 54 | 82 |
| EHR contains primary care records | 41 | 61 | 37 | 56 |
| EHR communicates with laboratory to request tests or receive results | 38 | 57 | 38 | 58 |
| EHR allows electronic exchange of clinical information with other external providers | 31 | 46 | 30 | 45 |
| EHR allows electronic exchange of clinical information with DCOs | 26 | 39 | 20 | 30 |
| Total CCBHCs | 67 | 100 | 66 | 100 |
| SOURCE: CCBHC Annual Progress Report Demonstration Year 1 and Year 2 collected by Mathematica and the RAND Corporation, March 2018 and March 2019. NOTES: See Appendix Table A.23 for state-level findings |
||||
CCBHCs were at different starting points at the demonstration's outset with respect to their EHR or HIT systems, but officials in all states reported that substantial changes to EHRs were required in the early stages of the demonstration to permit clinics to improve care coordination, meet demonstration reporting requirements, and facilitate billing through the PPS. In Pennsylvania, for example, officials mentioned that "some clinics went from paper records to a new EHR, other clinics were changing an EHR vendor, or staying with EHR but needing to modify the system to work for the CCBHC." Officials in several states cited EHRs as central facilitators of care coordination, noting, for example, that the integration of treatment plans and physical and behavioral health care records has enabled providers engage in improved communication about a client's care. In Minnesota, officials reported that clinics "retooled all of their EHRs so that they could do integrated treatment planning and assessments, and be able to have multidisciplinary teams be able to chart on a client and read material on a client across multiple service lines, and that's not generally how EHRs are designed."
Even though officials noted that most clinics resolved many EHR challenges in the first year of the demonstration, some minor challenges persisted into the second year. The challenges that stood out to officials as ongoing included the following:
-
Billing challenges. States noted that CCBHCs had to alter their electronic billing systems and processes significantly to account for the PPS and payments to DCOs, a process that was easier for some CCBHCs and vendors than for others. Some states reported that clinics' systems were not structured properly and, in at least one case, required a clinic to resubmit claims.
-
Quality measure data collection and reporting. States noted that CCBHCs had to make significant changes to electronic systems to build assessment tools into their EHRs, allow for the collection of data elements for the clinic-reported quality measures, and permit clinics to run reports for submission to states.
In August 2019, we will submit a report that summarizes information on clinics' experiences with billing and the cost reports and on the progress that CCBHCs and states are making toward submission of the required quality measures.
IV. CONCLUSIONS AND FUTURE EVALUATION ACTIVITIES
In the demonstration's second year, CCBHCs and states built on and further refined efforts to hire and maintain staff, increase access to care, sustain the full scope of CCBHC services, and ensure coordinated care for CCBHC clients. Although some CCBHCs experienced challenges related to staffing or the implementation of new services, state officials reported that CCBHCs generally addressed these challenges and, since then, have consistently adhered to the demonstration criteria.
With few exceptions, CCBHCs were able to hire and maintain the required types of staff throughout the demonstration. The first and second years of the demonstration saw little difference in the proportion of CCBHCs that employed most required staff types. In the categories in which fewer clinics employed staff in DY2 than in DY1, reductions in staff employment were minimal. Such changes in staffing may suggest clinics' efforts to experiment and identifying ways to use staff and resources more efficiently. CCBHCs and states reported that clinics faced several ongoing challenges associated with hiring and retaining staff, including, for example, uncertainty around the future of the demonstration, retaining enough of each staff type to meet increased demand for services, and increases in caseloads and responsibilities leading to staff burnout. However, officials generally perceived that clinics effectively used strategies such as increased salaries and benefits to overcome challenges.
In the second demonstration year, CCBHCs and states continued to focus on making services more accessible and increasing consumer engagement. States reported that the most common strategy that CCBHCs used to increase service access was the introduction of open-access scheduling. CCBHCs also have continued to provide services in locations outside of the clinic and make broad use of telehealth to extend the reach of CCBHC services. Stakeholder organizations representing consumers and families reported that the strategies adopted by CCBHCs, such as open-access scheduling and expanded hours of service provision, have significantly improved access to care for CCBHC clients in their states.
Officials in all states perceived that clinics were able to sustain delivery of the nine core CCBHC services throughout the demonstration, a finding confirmed by clinics in the progress report. Nearly all CCBHCs in both DY1 and DY2 reported that they provided the required services, with the exception of intensive community-based mental health services for members of the armed forces and veterans; about 70 percent of clinics provided those services in both years. States speculated that the armed forces/veteran populations did not comprise a large percentage of CCBHC clients and that CCBHCs may have struggled to engage members of these groups and to develop strong referral relationships and care coordination agreements with VA providers. Though not required by the demonstration, a smaller number of clinics provided on-site primary care; only about half of clinics provided this service in either demonstration year.
CCBHCs were able to add and sustain a range of EBPs across demonstration years. In addition, provision of many EBPs by DCOs increased substantially in the second demonstration year. Early in the demonstration, CCBHCs generally addressed the challenges to maintaining EBPs and providing the full scope of CCBHC services, although officials continued to explore ways to support clinics' efforts to offer the full range of services. For example, officials granted CCBHCs increased flexibility to tailor EBPs and other services more precisely to the needs and preferences of their client populations.
CCBHCs have used a variety of strategies to improve care coordination, including the addition of various provider types to treatment teams and the expansion of targeted care coordination strategies to different populations and service lines. Improvements to EHR and HIT systems in the early stages of the demonstration aided clinics' care coordination efforts, in some cases permitting CCBHCs to better integrate care plans, create linkages with external providers, and receive alerts about clients' care transitions.
CCBHCs did not, for the most part, engage DCOs to provide services; instead, they elected to offer the full scope of CCBHCs services directly, although reliance on DCOs did increase slightly in the second demonstration year. Officials suggested that CCBHCs preferred to provide services directly out of a clear desire to embrace the model fully and a reluctance to assume responsibility for the oversight of another provider's services. CCBHCs did, however, continue to provide and expand services in collateral agencies such as schools and shelters, and they built and sustained close formal and informal relationships with a range of external providers.
States and clinics alike described a need for flexibility within the CCBHC model to adjust requirements and practices to best suit the needs of the consumers over the course of the demonstration. For example, some states and clinics found that consumers were not availing themselves of certain required EBPs or access requirements as frequently as expected, and modified these practices to better reflect actual patterns of use. Other findings in the report may point to additional experimentation and fine-tuning of demonstration practices from DY1 to DY2. For instance, some changes in staffing or the composition of care teams may be the result of clinics identifying more efficient and effective ways of providing required CCBHC services.
A. Future Evaluation Activities
This report updated the initial snapshot of early implementation of the demonstration based on interviews with state officials and progress reports submitted by CCBHCs. The update includes data from additional interviews with state officials and consumer and family organizations, site visits to CCBHCs, and progress reports submitted by CCBHCs.
In August 2019, we will submit a report summarizing information from the first year of CCBHC cost reports. Drawing on information from our interviews and site visits, the report will provide an overview of clinics' experience with the PPS and the progress made by CCBHCs and states as they work toward submission of the required quality measures. We will update the report in August 2020 to include information from the second year of CCBHC cost reports and will summarize the quality of care provided to CCBHC consumers by using data from the CCBHC-reported and state-reported quality measures. Our plans to submit these reports as scheduled are dependent on our receipt of the cost reports and quality measures without substantial delays.
We are in the process of obtaining Medicaid claims and encounter data from states to examine changes in service utilization and costs. We plan to examine the impacts of CCBHC services on: (1) hospitalization rates; (2) emergency department service utilization; and (3) ambulatory care relative to within-state comparison groups (Medicaid beneficiaries with similar diagnostic and demographic characteristics who did not receive care from CCBHCs). Depending on the availability of data within each state, we expect that the impact analyses will use approximately four years of Medicaid claims/encounter data (up to a two-year pre-demonstration period and a two-year post-implementation period). We will report these findings in our final report in May 2021, along with updated findings that draw on both years of CCBHC cost reports and quality measures. Table IV.1 provides an overview of the timeline for submission of future deliverables and findings.
| TABLE IV.1. Timeline for Reporting Future Evaluation Findings | ||
|---|---|---|
| Reports to Congress | Mathematica/RAND Deliverable(s) to Inform Reports to Congress (submission month and year) |
Data Available for Deliverables (date of data collection) |
| 3 (December 2019) | Second implementation memorandum (June 2019) |
|
| Initial cost and quality report (August 2019) |
|
|
| 4 (December 2020) | Final cost and quality report (August 2020) |
|
| 5 (December 2021) | Final report (May 2021) |
|
APPENDIX A: CCBHC Demonstration Evaluation Progress Report Detailed and State-Level Tables
| TABLE A.1. CCBHC Staffing | ||||||||||
|---|---|---|---|---|---|---|---|---|---|---|
| Staff Type | Employed before CCBHC Certification |
Hired as Part of CCBHC Certification |
Hired after CCBHC Certification |
Employed as of March 2018a |
Employed as of March 2019 |
|||||
| N | % | N | % | N | % | N | % | N | % | |
| CCBHC medical director | 55 | 82 | 11 | 16 | 6 | 9 | 66 | 99 | 60 | 91 |
| Adult psychiatrists | 47 | 70 | 12 | 18 | 23 | 34 | 61 | 91 | 54 | 82 |
| Child/adolescent psychiatrists | 39 | 58 | 12 | 18 | 11 | 16 | 51 | 76 | 42 | 64 |
| Other psychiatrists | 29 | 43 | 8 | 12 | 9 | 13 | 40 | 60 | 31 | 47 |
| Nurses | 57 | 85 | 22 | 33 | 36 | 54 | 67 | 100 | 65 | 98 |
| LCSWs | 63 | 94 | 23 | 34 | 30 | 45 | 66 | 99 | 66 | 100 |
| Licensed psychologists | 30 | 45 | 7 | 10 | 9 | 13 | 35 | 52 | 29 | 44 |
| Licensed marriage and family therapists | 40 | 60 | 9 | 13 | 11 | 16 | 42 | 63 | 40 | 61 |
| Case management staff | 48 | 72 | 32 | 48 | 34 | 51 | 65 | 97 | 64 | 97 |
| Occupational therapists | 11 | 16 | 2 | 3 | 5 | 7 | 17 | 25 | 11 | 17 |
| SUD specialists | 61 | 91 | 25 | 37 | 32 | 48 | 67 | 100 | 61 | 92 |
| Bachelor's degree-level counselors | 49 | 73 | 14 | 21 | 19 | 28 | 50 | 75 | 51 | 77 |
| Associate's degree-level or non-degree counselors | 27 | 40 | 5 | 7 | 11 | 16 | 30 | 45 | 32 | 48 |
| MH professionals | 27 | 40 | 5 | 7 | 10 | 15 | 30 | 45 | 31 | 47 |
| Community health workers | 18 | 27 | 10 | 15 | 13 | 19 | 27 | 40 | 23 | 35 |
| Medical/nursing assistants | 28 | 42 | 12 | 18 | 15 | 22 | 37 | 55 | 38 | 58 |
| Pharmacy staff | 8 | 12 | 0 | 0 | 3 | 4 | 10 | 15 | 11 | 17 |
| Peer specialists/recovery coaches | 46 | 69 | 40 | 60 | 38 | 57 | 66 | 99 | 66 | 100 |
| Family support staff | 25 | 37 | 19 | 28 | 21 | 31 | 45 | 67 | 45 | 68 |
| Interpreters or linguistic counselors | 24 | 36 | 8 | 12 | 10 | 15 | 29 | 43 | 20 | 30 |
| Interns | 41 | 61 | 6 | 9 | 22 | 33 | 47 | 70 | 48 | 73 |
| Other clinician types | 29 | 43 | 17 | 25 | 22 | 33 | 37 | 55 | 38 | 58 |
| Total CCBHCs | 67 | 100 | 67 | 100 | 67 | 100 | 67 | 100 | 66 | 100 |
| SOURCE: CCBHC Annual Progress Report Demonstration Year 1 and Year 2 data collected by Mathematica and the RAND Corporation, March 2018 and March 2019. NOTES: Columns are not mutually exclusive because CCBHCs may have employed the same staff type before CCBHC certification and hired those staff as part of or after certification. Consistent with the CCBHC cost-reporting template, the MH professional category includes only providers trained and credentialed for psychological testing. "Other clinician types" is a write-in category.
|
||||||||||
| TABLE A.2. CCBHC Staffing, by State, 2019 | |||||||||
|---|---|---|---|---|---|---|---|---|---|
| Staff Type | State | Average Percentage of CCBHCs Across States |
|||||||
| Minnesota | Missouri | Nevada | New Jersey | New York | Oklahoma | Oregon | Pennsylvania | ||
| CCBHC medical director | 83% | 100% | 33% | 100% | 92% | 100% | 83% | 100% | 87% |
| Adult psychiatrists | 83% | 93% | 33% | 71% | 85% | 67% | 75% | 100% | 76% |
| Child/adolescent psychiatrists | 33% | 67% | 0% | 57% | 77% | 67% | 67% | 86% | 57% |
| Other psychiatrists | 0% | 73% | 33% | 43% | 62% | 67% | 17% | 57% | 44% |
| Nurses | 100% | 100% | 100% | 86% | 100% | 100% | 100% | 100% | 98% |
| LCSWs | 100% | 100% | 100% | 100% | 100% | 100% | 100% | 100% | 100% |
| Licensed psychologists | 100% | 73% | 0% | 29% | 23% | 33% | 25% | 43% | 41% |
| Licensed marriage and family therapists | 100% | 60% | 67% | 71% | 38% | 67% | 67% | 43% | 64% |
| Case management staff | 100% | 93% | 100% | 100% | 92% | 100% | 100% | 100% | 98% |
| Occupational therapists | 17% | 13% | 0% | 14% | 15% | 33% | 33% | 0% | 16% |
| SUD specialists | 83% | 93% | 100% | 86% | 92% | 100% | 100% | 86% | 93% |
| Bachelor's degree-level counselors | 83% | 80% | 100% | 71% | 69% | 67% | 92% | 57% | 77% |
| Associate's degree-level or non-degree counselors | 67% | 67% | 33% | 43% | 38% | 67% | 58% | 0% | 47% |
| MH professionals | 100% | 47% | 100% | 0% | 38% | 0% | 50% | 57% | 49% |
| Community health workers | 33% | 47% | 33% | 43% | 23% | 0% | 50% | 14% | 30% |
| Medical/nursing assistants | 83% | 47% | 33% | 57% | 62% | 100% | 58% | 43% | 60% |
| Pharmacy staff | 33% | 20% | 0% | 29% | 15% | 33% | 8% | 0% | 17% |
| Peer specialists/recovery coaches | 100% | 100% | 100% | 100% | 100% | 100% | 100% | 100% | 100% |
| Family support staff | 33% | 93% | 67% | 29% | 77% | 100% | 75% | 43% | 65% |
| Interpreters or linguistic counselors | 50% | 20% | 100% | 57% | 23% | 33% | 17% | 14% | 39% |
| Interns | 100% | 60% | 100% | 100% | 85% | 33% | 58% | 57% | 74% |
| Other clinician types | 33% | 67% | 67% | 71% | 54% | 100% | 42% | 57% | 61% |
| SOURCE: CCBHC Annual Progress Report Demonstration Year 2 data collected by Mathematica and the RAND Corporation, March 2019. NOTES: This table shows the percentage of CCBHCs, by state, that hired each staff type as of March 2019. This table corresponds with the column "Employed as of March 2019" from Appendix Table A.1. Cell values are calculated as a proportion of the total number of CCBHCs in each state: Minnesota = 6, Missouri = 15, Nevada = 3, New Jersey = 7, New York = 13, Oklahoma = 3, Oregon = 12, Pennsylvania = 7. Consistent with the CCBHC cost-reporting template, the MH professional category includes only providers trained and credentialed for psychological testing. "Other clinician types" is a write-in category. |
|||||||||
| TABLE A.3. Percentage of CCBHCs with Unfilled Staff Positions for 2 Months or Longer in the Past 12 Months, by State, 2019 | |||||||||
|---|---|---|---|---|---|---|---|---|---|
| Unfilled Staffing | State | Average Percentage of CCBHCs Across States |
|||||||
| Minnesota | Missouri | Nevada | New Jersey | New York | Oklahoma | Oregon | Pennsylvania | ||
| Any staff positions have gone unfilled for 2 months or longer during the past 12 months | 100% | 80% | 0% | 71% | 77% | 67% | 83% | 71% | 69% |
| SOURCE: CCBHC Annual Progress Report Demonstration Year 2 data collected by Mathematica and the RAND Corporation, March 2019. NOTES: Cell values are calculated as a proportion of the total number of CCBHCs in each state: Minnesota = 6, Missouri = 15, Nevada = 3, New Jersey = 7, New York = 13, Oklahoma = 3, Oregon = 12, Pennsylvania = 7. |
|||||||||
| TABLE A.4. CCBHC Staff Training in Required and Other Topics in the Past 12 Months, by State, 2019 | |||||||||
|---|---|---|---|---|---|---|---|---|---|
| Topic of Training | State | Average Percentage of CCBHCs Across States |
|||||||
| Minnesota | Missouri | Nevada | New Jersey | New York | Oklahoma | Oregon | Pennsylvania | ||
| Required by CCBHC Certification Criteria | |||||||||
| Risk assessment, suicide prevention, and suicide response | 100% | 100% | 100% | 100% | 100% | 100% | 100% | 100% | 100% |
| The role of family and peers in the delivery of care | 67% | 93% | 67% | 86% | 77% | 100% | 58% | 71% | 77% |
| Person and family-centered care | 83% | 80% | 100% | 71% | 100% | 100% | 83% | 71% | 86% |
| Recovery-oriented care | 83% | 87% | 100% | 100% | 69% | 100% | 42% | 86% | 83% |
| Evidence-based and trauma-informed care | 100% | 100% | 100% | 100% | 92% | 100% | 83% | 100% | 97% |
| Cultural competency training to address diversity within the organization's service population | 100% | 87% | 100% | 100% | 85% | 100% | 92% | 86% | 94% |
| Primary and behavioral health care integration | 33% | 87% | 100% | 100% | 77% | 100% | 67% | 86% | 81% |
| Other Trainings (not required) | |||||||||
| Other | 67% | 67% | 67% | 71% | 38% | 67% | 50% | 57% | 60% |
| Any traininga | 100% | 100% | 100% | 100% | 100% | 100% | 100% | 100% | 100% |
| None | 0% | 0% | 0% | 0% | 0% | 0% | 0% | 0% | 0% |
| SOURCE: CCBHC Annual Progress Report Demonstration Year 2 data collected by Mathematica and the RAND Corporation, March 2019. NOTES: Cell values are calculated as a proportion of the total number of CCBHCs in each state: Minnesota = 6, Missouri = 15, Nevada = 3, New Jersey = 7, New York = 13, Oklahoma = 3, Oregon = 12, Pennsylvania = 7.
|
|||||||||
| TABLE A.5. Changes to CCBHCs' Physical Space and Accessibility, by State, 2019 | |||||||||
|---|---|---|---|---|---|---|---|---|---|
| Change to Physical Space and Accessibility | State | Average Percentage of CCBHCs Across States % 2019 | |||||||
| Minnesota | Missouri | Nevada | New Jersey | New York | Oklahoma | Oregon | Pennsylvania | ||
| Expansions or additions to the CCBHC building space | 33% | 47% | 100% | 43% | 54% | 67% | 33% | 57% | 54% |
| Renovations to existing CCBHC facilities | 50% | 73% | 33% | 71% | 77% | 67% | 50% | 57% | 60% |
| Improvements to facility safety features | 50% | 53% | 33% | 57% | 69% | 67% | 33% | 43% | 51% |
| Other changes to CCBHCs' physical space | 17% | 27% | 0% | 29% | 15% | 33% | 17% | 43% | 23% |
| Offers translation services | 100% | 100% | 100% | 100% | 100% | 100% | 100% | 100% | 100% |
| Offers transportation or transportation vouchers | 100% | 100% | 100% | 86% | 85% | 100% | 100% | 57% | 91% |
| SOURCE: CCBHC Annual Progress Report Demonstration Year 2 data collected by Mathematica and the RAND Corporation, March 2019. NOTE: Cell values are calculated as a proportion of the total number of CCBHCs in each state: Minnesota = 6, Missouri = 15, Nevada = 3, New Jersey = 7, New York = 13, Oklahoma = 3, Oregon = 12, Pennsylvania = 7. |
|||||||||
| TABLE A.6. Telehealth and Remote Services | ||||||
|---|---|---|---|---|---|---|
| Telehealth and Remote Services | Offered Service as of March 2018 |
Offered Before CCBHC Certification, 2018 |
Offered Service as of March 2018 |
|||
| N | % | N | %a | N | % | |
| Offers services in locations outside of the clinicb | 62 | 93 | 53 | 85 | 64 | 97 |
| Consumers' homes | 52 | 84 | NA | NA | 50 | 78 |
| Schools | 34 | 55 | NA | NA | 30 | 47 |
| Courts, police offices, and other justice-related facilities | 28 | 45 | NA | NA | 21 | 33 |
| Hospitals and EDs | 20 | 32 | NA | NA | 19 | 30 |
| Community service agencies and non-profit organizations | 17 | 27 | NA | NA | 13 | 20 |
| Homeless shelters | 6 | 10 | NA | NA | 7 | 11 |
| Offers telehealth services | 45 | 67 | 36 | 80 | 46 | 70 |
| Total CCBHCs | 67 | 100 | 67 | 100 | 66 | 100 |
| SOURCE: CCBHC Annual Progress Report Demonstration Year 1 and Year 2 data collected by Mathematica and the RAND Corporation, March 2018 and March 2019. NOTES: The two 2018 columns are not mutually exclusive.
|
||||||
| TABLE A.7. CCBHCs that Offered Telehealth and Remote Services, by State, 2019 | |||||||||
|---|---|---|---|---|---|---|---|---|---|
| Telehealth and Remote Services | State | Average Percentage of CCBHCs Across States |
|||||||
| Minnesota | Missouri | Nevada | New Jersey | New York | Oklahoma | Oregon | Pennsylvania | ||
| Offers services in locations outside of the clinic | 100% | 100% | 100% | 71% | 100% | 100% | 100% | 100% | 96% |
| Offers telehealth services | 67% | 93% | 100% | 43% | 38% | 67% | 83% | 71% | 70% |
| SOURCE: CCBHC Annual Progress Report Demonstration Year 2 data collected by Mathematica and the RAND Corporation, March 2019. NOTE: Cell values are calculated as a proportion of the total number of CCBHCs in each state: Minnesota = 6, Missouri = 15, Nevada = 3, New Jersey = 7, New York = 13, Oklahoma = 3, Oregon = 12, Pennsylvania = 7. |
|||||||||
| TABLE A.8. CCBHC Outreach since the Start of the Demonstration (2018) or in the Past 12 Months (2019) | ||||
|---|---|---|---|---|
| Targeted Population | Yes Response, 2018 | Yes Response, 2019 | ||
| N | % | N | % | |
| Consumers experiencing homelessness | 43 | 64 | 57 | 86 |
| Members of the armed forces or veterans | 45 | 67 | 42 | 64 |
| Consumers who were previously incarcerated | 45 | 67 | 55 | 83 |
| School-age youth | 54 | 81 | 55 | 83 |
| Older adults | 33 | 49 | 33 | 50 |
| Other populations | 28 | 42 | 35 | 53 |
| None | 3 | 4 | 2 | 3 |
| Total CCBHCs | 67 | 100 | 66 | 100 |
| SOURCE: CCBHC Annual Progress Report Demonstration Year 1 and Year 2 data collected by Mathematica and the RAND Corporation, March 2018 and March 2019. | ||||
| TABLE A.9. CCBHC Outreach in the Past 12 Months, by State, 2019 | |||||||||
|---|---|---|---|---|---|---|---|---|---|
| Targeted Population | State | Average Percentage of CCBHCs Across States |
|||||||
| Minnesota | Missouri | Nevada | New Jersey | New York | Oklahoma | Oregon | Pennsylvania | ||
| Consumers experiencing homelessness | 100% | 80% | 100% | 100% | 77% | 100% | 83% | 86% | 91% |
| Members of the armed forces or veterans | 67% | 40% | 100% | 57% | 62% | 67% | 75% | 86% | 69% |
| Consumers who were previously incarcerated | 83% | 93% | 100% | 86% | 77% | 67% | 83% | 71% | 83% |
| School-age youth | 100% | 87% | 100% | 43% | 77% | 100% | 83% | 100% | 86% |
| Older adults | 17% | 47% | 100% | 14% | 62% | 33% | 58% | 71% | 50% |
| Other populations | 67% | 67% | 100% | 57% | 54% | 33% | 33% | 29% | 55% |
| None | 0% | 0% | 0% | 0% | 15% | 0% | 0% | 0% | 2% |
| SOURCE: CCBHC Annual Progress Report Demonstration Year 2 data collected by Mathematica and the RAND Corporation, March 2019. NOTES: Cell values are calculated as a proportion of the total number of CCBHCs in each state: Minnesota = 6, Missouri = 15, Nevada = 3, New Jersey = 7, New York = 13, Oklahoma = 3, Oregon = 12, Pennsylvania = 7. |
|||||||||
| TABLE A.10. AOT Order Referrals, by State, 2019 | |||||||||
|---|---|---|---|---|---|---|---|---|---|
| Referral Source | State | Average Percentage of CCBHCs Across States |
|||||||
| Minnesota | Missouri | Nevada | New Jersey | New York | Oklahoma | Oregon | Pennsylvania | ||
| Referred by courts or AOT order | 100% | 100% | 100% | 100% | 92% | 100% | 100% | 100% | 99% |
| SOURCE: CCBHC Annual Progress Report Demonstration Year 2 data collected by Mathematica and the RAND Corporation, March 2019. NOTE: Cell values are calculated as a proportion of the total number of CCBHCs in each state: Minnesota = 6, Missouri = 15, Nevada = 4, New Jersey = 7, New York = 13, Oklahoma = 3, Oregon = 12, Pennsylvania = 7. |
|||||||||
| TABLE A.11. Services Added as a Result of CCBHC Certification, 2018 | |||
|---|---|---|---|
| Service Type | Service Description | Added as a Result of CCBHC Certification |
|
| N | % | ||
| Crisis behavioral health services | 24-hour mobile crisis teams | 31 | 46 |
| Emergency crisis intervention | 21 | 31 | |
| Crisis stabilization | 21 | 31 | |
| Screening, assessment, and diagnosis | MH screening, assessment, diagnostic services | 9 | 13 |
| SUD screening, assessment, diagnostic services | 15 | 22 | |
| Person and family-centered treatment planning services | Person and family-centered treatment planning services | 12 | 18 |
| Outpatient MH and/or SUD services | ACTa | 4 | 6 |
| Forensic ACTa | 2 | 3 | |
| Individual CBTa | 3 | 4 | |
| Group CBTa | 4 | 6 | |
| Online CBTa | 0 | 0 | |
| DBTa | 5 | 7 | |
| First-episode/early intervention for psychosis | 9 | 13 | |
| Evidence-based medication evaluation and managementa | 5 | 7 | |
| MAT for alcohol and opioid usea | 31 | 46 | |
| Motivational interviewinga | 6 | 9 | |
| Multisystemic therapya | 5 | 7 | |
| Outpatient MH counseling | 4 | 6 | |
| Outpatient SUD treatment | 13 | 19 | |
| Specialty MH/SUD services for children and youth | 15 | 22 | |
| Therapeutic foster carea | 1 | 1 | |
| Community wraparound services for youth/childrena | 10 | 15 | |
| Psychiatric rehabilitation services | Community integration services | 16 | 24 |
| Financial management | 17 | 25 | |
| Illness management and recovery | 21 | 31 | |
| Medication education | 14 | 21 | |
| Psycho-education | 13 | 19 | |
| Self-management | 16 | 24 | |
| Skills training | 14 | 21 | |
| Supported housing | 8 | 12 | |
| Supported employment | 18 | 27 | |
| Supported education | 11 | 16 | |
| Wellness education services (diet, nutrition, exercise, tobacco cessation, etc.) | 24 | 36 | |
| Peer support services | Peer support services for consumers/clients | 29 | 43 |
| Peer support services for families | 23 | 34 | |
| TCM | TCM | 27 | 40 |
| Primary care screening and monitoring | Primary care screening and monitoring | 28 | 42 |
| Intensive community-based MH services for armed forces and veterans | Intensive community-based MH services for armed forces and veterans | 30 | 45 |
| SOURCE: CCBHC Annual Progress Report Demonstration Year 1 data collected by Mathematica and the RAND Corporation, March 2018. NOTES: The denominator is 67 CCBHCs.
|
|||
| TABLE A.12. CCBHCs and DCOs Provided Required Services | ||||||||||||
|---|---|---|---|---|---|---|---|---|---|---|---|---|
| Service Type | CCBHC, 2018 |
CCBHC, 2019 |
DCO, 2018 |
DCO, 2018 |
Either CCBHC or DCO, 2018 |
Either CCBHC or DCO, 2019 |
||||||
| N | % | N | % | N | % | N | % | N | % | N | % | |
| Crisis behavioral health services | ||||||||||||
| 24-hour mobile crisis teams | 49 | 73 | 53 | 80 | 23 | 34 | 19 | 29 | 65 | 97 | 65 | 98 |
| Emergency crisis intervention | 59 | 88 | 63 | 95 | 20 | 30 | 21 | 32 | 67 | 100 | 66 | 100 |
| Crisis stabilization | 60 | 90 | 59 | 89 | 14 | 21 | 18 | 27 | 66 | 99 | 64 | 97 |
| Screening, assessment, and diagnosis | ||||||||||||
| MH screening, assessment, diagnostic services | 67 | 100 | 65 | 98 | 4 | 6 | 7 | 11 | 67 | 100 | 65 | 98 |
| SUD screening, assessment, diagnostic services | 67 | 100 | 65 | 98 | 3 | 4 | 4 | 6 | 67 | 100 | 65 | 98 |
| Person and family-centered treatment planning services | 66 | 99 | 66 | 100 | 5 | 7 | 7 | 11 | 66 | 99 | 66 | 100 |
| Outpatient MH and/or SUD services | ||||||||||||
| Outpatient MH counseling | 67 | 100 | 66 | 100 | 0 | 0 | 4 | 6 | 67 | 100 | 66 | 100 |
| Outpatient SUD treatment | 67 | 100 | 66 | 100 | 0 | 0 | 2 | 3 | 67 | 100 | 66 | 100 |
| Motivational interviewinga | 67 | 100 | 66 | 100 | 2 | 3 | 4 | 6 | 67 | 100 | 66 | 100 |
| Individual CBTa | 67 | 100 | 66 | 100 | 0 | 0 | 3 | 5 | 67 | 100 | 66 | 100 |
| Group CBTa | 56 | 84 | 58 | 88 | 0 | 0 | 3 | 5 | 56 | 84 | 58 | 88 |
| Online CBTa | 7 | 10 | 9 | 14 | 0 | 0 | 0 | 0 | 7 | 10 | 9 | 14 |
| DBTa | 49 | 73 | 49 | 74 | 0 | 0 | 1 | 2 | 49 | 73 | 50 | 76 |
| First-episode/early intervention for psychosis | 40 | 60 | 37 | 56 | 0 | 0 | 4 | 6 | 40 | 60 | 38 | 58 |
| Multisystemic therapya | 27 | 40 | 36 | 55 | 0 | 0 | 2 | 3 | 27 | 40 | 37 | 56 |
| ACTa | 30 | 45 | 33 | 50 | 1 | 1 | 1 | 2 | 31 | 46 | 34 | 52 |
| Forensic ACTa | 6 | 9 | 10 | 15 | 0 | 0 | 1 | 2 | 6 | 9 | 11 | 17 |
| Evidence-based medication evaluation and managementa | 58 | 87 | 62 | 94 | 0 | 0 | 2 | 3 | 58 | 87 | 62 | 94 |
| MAT for alcohol and opioid usea | 55 | 82 | 61 | 92 | 2 | 3 | 1 | 2 | 56 | 84 | 61 | 92 |
| Therapeutic foster carea | 4 | 6 | 5 | 8 | 1 | 1 | 0 | 0 | 5 | 7 | 5 | 8 |
| Community wraparound services for youth/childrena | 50 | 75 | 49 | 74 | 2 | 3 | 2 | 3 | 51 | 76 | 51 | 77 |
| Specialty MH/SUD services for children and youth | 58 | 87 | 56 | 85 | 0 | 0 | 3 | 5 | 58 | 87 | 56 | 85 |
| Psychiatric rehabilitation services | ||||||||||||
| Medication education | 65 | 97 | 64 | 97 | 3 | 4 | 6 | 9 | 66 | 99 | 65 | 98 |
| Self-management | 63 | 94 | 64 | 97 | 5 | 7 | 6 | 9 | 65 | 97 | 65 | 98 |
| Skills training | 64 | 96 | 64 | 97 | 5 | 7 | 6 | 9 | 66 | 99 | 65 | 98 |
| Psycho-education | 64 | 96 | 65 | 98 | 5 | 7 | 5 | 8 | 66 | 99 | 66 | 100 |
| Community integration services | 61 | 91 | 62 | 94 | 4 | 6 | 6 | 9 | 64 | 96 | 63 | 95 |
| Illness management and recovery | 62 | 93 | 61 | 92 | 4 | 6 | 6 | 9 | 65 | 97 | 62 | 94 |
| Financial management | 61 | 91 | 58 | 88 | 5 | 7 | 4 | 6 | 64 | 96 | 59 | 89 |
| Wellness education services (diet, nutrition, exercise, tobacco cessation, etc.) | 65 | 97 | 64 | 97 | 6 | 9 | 5 | 8 | 67 | 100 | 65 | 98 |
| Supported housing | 43 | 64 | 50 | 76 | 5 | 7 | 6 | 9 | 47 | 70 | 52 | 79 |
| Supported employment | 45 | 67 | 49 | 74 | 5 | 7 | 8 | 12 | 50 | 75 | 54 | 82 |
| Supported education | 33 | 49 | 41 | 62 | 5 | 7 | 7 | 11 | 36 | 54 | 45 | 68 |
| Peer support services | ||||||||||||
| Peer support services for consumers/clients | 66 | 99 | 66 | 100 | 4 | 6 | 7 | 11 | 67 | 100 | 66 | 100 |
| Peer support services for families | 48 | 72 | 55 | 83 | 4 | 6 | 3 | 5 | 49 | 73 | 55 | 83 |
| TCM | 62 | 93 | 64 | 97 | 1 | 1 | 3 | 5 | 63 | 94 | 66 | 100 |
| Primary care screening and monitoring | 63 | 94 | 56 | 85 | 3 | 4 | 9 | 14 | 65 | 97 | 60 | 91 |
| Intensive community-based MH services for armed forces and veterans | 47 | 70 | 43 | 65 | 1 | 1 | 5 | 8 | 48 | 72 | 44 | 67 |
| Total CCBHCs | 67 | 100 | 66 | 100 | 67 | 100 | 66 | 100 | 67 | 100 | 66 | 100 |
| SOURCE: CCBHC Annual Progress Report Demonstration Year 1 and Year 2 data collected by Mathematica and the RAND Corporation, March 2018 and March 2019. NOTES: Columns are not mutually exclusive.
|
||||||||||||
| TABLE A.13. Percentage of CCBHCs that Provided Required Services Directly or Through DCOs, by State, 2019 | |||||||||
|---|---|---|---|---|---|---|---|---|---|
| Service Type | State | Average Percentage of CCBHCs Across States |
|||||||
| Minnesota | Missouri | Nevada | New Jersey | New York | Oklahoma | Oregon | Pennsylvania | ||
| Crisis behavioral health services | |||||||||
| 24-hour mobile crisis teams | 100% | 100% | 100% | 100% | 100% | 100% | 100% | 86% | 98% |
| Emergency crisis intervention | 100% | 100% | 100% | 100% | 100% | 100% | 100% | 100% | 100% |
| Crisis stabilization | 100% | 93% | 100% | 100% | 100% | 100% | 92% | 100% | 98% |
| Screening, assessment, and diagnosis | |||||||||
| MH screening, assessment, diagnostic services | 100% | 100% | 67% | 100% | 100% | 100% | 100% | 100% | 96% |
| SUD screening, assessment, diagnostic services | 100% | 100% | 67% | 100% | 100% | 100% | 100% | 100% | 96% |
| Person and family-centered treatment planning services | 100% | 100% | 100% | 100% | 100% | 100% | 100% | 100% | 100% |
| Outpatient MH and/or SUD services | |||||||||
| Outpatient MH counseling | 100% | 100% | 100% | 100% | 100% | 100% | 100% | 100% | 100% |
| Outpatient SUD treatment | 100% | 100% | 100% | 100% | 100% | 100% | 100% | 100% | 100% |
| Motivational interviewinga | 100% | 100% | 100% | 100% | 100% | 100% | 100% | 100% | 100% |
| Individual CBTa | 100% | 100% | 100% | 100% | 100% | 100% | 100% | 100% | 100% |
| Group CBTa | 67% | 87% | 100% | 100% | 100% | 100% | 83% | 71% | 89% |
| Online CBTa | 0% | 20% | 67% | 0% | 8% | 33% | 17% | 0% | 18% |
| DBTa | 50% | 73% | 67% | 43% | 85% | 67% | 92% | 100% | 72% |
| First-episode/early intervention for psychosis | 50% | 40% | 100% | 57% | 54% | 67% | 83% | 43% | 62% |
| Multisystemic therapya | 67% | 53% | 100% | 43% | 54% | 67% | 75% | 14% | 59% |
| ACTa | 50% | 40% | 100 | 43% | 31% | 67% | 92% | 29% | 56% |
| Forensic ACTa | 0% | 13% | 67% | 14% | 23% | 0% | 25% | 0% | 18% |
| Evidence-based medication evaluation and managementa | 83% | 100% | 100% | 86% | 92% | 100% | 100% | 86% | 93% |
| MAT for alcohol and opioid usea | 83% | 100% | 100% | 100% | 100% | 100% | 67% | 100% | 94% |
| Therapeutic foster carea | 0% | 0% | 0% | 14% | 15% | 0% | 17% | 0% | 6% |
| Community wraparound services for youth/childrena | 83% | 87% | 100% | 71% | 62% | 100% | 92% | 43% | 80% |
| Specialty MH/SUD services for children and youth | 100% | 87% | 100% | 43% | 92% | 100% | 92% | 71% | 86% |
| Psychiatric rehabilitation services | |||||||||
| Medication education | 100% | 100% | 100% | 100% | 100% | 100% | 100% | 86% | 98% |
| Self-management | 83% | 100% | 100% | 100% | 100% | 100% | 100% | 100% | 98% |
| Skills training | 100% | 100% | 100% | 86% | 100% | 100% | 100% | 100% | 98% |
| Psycho-education | 100% | 100% | 100% | 100% | 100% | 100% | 100% | 100% | 100% |
| Community integration services | 100% | 93% | 100% | 86% | 100% | 100% | 92% | 100% | 96% |
| Illness management and recovery | 83% | 100% | 100% | 100% | 92% | 33% | 100% | 100% | 89% |
| Financial management | 83% | 100% | 100% | 86% | 85% | 100% | 83% | 86% | 90% |
| Wellness education services (diet, nutrition, exercise, tobacco cessation, etc.) | 83% | 100% | 100% | 100% | 100% | 100% | 100% | 100% | 98% |
| Supported housing | 83% | 93% | 100% | 86% | 77% | 33% | 75% | 57% | 76% |
| Supported employment | 50% | 87% | 67% | 86% | 85% | 67% | 92% | 86% | 77% |
| Supported education | 67% | 53% | 100% | 71% | 85% | 67% | 58% | 71% | 72% |
| Peer support services | |||||||||
| Peer support services for consumers/clients | 100% | 100% | 100% | 100% | 100% | 100% | 100% | 100% | 100% |
| Peer support services for families | 33% | 100% | 100% | 71% | 100% | 100% | 92% | 43% | 80% |
| TCM | 100% | 100% | 100% | 100% | 100% | 100% | 100% | 100% | 100% |
| Primary care screening and monitoring | 83% | 80% | 100% | 100% | 100% | 100% | 100% | 71% | 92% |
| Intensive community-based MH services for armed forces and veterans | 67% | 47% | 100% | 57% | 100% | 33% | 67% | 57% | 66% |
| SOURCE: CCBHC Annual Progress Report Demonstration Year 2 data collected by Mathematica and the RAND Corporation, March 2019. NOTES: This table shows the percentage of CCBHCs, by state, that provided services either through CCBHCs directly or through DCO arrangements. The table corresponds with the column "either CCBHC and/or DCO provided service" from Appendix Table A.12. Cell values are calculated as a proportion of the total number of CCBHCs in each state: Minnesota = 6, Missouri = 15, Nevada = 3, New Jersey = 7, New York = 13, Oklahoma = 3, Oregon = 12, Pennsylvania = 7.
|
|||||||||
| TABLE A.14. Availability of On-Site Primary Care at CCBHCs | ||||
|---|---|---|---|---|
| Primary Care Services | Yes Response, 2018 | Yes Response, 2019 | ||
| N | % | N | % | |
| Provided on-site primary care services (in addition to primary care screening and monitoring) | 37 | 55 | 36 | 55 |
| Provided on-site primary care services (in addition to primary care screening and monitoring) before CCBHC certification | 31 | 84a | NAb | NAb |
| On-site primary care services were new due to CCBHC certification | 6 | 16a | NAb | NAb |
| CCBHC was also an FQHC | 5 | 8 | 4 | 6 |
| Total CCBHCs | 67 | 100 | 66 | 100 |
| SOURCE: CCBHC Annual Progress Report Demonstration Year 1 and Year 2 data collected by Mathematica and the RAND Corporation, March 2018 and March 2019. NOTES:
|
||||
| TABLE A.15. Availability of On-Site Primary Care at CCBHCs, by State, 2019 | |||||||||
|---|---|---|---|---|---|---|---|---|---|
| Primary Care Service | State | Average Percentage of CCBHCs Across States |
|||||||
| Minnesota | Missouri | Nevada | New Jersey | New York | Oklahoma | Oregon | Pennsylvania | ||
| Provides on-site primary care services | 33% | 60% | 100% | 57% | 15% | 67% | 100% | 29% | 58% |
| Also an FQHC | 0% | 27% | 0% | 0% | 0% | 0% | 0% | 0% | 3% |
| SOURCE: CCBHC Annual Progress Report Demonstration Year 2 data collected by Mathematica and the RAND Corporation, March 2019. NOTE: Cell values are calculated as a proportion of the total number of CCBHCs in each state: Minnesota = 6, Missouri = 15, Nevada = 3, New Jersey = 7, New York = 13, Oklahoma = 3, Oregon = 12, Pennsylvania = 7. |
|||||||||
| TABLE A.16. Strategies Used by CCBHCs to Facilitate Crisis Planning, by State, 2019 | |||||||||
|---|---|---|---|---|---|---|---|---|---|
| Strategy | State | Average Percentage of CCBHCs Across States |
|||||||
| Minnesota | Missouri | Nevada | New Jersey | New York | Oklahoma | Oregon | Pennsylvania | ||
| Wellness recovery action plan | 83% | 53% | 100% | 86% | 69% | 67% | 75% | 100% | 79% |
| Psychiatric advance directives | 50% | 47% | 100% | 100% | 62% | 100% | 92% | 100% | 81% |
| Develop a safety/crisis plan | 33% | 67% | 0% | 29% | 31% | 100% | 25% | 43% | 41% |
| Other | 50% | 87% | 33% | 86% | 54% | 100% | 42% | 57% | 64% |
| SOURCE: CCBHC Annual Progress Report Demonstration Year 2 data collected by Mathematica and the RAND Corporation, March 2019. NOTE: Cell values are calculated as a proportion of the total number of CCBHCs in each state: Minnesota = 6, Missouri = 15, Nevada = 3, New Jersey = 7, New York = 13, Oklahoma = 3, Oregon = 12, Pennsylvania = 7. |
|||||||||
| TABLE A.17. Types of Providers that Participate on CCBHC Treatment Teams, by State, 2019 | |||||||||
|---|---|---|---|---|---|---|---|---|---|
| Type of Provider | State | Average Percentage of CCBHCs Across States |
|||||||
| Minnesota | Missouri | Nevada | New Jersey | New York | Oklahoma | Oregon | Pennsylvania | ||
| MH clinicians | 100% | 100% | 100% | 100% | 100% | 100% | 100% | 100% | 100% |
| Case managers | 100% | 93% | 100% | 67% | 100% | 100% | 100% | 100% | 95% |
| SUD treatment providers | 100% | 93% | 100% | 100% | 100% | 100% | 92% | 100% | 98% |
| Psychiatrists | 83% | 87% | 100% | 67% | 92% | 100% | 92% | 100% | 90% |
| Consumers/clients | 100% | 93% | 57% | 100% | 77% | 100% | 75% | 86% | 86% |
| Community support and social service providers | 83% | 93% | 86% | 67% | 54% | 67% | 75% | 86% | 76% |
| Consumer/client family members | 100% | 80% | 57% | 100% | 77% | 100% | 58% | 86% | 82% |
| Primary care physicians | 33% | 47% | 57% | 100% | 15% | 33% | 83% | 43% | 52% |
| Other | 83% | 73% | 71% | 67% | 46% | 67% | 33% | 14% | 57% |
| SOURCES: CCBHC Annual Progress Report Demonstration Year 2 data collected by Mathematica and the RAND Corporation, March 2019. NOTE: Cell values are calculated as a proportion of the total number of CCBHCs in each state: Minnesota = 6, Missouri = 15, Nevada = 3, New Jersey = 7, New York = 13, Oklahoma = 3, Oregon = 12, Pennsylvania = 7. |
|||||||||
| TABLE A.18. CCBHC Notification about Consumers' Care Transitions for Physical and Behavioral Health Conditions | ||||||||
|---|---|---|---|---|---|---|---|---|
| Notification about Care Transition | Behavioral Health Condition, 2018 |
Behavioral Health Condition, 2019 |
Physical Health Condition, 2018 |
Physical Health Condition, 2019 |
||||
| N | % | N | % | N | % | N | % | |
| Receives notification when hospital treats a client for: | 59 | 88 | 47 | 71 | 38 | 57 | 38 | 58 |
| Receives discharge summary from hospital after a client is treated for: | 58 | 87 | 58 | 88 | 25 | 37 | 35 | 53 |
| Receives notification when ED treats a client for: | 48 | 72 | 44 | 67 | 34 | 51 | 35 | 53 |
| Receives discharge summary from ED after a client is treated for: | 41 | 61 | 42 | 64 | 22 | 33 | 22 | 33 |
| Receives notification by other means (for example, contacts by consumers or families) about: | 60 | 90 | 64 | 97 | 53 | 79 | 60 | 91 |
| Total CCBHCs | 67 | 100 | 66 | 100 | 67 | 100 | 66 | 100 |
| SOURCE: CCBHC Annual Progress Report Demonstration Year 1 and Year 2 data collected by Mathematica and the RAND Corporation, March 2018 and March 2019. | ||||||||
| TABLE A.19. CCBHC Notification about Consumers' Care Transitions for Behavioral Health Conditions, by State, 2019 | |||||||||
|---|---|---|---|---|---|---|---|---|---|
| Notification about Care Transition | State | Average Percentage of CCBHCs Across States |
|||||||
| Minnesota | Missouri | Nevada | New Jersey | New York | Oklahoma | Oregon | Pennsylvania | ||
| Receives notification when hospital treats a client for a behavioral health condition: | 17% | 93% | 0% | 86% | 77% | 100% | 92% | 29% | 62% |
| Receives discharge summary from hospital after a client is treated for a behavioral health condition: | 33% | 93% | 67% | 86% | 100% | 100% | 92% | 100% | 84% |
| Receives notification when ED treats a client for a behavioral health condition: | 33% | 87% | 0% | 71% | 77% | 0% | 100% | 29% | 50% |
| Receives discharge summary from ED after a client is treated for a behavioral health condition: | 17% | 47% | 67% | 57% | 100% | 33% | 100% | 29% | 56% |
| Receives notification by other means (for example, contacts by consumers or families) about behavioral health care transitions: | 100% | 93% | 100% | 100% | 100% | 100% | 92% | 100% | 98% |
| SOURCE: CCBHC Annual Progress Report Demonstration Year 2 data collected by Mathematica and the RAND Corporation, March 2019. NOTE: Cell values are calculated as a proportion of the total number of CCBHCs in each state: Minnesota = 6, Missouri = 15, Nevada = 3, New Jersey = 7, New York = 13, Oklahoma = 3, Oregon = 12, Pennsylvania = 7. |
|||||||||
| TABLE A.20. CCBHC Notification about Consumers' Care Transitions for Physical Health Conditions, by State, 2019 | |||||||||
|---|---|---|---|---|---|---|---|---|---|
| Notification about Care Transition | State | Average Percentage of CCBHCs Across States |
|||||||
| Minnesota | Missouri | Nevada | New Jersey | New York | Oklahoma | Oregon | Pennsylvania | ||
| Receives notification when hospital treats a client for a physical health condition: | 17% | 80% | 0% | 57% | 69% | 0% | 92% | 14% | 41% |
| Receives discharge summary from hospital after a client is treated for a physical health condition: | 17% | 60% | 33% | 43% | 62% | 0% | 75% | 57% | 43% |
| Receives notification when ED treats a client for a physical health condition: | 0% | 80% | 0% | 57% | 69% | 0% | 83% | 0% | 36% |
| Receives discharge summary from ED after a client is treated for a physical health condition: | 0% | 27% | 33% | 29% | 46% | 0% | 75% | 0% | 26% |
| Receives notification by other means (for example, contacts by consumers or families) about physical health care transitions: | 83% | 93% | 67% | 100% | 100% | 100% | 75% | 100% | 90% |
| SOURCE: CCBHC Annual Progress Report Demonstration Year 2 data collected by Mathematica and the RAND Corporation, March 2019. NOTE: Cell values are calculated as a proportion of the total number of CCBHCs in each state: Minnesota = 6, Missouri = 15, Nevada = 3, New Jersey = 7, New York = 13, Oklahoma = 3, Oregon = 12, Pennsylvania = 7. |
|||||||||
| TABLE A.21. CCBHC DCO Relationships with Other Facilities and Providers, by State, 2019 | |||||||||
|---|---|---|---|---|---|---|---|---|---|
| Facility/Provider Typea | State | Average Percentage of CCBHCs Across States |
|||||||
| Minnesota | Missouri | Nevada | New Jersey | New York | Oklahoma | Oregon | Pennsylvania | ||
| FQHCs | 0% | 0% | 0% | 14% | 15% | 0% | 8% | 14% | 7% |
| Rural health clinics | 0% | 0% | 0% | 0% | 0% | 0% | 0% | 0% | 0% |
| Primary care providers | 0% | 0% | 33% | 14% | 8% | 0% | 0% | 0% | 7% |
| Inpatient psychiatric facilities | 0% | 0% | 0% | 0% | 0% | 0% | 0% | 0% | 0% |
| Psychiatric residential treatment facilities | 0% | 0% | 0% | 0% | 0% | 0% | 0% | 0% | 0% |
| SUD residential treatment facilities | 0% | 7% | 0% | 14% | 8% | 0% | 0% | 0% | 4% |
| Medical detoxification facilities | 0% | 7% | 0% | 0% | 8% | 0% | 0% | 0% | 2% |
| Ambulatory detoxification facilities | 0% | 7% | 0% | 0% | 8% | 0% | 0% | 0% | 2% |
| Post-detoxification step-down facilities | 0% | 13% | 0% | 0% | 8% | 0% | 0% | 0% | 3% |
| Residential (non-hospital) crisis settings | 0% | 7% | 0% | 0% | 8% | 0% | 0% | 0% | 2% |
| MAT providers for substance use | 17% | 0% | 33% | 0% | 15% | 0% | 0% | 29% | 12% |
| Schools | 17% | 0% | 0% | 0% | 8% | 0% | 0% | 0% | 3% |
| School-based health centers | 17% | 0% | 0% | 0% | 0% | 0% | 0% | 0% | 2% |
| Child welfare agencies | 0% | 0% | 0% | 0% | 0% | 0% | 0% | 0% | 0% |
| Therapeutic foster care service agencies | 0% | 0% | 0% | 0% | 0% | 0% | 0% | 0% | 0% |
| Juvenile justice agencies | 0% | 0% | 0% | 0% | 0% | 0% | 0% | 0% | 0% |
| Adult criminal justice agencies/courts | 0% | 7% | 0% | 0% | 8% | 0% | 0% | 0% | 2% |
| MH/drug courts | 0% | 7% | 0% | 0% | 8% | 0% | 0% | 0% | 2% |
| Law enforcement | 0% | 0% | 0% | 0% | 0% | 0% | 0% | 0% | 0% |
| Indian Health Service or other tribal programs | 0% | 0% | 0% | 0% | 0% | 0% | 0% | 0% | 0% |
| Indian Health Service youth regional treatment centers | 0% | 0% | 0% | 0% | 0% | 0% | 0% | 0% | 0% |
| Homeless shelters | 0% | 0% | 0% | 0% | 8% | 0% | 0% | 0% | 1% |
| Housing agencies | 0% | 0% | 0% | 0% | 8% | 0% | 0% | 0% | 1% |
| Suicide/crisis hotlines and warmlines | 0% | 73% | 0% | 14% | 31% | 0% | 0% | 57% | 22% |
| Employment services and/or supported employment | 0% | 7% | 0% | 14% | 15% | 0% | 0% | 14% | 6% |
| Older adult services | 0% | 0% | 0% | 0% | 0% | 0% | 0% | 14% | 2% |
| Other social and human service providers | 0% | 7% | 0% | 0% | 8% | 0% | 8% | 14% | 5% |
| Consumer-operated/peer service provider organizations | 0% | 0% | 0% | 29% | 8% | 0% | 8% | 0% | 6% |
| VA treatment facilities | 0% | 0% | 0% | 14% | 0% | 0% | 0% | 0% | 2% |
| Urgent care centers | 0% | 0% | 0% | 14% | 0% | 0% | 0% | 0% | 2% |
| EDs | 0% | 0% | 0% | 57% | 0% | 0% | 0% | 0% | 7% |
| Hospital outpatient clinics | 0% | 0% | 0% | 0% | 0% | 0% | 0% | 0% | 0% |
| SOURCE: CCBHC Annual Progress Report Demonstration Year 2 data collected by Mathematica and the RAND Corporation, March 2019. NOTE: Cell values are calculated as a proportion of the total number of CCBHCs in each state: Minnesota = 6, Missouri = 15, Nevada = 3, New Jersey = 7, New York = 13, Oklahoma = 3, Oregon = 12, Pennsylvania = 7.
|
|||||||||
| TABLE A.22. CCBHC Non-DCO (either formal and informal) Relationships with Other Facilities and Providers, by State, 2019 | |||||||||
|---|---|---|---|---|---|---|---|---|---|
| Facility/Provider Typea | State | Average Percentage of CCBHCs Across States |
|||||||
| Minnesota | Missouri | Nevada | New Jersey | New York | Oklahoma | Oregon | Pennsylvania | ||
| FQHCs | 50% | 93% | 100% | 71% | 77% | 100% | 75% | 86% | 82% |
| Rural health clinics | 33% | 53% | 100% | 14% | 54% | 100% | 50% | 43% | 56% |
| Primary care providers | 100% | 93% | 67% | 100% | 92% | 100% | 100% | 86% | 92% |
| Inpatient psychiatric facilities | 100% | 100% | 100% | 100% | 92% | 100% | 100% | 100% | 99% |
| Psychiatric residential treatment facilities | 100% | 87% | 100% | 100% | 85% | 100% | 100% | 100% | 96% |
| SUD residential treatment facilities | 100% | 80% | 100% | 100% | 92% | 100% | 92% | 100% | 95% |
| Medical detoxification facilities | 50% | 93% | 100% | 86% | 92% | 100% | 100% | 100% | 90% |
| Ambulatory detoxification facilities | 33% | 80% | 67% | 86% | 85% | 100% | 100% | 100% | 81% |
| Post-detoxification step-down facilities | 50% | 67% | 67% | 100% | 85% | 67% | 100% | 71% | 76% |
| Residential (non-hospital) crisis settings | 50% | 60% | 100% | 71% | 85% | 100% | 92% | 86% | 80% |
| MAT providers for substance use | 83% | 87% | 67% | 100% | 77% | 100% | 100% | 86% | 87% |
| Schools | 83% | 100% | 100% | 86% | 85% | 100% | 100% | 100% | 94% |
| School-based health centers | 33% | 60% | 67% | 43% | 46% | 33% | 83% | 71% | 55% |
| Child welfare agencies | 83% | 100% | 100% | 100% | 92% | 100% | 100% | 100% | 97% |
| Therapeutic foster care service agencies | 67% | 87% | 100% | 57% | 85% | 67% | 100% | 86% | 81% |
| Juvenile justice agencies | 83% | 100% | 100% | 71% | 85% | 100% | 100% | 100% | 92% |
| Adult criminal justice agencies/courts | 67% | 93% | 100% | 100% | 92% | 100% | 100% | 100% | 94% |
| MH/drug courts | 67% | 93% | 100% | 100% | 92% | 100% | 100% | 100% | 94% |
| Law enforcement | 100% | 100% | 100% | 100% | 92% | 100% | 100% | 86% | 97% |
| Indian Health Service or other tribal programs | 50% | 13% | 100% | 0% | 46% | 67% | 67% | 0% | 43% |
| Indian Health Service youth regional treatment centers | 17% | 7% | 100% | 0% | 38% | 33% | 25% | 0% | 28% |
| Homeless shelters | 67% | 87% | 100% | 100% | 92% | 100% | 75% | 100% | 90% |
| Housing agencies | 100% | 93% | 100% | 100% | 92% | 100% | 100% | 86% | 96% |
| Suicide/crisis hotlines and warmlines | 67% | 27% | 100% | 86% | 62% | 100% | 100% | 43% | 73% |
| Employment services and/or supported employment | 83% | 87% | 100% | 86% | 77% | 100% | 100% | 71% | 88% |
| Older adult services | 83% | 93% | 100% | 86% | 85% | 67% | 100% | 71% | 86% |
| Other social and human service providers | 100% | 87% | 100% | 100% | 100% | 100% | 100% | 86% | 97% |
| Consumer-operated/peer service provider organizations | 50% | 80% | 100% | 86% | 85% | 100% | 100% | 86% | 86% |
| VA treatment facilities | 100% | 80% | 100% | 71% | 85% | 100% | 100% | 100% | 92% |
| Urgent care centers | 67% | 87% | 100% | 71% | 77% | 67% | 67% | 71% | 76% |
| EDs | 100% | 100% | 100% | 71% | 92% | 100% | 100% | 100% | 95% |
| Hospital outpatient clinics | 83% | 87% | 100% | 86% | 92% | 100% | 100% | 86% | 92% |
| SOURCE: CCBHC Annual Progress Report Demonstration Year 2 data collected by Mathematica and the RAND Corporation, March 2019. NOTES: Cell values are calculated as a proportion of the total number of CCBHCs in each state: Minnesota = 6, Missouri = 15, Nevada = 3, New Jersey = 7, New York = 13, Oklahoma = 3, Oregon = 12, Pennsylvania = 7.
|
|||||||||
| TABLE A.23. Functions of CCBHC EHR and HIT Systems, by State, 2019 | |||||||||
|---|---|---|---|---|---|---|---|---|---|
| Function | State | Average Percentage of CCBHCs Across States |
|||||||
| Minnesota | Missouri | Nevada | New Jersey | New York | Oklahoma | Oregon | Pennsylvania | ||
| EHR contains MH records | 100% | 100% | 100% | 100% | 100% | 100% | 100% | 100% | 100% |
| EHR contains SUD records | 100% | 100% | 100% | 100% | 100% | 100% | 100% | 100% | 100% |
| EHR contains case management or care coordination records | 100% | 100% | 100% | 100% | 100% | 100% | 100% | 100% | 100% |
| EHR has quality measure reporting capabilities | 83% | 93% | 100% | 100% | 85% | 100% | 92% | 100% | 94% |
| EHR generates electronic care plan | 83% | 80% | 100% | 86% | 100% | 100% | 100% | 100% | 94% |
| Any form of electronic prescribing used | 83% | 100% | 100% | 86% | 100% | 100% | 92% | 100% | 95% |
| EHR incorporates laboratory results into health record | 67% | 87% | 67% | 71% | 62% | 100% | 92% | 100% | 81% |
| EHR provides clinical decision support | 50% | 87% | 100% | 71% | 85% | 67% | 92% | 86% | 80% |
| EHR contains primary care records | 17% | 47% | 100% | 57% | 62% | 67% | 75% | 43% | 58% |
| EHR communicates with laboratory to request tests or receive results | 33% | 53% | 33% | 71% | 46% | 100% | 67% | 71% | 59% |
| EHR allows electronic exchange of clinical information with other external providers | 33% | 40% | 33% | 43% | 46% | 67% | 58% | 43% | 45% |
| EHR allows electronic exchange of clinical information with DCOs | 17% | 20% | 33% | 43% | 31% | 33% | 33% | 43% | 32% |
| SOURCES: CCBHC Annual Progress Report Demonstration Year 2 data collected by Mathematica and the RAND Corporation, March 2019. NOTE: Cell values are calculated as a proportion of the total number of CCBHCs in each state: Minnesota = 6, Missouri = 15, Nevada = 3, New Jersey = 7, New York = 13, Oklahoma = 3, Oregon = 12, Pennsylvania = 7 |
|||||||||
APPENDIX B: CCBHC Demonstration Evaluation 2018 and 2019 Progress Report Templates
According to the Paperwork Reduction Act of 1995, no persons are required to respond to a collection of information unless it displays a valid OMB control number. The valid OMB control number for this information collection is 0990-0461. The time required to complete this information collection is estimated to average 1 hour per response, including the time to review instructions, search existing data resources, gather the data needed, and complete and review the information collection. If you have comments concerning the accuracy of the time estimate(s) or suggestions for improving this form, please write to: U.S. Department of Health & Human Services, OS/OCIO/PRA, 200 Independence Ave., S.W., Suite 336-E, Washington, D.C. 20201. Attention: PRA Reports Clearance Officer.
Certified Community Behavioral Health Clinic Demonstration Annual Clinic Progress Report Demonstration Year 1
Please see the PDF version for this template.
Certified Community Behavioral Health Clinic Demonstration Evaluation Annual Progress Report: Demonstration Year 2
Please see the PDF version for this template.
APPENDIX C: CCBHC Demonstration Evaluation State Official and Consumer/Family Representative Group Interview Guides
According to the Paperwork Reduction Act of 1995, no persons are required to respond to a collection of information unless it displays a valid OMB control number. The valid OMB control number for this information collection is 0990-0461. The time required to complete this information collection is estimated to average 1 hour per response, including the time to review instructions, search existing data resources, gather the data needed, and complete and review the information collection. If you have comments concerning the accuracy of the time estimate(s) or suggestions for improving this form, please write to: U.S. Department of Health & Human Services, OS/OCIO/PRA, 200 Independence Ave., S.W., Suite 336-E, Washington, D.C. 20201. Attention: PRA Reports Clearance Officer.
Baseline Telephone Interview Protocol State Medicaid Officials
Please see the PDF version for this template.
Baseline Telephone Interview Protocol State Behavioral Health Officials
Please see the PDF version for this template.
Demonstration Midpoint Telephone Interview Protocol State Medicaid Officials
Please see the PDF version for this template.
Demonstration Midpoint Telephone Interview Protocol State Behavioral Health Officials
Please see the PDF version for this template.
Demonstration End Telephone Interview Protocol State Officials
Please see the PDF version for this template.
Demonstration End Telephone Interview Protocol Consumer and Family Representative Groups
Please see the PDF version for this template.
APPENDIX D: CCBHC Demonstration Evaluation Site Visit Interview Guides
According to the Paperwork Reduction Act of 1995, no persons are required to respond to a collection of information unless it displays a valid OMB control number. The valid OMB control number for this information collection is 0990-0461. The time required to complete this information collection is estimated to average 1 hour per response, including the time to review instructions, search existing data resources, gather the data needed, and complete and review the information collection. If you have comments concerning the accuracy of the time estimate(s) or suggestions for improving this form, please write to: U.S. Department of Health & Human Services, OS/OCIO/PRA, 200 Independence Ave., S.W., Suite 336-E, Washington, D.C. 20201. Attention: PRA Reports Clearance Officer.
CCHBC Demonstration Evaluation Site Visit Interview Guide: CCBHC Leadership
Please see the PDF version for this template.
CCHBC Demonstration Evaluation Site Visit Interview Guide: CCBHC Providers
Please see the PDF version for this template.
CCHBC Demonstration Evaluation Site Visit Interview Guide: CCBHC Care Managers
Please see the PDF version for this template.
CCHBC Demonstration Evaluation Site Visit Interview Guide: CCBHC Administration and Finance
Please see the PDF version for this template.
NOTES
-
HHS Substance Abuse and Mental Health Services Administration (SAMHSA). "Criteria for the Demonstration Program to Improve Community Mental Health Centers and to Establish Certified Community Behavioral Health Clinics." Rockville, MD: SAMHSA, 2016.
-
The nine types of services are: (1) crisis mental health services, including 24-hour mobile crisis teams, emergency crisis intervention services, and crisis stabilization; (2) screening, assessment, and diagnosis, including risk assessment; (3) patient-centered treatment planning or similar processes, including risk assessment and crisis planning; (4) outpatient mental health and substance use services; (5) outpatient clinic primary care screening and monitoring of key health indicators and health risk; (6) targeted case management; (7) psychiatric rehabilitation services; (8) peer support and counselor services and family supports; and (9) intensive, community-based mental health care for members of the armed forces and veterans. CCBHCs must provide the first four services directly; the other service types may be provided by a DCO. In addition, crisis behavioral health services may be provided by a DCO if the DCO is an existing state-sanctioned, certified, or licensed system or network. DCOs may also provide ambulatory and medical detoxification in American Society of Addiction Medicine categories 3.2-WM and 3.7-WM.
-
Nevada initially certified four clinics; however, one is no longer participating in the demonstration. In March 2018, that CCBHC withdrew from the demonstration after Nevada revoked its certification.
-
CCBHCs submit cost reports within nine months following each demonstration year. CMS provided CCBHCs with a cost-reporting template. This report does not contain findings based on data from these cost reports, but, where noted, some of the definitions and terminology used in this report align with definitions and terms from the CMS cost-reporting template.
-
HHS Substance Abuse and Mental Health Services Administration (SAMHSA). "Criteria for the Demonstration Program to Improve Community Mental Health Centers and to Establish Certified Community Behavioral Health Clinics." Rockville, MD: SAMHSA, 2016.
-
The nine types of services are: (1) crisis mental health services, including 24-hour mobile crisis teams, emergency crisis intervention services, and crisis stabilization; (2) screening, assessment, and diagnosis, including risk assessment; (3) patient-centered treatment planning or similar processes, including risk assessment and crisis planning; (4) outpatient mental health and substance use services; (5) outpatient clinic primary care screening and monitoring of key health indicators and health risk; (6) targeted case management (TCM); (7) psychiatric rehabilitation services; (8) peer support and counselor services and family supports; and (9) intensive, community-based mental health care for members of the armed forces and veterans. CCBHCs must provide the first four service types directly; a DCO may provide the other service types. In addition, crisis behavioral health services may be provided by a DCO if the DCO is an existing state-sanctioned, certified, or licensed system or network. DCOs may also provide ambulatory and medical detoxification in American Society of Addiction Medicine (ASAM) categories 3.2-WM and 3.7-WM.
-
CCBHCs submit cost reports within nine months following each demonstration year. CMS provided CCBHCs with a cost-reporting template. This report does not contain findings based on data from these cost reports, but, where noted, some of the definitions and terminology used in this report align with definitions and terms from the CMS cost-reporting template.
-
Nevada initially certified four clinics; however, one is no longer participating in the demonstration. In March 2018, shortly after we collected the first round of progress reports, this CCBHC withdrew from the demonstration after Nevada revoked its certification.
-
In one state, we conducted separate interviews for each group of state officials--one with behavioral health officials and one with Medicaid officials per the state's preference.
-
We selected these states based on their geographic diversity, use of different PPS options (i.e., PPS-1, PPS-1 with QBPs, and PPS-2), and because we are including these states in the evaluation's claims analysis.
-
In cases in which a CCBHC is unable to employ a psychiatrist as medical director (e.g., because of a documented behavioral health professional shortage in its vicinity), the criteria specify that "a medically trained behavioral health care provider with appropriate education and licensure with prescriptive authority in psychopharmacology who can prescribe and manage medications independently pursuant to state law" may serve as a CCBHC medical director.
-
HHS Substance Abuse and Mental Health Services Administration (SAMHSA). "Criteria for the Demonstration Program to Improve Community Mental Health Centers and to Establish Certified Community Behavioral Health Clinics." Rockville, MD: SAMHSA, 2016.
-
To align with the terminology included in the CCBHC cost-reporting template, the mental health professional category in the progress report included only those trained and credentialed for psychological testing.
-
The CCBHC PPS does not cover transportation services; rather, clinics may have worked to assist clients with obtaining and using the separate Medicaid transportation benefit if it was offered by the state and the client was eligible.
-
States are unable to bill Medicaid for incarcerated or justice involved individuals, and services delivered to incarcerated individuals were not approved under this demonstration. However, clinics may have elected to provide telehealth services to incarcerated individuals without billing Medicaid.
-
CCBHCs may engage DCOs to provide primary care screening and monitoring; TCM; psychiatric rehabilitation services; peer support services and family support services; and services for members of the armed services and veterans. In addition, a DCO may provide crisis behavioral health services if the DCO is an existing state-sanctioned, certified, or licensed system or network. DCOs may also provide ambulatory and medical detoxification in ASAM categories 3.2-WM and 3.7-WM.
-
Community mental health liaisons, who are employed by clinics (including CCBHCs), work closely with the criminal justice system (including courts, police) to help direct consumers into behavioral health care.
-
The ECHO model is a hub-and-spoke model that links expert specialist teams at a "hub" with providers and clinicians in local communities--the "spokes" of the model.
-
High acuity typically refers to consumers with acute (active) disorders that require substantial amounts of care.
-
This seemingly contradictory finding may reflect the fact that the questions in the progress reports about specific treatment team members capture information only at each time point rather than fluctuations in these specific team members over the past 12 months.
PROJECT AND REPORT INFORMATION
These reports were prepared under contract #HHSP233201600017I between HHS's ASPE/BHDAP and Mathematica Policy Research to conduct the national evaluation of the demonstration. For additional information about this subject, you can visit the BHDAP home page at https://aspe.hhs.gov/bhdap or contact the ASPE Project Officer, Judith Dey, at HHS/ASPE/BHDAP, Room 424E, H.H. Humphrey Building, 200 Independence Avenue, S.W., Washington, D.C. 20201. Her e-mail address is: Judith.Dey@hhs.gov.
Reports Available
Certified Community Behavioral Health Clinics Demonstration Program: Report to Congress, 2019
- HTML version: https://aspe.hhs.gov/basic-report/certified-community-behavioral-health-clinics-demonstration-program-report-congress-2019
- PDF version: https://aspe.hhs.gov/pdf-report/certified-community-behavioral-health-clinics-demonstration-program-report-congress-2019
Implementation Findings from the National Evaluation of the Certified Community Behavioral Health Clinic Demonstration
- HTML version: https://aspe.hhs.gov/report/implementation-findings-national-evaluation-certified-community-behavioral-health-clinic-demonstration
- PDF version: https://aspe.hhs.gov/pdf-report/implementation-findings-national-evaluation-certified-community-behavioral-health-clinic-demonstration
Preliminary Cost and Quality Findings from the National Evaluation of the Certified Community Behavioral Health Clinic Demonstration
- HTML version: https://aspe.hhs.gov/basic-report/preliminary-cost-and-quality-findings-national-evaluation-certified-community-behavioral-health-clinic-demonstration
- PDF version: https://aspe.hhs.gov/pdf-report/preliminary-cost-and-quality-findings-national-evaluation-certified-community-behavioral-health-clinic-demonstration