
Zhanlian Feng, PhD,Alison Vadnais, MHS, Emily Vreeland, BA, Susan Haber, PhD, Joshua Wiener, PhD, and Bob Baker, BA
RTI International
Printer Friendly Version in PDF Format (46 PDF pages)
ABSTRACT
There are multiple pathways to becoming dually eligible for Medicare and Medicaid. The purpose of this study is to identify the frequency with which these pathways are followed and the beneficiary characteristics and patterns of service use by pathway. We used the Medicare-Medicaid Linked Enrollee Analytic Data Source (MMLEADS) to identify individuals who became dually eligible for Medicare and full Medicaid benefits, during 2007-2010. We categorized these individuals by temporal pathway: (1) Medicare-to-Medicaid, (2) Medicaid-to-Medicare, and (3) simultaneous transition to full-dual status. We identified beneficiary reason for eligibility, demographic characteristics, and service use around the time of initial transition to full-dual status.
Reasons for Medicaid and Medicare eligibility, age, presence of chronic conditions, and service use at time of initial transition to full-dual status vary by pathway, suggesting that different subgroups of dually eligible beneficiaries may have different care needs. About one-quarter of duals experienced some eligibility gap in the 12 months following transition to full-dual status.
Transitioning from Medicare to full Medicaid coverage is likely related to the use of expensive uncovered medical care and LTSS. Medicaid pays for such services for many beneficiaries long before they become Medicare eligible. Understanding these differences can inform interventions to support the dual eligible population and individuals at risk of becoming duals. The finding that some do not maintain full-dual eligibility suggests that some duals may face gaps in care.
This report was prepared under contract #HHSP23320100021WI between the U.S. Department of Health and Human Services (HHS), Office of Disability, Aging and Long-Term Care Policy (DALTCP) and the Research Triangle Institute. For additional information about this subject, you can visit the DALTCP home page at http://aspe.hhs.gov/office-disability-aging-and-long-term-care-policy-daltcp or contact the ASPE Project Officer, Jhamirah Howard, at HHS/ASPE/DALTCP, Room 424E, H.H. Humphrey Building, 200 Independence Avenue, S.W., Washington, D.C. 20201; Jhamirah.Howard@hhs.gov.
DISCLAIMER: The opinions and views expressed in this report are those of the authors. They do not reflect the views of the Department of Health and Human Services, the contractor or any other funding organization. This report was completed and submitted on March 2017.
TABLE OF CONTENTS
1. INTRODUCTION
2. METHODS
2.1. Data Source
2.2. Study Population: New Dual Eligibles
2.3. Temporal Pathways to Full-Dual Status
2.4. Reason for Medicaid and Medicare Eligibility
2.5. Analytic Approach
3.1. Temporal Pathways to Full-Dual Eligibility
3.2. Retaining Full-Dual Eligibility
3.3. Medicaid and Medicare Eligibility Pathways to Full-Dual Status
3.4. Beneficiary Characteristics at the Time of Transition to Full-Dual Status
3.5. Medicaid/Medicare Utilization and Spending at the Time of Transition to Full-Dual Status3
.6. Medicaid Long-Term Services and Supports Utilization
3.7. Characteristics of Medicare-Only Beneficiaries Who Transitioned to Full-Dual Eligibility
4. SUMMARY
5. LIMITATIONS AND FUTURE RESEARCH
6. CONCLUSION
APPENDIX A. ADDITIONAL DATA
LIST OF FIGURES
- FIGURE 3-1: Reason for Medicaid Eligibility at Time of Transition to Full-Dual Status: All Individuals
- FIGURE 3-2: Current Reason for Medicare Eligibility at Time of Transition to Full-Dual Status: All Individuals
- FIGURE 3-3: Reason for Medicaid Eligibility at Time of Transition to Full-Dual Status, by Current Reason for Medicare Eligibility
- FIGURE 3-4: Mean Number of CCW Chronic Conditions, by Medicaid Eligibility Pathway
- FIGURE 3-5: Medicaid Utilization of Select Services in the First Month of Transition to Full-Dual Status, by Medicaid Eligibility Pathway
- FIGURE 3-6: Medicare Utilization of Select Services in the First Month of Transition to Full-Dual Status, by Medicaid Eligibility Pathway
- FIGURE A-1: Graphic Illustration of Temporal Pathways to Full-Dual Eligible Status
LIST OF TABLES
- TABLE 3-1: Frequencies and Percentages of New Full-Dual Beneficiaries, by Temporal Pathway
- TABLE 3-2: Medicaid and Medicare Reasons for Eligibility for New Full-Dual Beneficiaries at Time of Transition to Full-Dual Status, by Temporal Pathway
- TABLE 3-3: Select Characteristics of New Full-Dual Beneficiaries at Time of Transition to Full-Dual Status, by Temporal Pathway
- TABLE 3-4: Medicaid/Medicare Utilization and Spending for New Full-Dual Beneficiaries in the First Month of Transition to Full-Dual Status, by Temporal Pathway
- TABLE 3-5: Medicaid LTSS Use among Full-Dual Beneficiaries in the First Month of Transition to Full-Dual Status, by Temporal Pathway
- TABLE 3-6: Medicaid LTSS Use among Full-Dual Beneficiaries in the First Month of Transition to Full-Dual Status, by Medicaid Eligibility Pathway
- TABLE 3-7: Medicaid LTSS Use among Full-Dual Beneficiaries in the First Month of Transition to Full-Dual Status, by Age at Time of Transition
- TABLE 3-8: Medicaid LTSS Use among Full-Dual Beneficiaries in the First Month of Transition to Full-Dual Status, by Age and Temporal Pathway
- TABLE 3-9: Full-Dual Beneficiaries with a New Spell of Medicaid LTSS Use, by Age and Full-Dual Status at the Onset of LTSS Use
- TABLE 3-10: Percentage of New Medicare Beneficiaries in 2006 Who Transitioned to Full-Dual Status by 2010
- TABLE A-1: List of Select MMLEADS Variables Utilized in Analysis
- TABLE A-2: Medicaid Eligibility Pathway to Full-Dual Status, by Current Reason for Medicare Eligibility
- TABLE A-3: Select Characteristics of Full-Dual Beneficiaries at Time of Transition to Full-Dual Status, by Medicaid Eligibility Pathway (2007-2010)
- TABLE A-4: Medicaid/Medicare Utilization and Spending for Full-Dual Beneficiaries in the First Month of Transition to Full-Dual Status, by Medicaid Eligibility Pathway
ACRONYMS
The following acronyms are mentioned in this report and/or appendix.
| CCW | Chronic Conditions data Warehouse |
|---|---|
| COPD | Chronic Obstructive Pulmonary Disease |
| DI | Disability Insurance |
| ED | Emergency Department |
| ESRD | End-Stage Renal Disease |
| HCBS | Home and Community-Based Services |
| LCL | Lower Confidence Limit |
| LTSS | Long-Term Services and Supports |
| MA | Medicare Advantage |
| MACPAC | Medicaid and CHIP Payment and Access Commission |
| MAX | Medicaid Analytic eXtract |
| MedPAC | Medicare Payment Advisory Commission |
| MMA | Medicare Modernization Act |
| MMLEADS | Medicare-Medicaid Linked Enrollee Analytic Data Source |
| OASI | Old Age and Survivor's Insurance |
| ResDAC | Research Data Assistance Center |
| RTI | Research Triangle Institute |
| SD | Standard Deviation |
| SNF | Skilled Nursing Facility |
| SSA | U.S. Social Security Administration |
| SSDI | Social Security Disability Insurance |
| SSI | Supplemental Security Income |
| UCL | Upper Confidence Level |
EXECUTIVE SUMMARY
Background
Over 11 million people are dually eligible for Medicare and Medicaid services. In 2012, dual eligibles (with partial or full benefits) represented 20% of all Medicare beneficiaries and 15% of all Medicaid beneficiaries but account for about 34% of total Medicare spending and 33% of total Medicaid spending. There are multiple pathways to becoming dually eligible for Medicare and Medicaid. However, current understanding of these pathways remains limited. The objective of this project is to identify the frequency with which the various pathways to dual eligible status are followed and to understand the circumstances and characteristics of individuals surrounding their transition to dual eligible status. Differences in the pathways to dual eligibility have implications for Medicare and Medicaid spending and service use patterns. Understanding these differences can inform policy efforts to support the dual eligible population and individuals at risk for becoming dually eligible.
This study answers the following six specific questions:
-
What is the frequency with which specific pathways to dual eligible status are followed by individuals, as identified from administrative data?
-
For each eligibility pathway, what is the basis of eligibility for both Medicaid and Medicare?
-
What proportion of new dual eligibles are long-term services and supports (LTSS) users, by age? Within the subgroup of new dual eligibles who are LTSS users, how do their pathways to dual status differ by age and by the types of LTSS used?
-
Among new dual eligibles, how many LTSS users are enrolled in Medicaid prior to age 65?
-
Among new dual eligibles, how many begin LTSS use prior to becoming dually eligible?
-
What beneficiary characteristics are associated with the transition to full-dual status?
Methods
To answer these questions, we utilized the Medicare-Medicaid Linked Enrollee Analytic Data Source for 2006-2010, to identify all individuals who made the transition to full-dual eligibility for the first time between 2007 and 2010. We identified three temporal pathways in which individuals can become dual eligibles: Medicare-to-Medicaid, Medicaid-to-Medicare, and simultaneous transition to eligibility for both programs. Along each pathway, we identified the reasons for Medicaid and Medicare eligibility. We further examined demographics, chronic conditions, as well as Medicaid and Medicare utilization and spending at the time of initial transition to full-dual status. In this analysis, dual eligibles refer to beneficiaries with full Medicaid benefits as well as full Medicare benefits.
Results
We identified 3,881,656 individuals who became full-benefit dual eligibles for the first time during 2007-2010. Thus, almost 1 million people a year newly gained full-dual eligibility status. Of these individuals, 67.1% became eligible for Medicare and subsequently for Medicaid, 27.2% became eligible for Medicaid and then Medicare, and 4.9% became eligible for both programs simultaneously (fewer than 1% with temporal pathway undetermined). In the 12 months following initial transition to full-dual status, approximately 70% of individuals retained full-dual coverage for the entire 12 months.
There were major differences among individuals on these temporal pathways in terms of demographic characteristics, reasons for Medicaid and Medicare eligibility, and patterns of Medicaid and Medicare service utilization at the time of transition to full-dual status. Measures of service utilization are limited to fee-for-service beneficiaries of each program.
Among individuals who followed the Medicare-to-Medicaid pathway, the majority were age 65 or older (68.0%) at the time of transition to full-dual status and were eligible for Medicare due to their age (59.4%). This contrasts with those in the Medicaid-to-Medicare pathway, most of whom were younger than 65 (69.1%) and were eligible for Medicare due to disability (65.7%). However, a substantial proportion (39.1%) of individuals in the Medicare-to-Medicaid pathway were also originally eligible for Medicare due to disability.
The prevalence of selected chronic conditions is higher among individuals in the Medicare-to-Medicaid pathway than among those in the other two temporal pathways. This is expected given the finding that individuals on the Medicare-to-Medicaid pathway were generally older than those on the other two pathways.
Our results also revealed racial/ethnic differences in the transition to full-dual eligibility. Nearly half of all individuals on the Medicaid-to-Medicare pathway and roughly one-third of those on the Medicare-to-Medicaid pathway were racial/ethnic minorities. Among a cohort of new Medicare enrollees in 2006 who were not also Medicaid-eligible at the time of initial Medicare coverage, the chances of transitioning to full-dual eligibility in the subsequent months through 2010 were 3-4 times as high for individuals of racial/ethnic minority groups as those who were nonHispanic Whites.
Reason for Medicaid eligibility at the time of transition to full-dual status varied by temporal pathway. Receipt of Supplemental Security Income (SSI) cash assistance was the predominant reason for Medicaid eligibility among individuals making the Medicaid-to-Medicare transition. For individuals following the Medicare-to-Medicaid pathway, "Other" and "Medically Needy" were the two most frequent reasons for Medicaid eligibility. A substantial portion of the "Other" Medicaid eligibility category includes individuals age 65 or older who qualify for Medicaid due to the special income rule, which allows states to cover individuals who require institutional level care but have an income too high to qualify for Medicaid otherwise.
Patterns of Medicare and Medicaid service utilization and spending at the time of initial transition to full-dual status vary by specific transition pathway. Below are a few highlights:
-
Among individuals making the Medicare-to-Medicaid transition, a substantial proportion used Medicare-covered services in the first month of transition to full-dual status: 13.7% with a hospitalization, 8.6% with an emergency department visit, and 17.0% with skilled nursing facility (SNF) care.
-
Total Medicare spending in the first month of full-dual coverage is about four times higher for individuals in the Medicare-to-Medicaid pathway than for those in the other temporal pathways, driven by their relatively higher utilization of hospital inpatient care, emergency department visits, and SNF services.
-
In general, individuals eligible for Medicaid in the "Medically Needy" and "Other" categories had similar rates of both Medicaid and Medicare utilization. These individuals had the highest utilization of Medicaid covered nursing facility services and Medicare-covered SNF services in the first month of full-dual coverage.
-
Individuals in the "Other" Medicaid eligibility group had the highest total Medicaid spending (average $1,404 per beneficiary) and highest total Medicare spending (average $4,884 per beneficiary) in the first month of full-dual coverage.
-
Among individuals making the Medicare-to-Medicaid transition (most of whom were age 65 or older), 30.0% received some form of Medicaid covered LTSS--predominantly institutional services--in the first month of full-dual coverage. In comparison, 16.9% of individuals on the Medicaid-to-Medicare pathway (most of whom were under age 65) had any Medicaid LTSS use--predominantly home and community-based services.
-
Individuals eligible for Medicaid in the "Other" category had the highest rate of Medicaid LTSS use (45.2%) in the first month of full-dual coverage, followed by those in the "Medically Needy" category (29.6%).
-
Among individuals who newly became full-dual eligible and who also began a new spell of Medicaid LTSS use at some point during 2007-2010, only about one-fifth began using LTSS before transition to full-dual status. Thus, most of these new LTSS users started using LTSS upon or after initial transition to full-dual status.
Conclusion
There are several different pathways to becoming dual eligible. Individuals can become eligible for one of the programs before the other based on age, disability, or income; it is also possible to simultaneously become eligible for both programs. These pathways typically differ for younger adults (ages 18-64) and for older adults (age 65 or older). The reason for Medicare eligibility is relatively stable and predictable because Medicare is a federal program with uniform eligibility rules and benefits. Generally, individuals qualify for Medicare because of age or disability. However, the pathway to Medicaid eligibility is more complex and varied, due to different eligibility rules and benefits across the states. Broadly, individuals making the transition to full-dual status qualified for Medicaid by one of the following eligibility categories: Low Income--SSI-Cash, Low Income--Poverty, Medically Needy, Section 1115 Waiver, or Other (a residual category capturing individuals who meet state eligibility criteria based on special income rule or other requirements).
Given a long-standing interest in the issue of spenddown to Medicaid among older adults, the focus of policy attention has been on the Medicare-to-Medicaid transition, which is likely accompanied by the use of expensive uncovered medical care and LTSS. Among individuals making the Medicare-to-Medicaid transition, it is plausible that many in the "Medically Needy" or "Other" Medicaid eligibility categories qualified for Medicaid by spending down their incomes to the level of state Medicaid eligibility. Medicaid-to-Medicare is also an important pathway, whereby qualified low income or disabled individuals receive Medicaid-covered services before they become Medicare eligible. Most individuals following this pathway were under age 65 or people who became dually eligible by aging into 65, rather than older people who spent down to Medicaid.
Although Medicaid LTSS use certainly figures in the transitions of many individuals to full-dual status, our results indicate that most people make the transition without using Medicaid LTSS. This suggests that they make the transition because they are older and poor (if on the Medicare-to-Medicaid pathway), or because they have attained Medicare eligibility upon turning 65 or have been on Social Security Disability Insurance for 24 months (if on the Medicaid-to-Medicare pathway).
This study shows that reasons for Medicaid and Medicare eligibility, demographic characteristics, presence of chronic conditions, and service utilization at the time of initial transition to full-dual status vary by pathway, suggesting that different subgroups of dually eligible beneficiaries may have different care needs. In particular, a substantial portion of the people transitioning to full-dual status have severe mental illness, or Alzheimer's disease or related dementias. Individuals with these conditions tend to have more complex care needs and higher health care spending than people without these conditions. In addition, a disproportionate number of people transitioning to dual status are racial/ethnic minorities.
The findings from this study can inform policy efforts to support individuals at risk of becoming dual eligibles and address their care needs both during and after the transition to full-dual status.
1. INTRODUCTION
Over 11 million people are dually eligible for Medicare and Medicaid services, and this population is growing rapidly. Between 2006 and 2015, the number of dual eligibles increased from 8.5 million to 11.4 million (Medicare-Medicaid Coordination Office, 2016). Medicare-Medicaid beneficiaries who are dually eligible comprise an important subset of the Medicare and Medicaid populations because of their high prevalence of chronic conditions and disabilities, substantial care needs, and high health and long-term care expenditures (Young et al., 2013). Individuals who are dually eligible can receive either partial or full Medicaid benefits depending on state Medicaid eligibility criteria. In 2012, dual eligibles (with partial or full benefits) represented 20% of Medicare beneficiaries and 15% of Medicaid beneficiaries, accounting for about 34% of total Medicare spending and 33% of total Medicaid spending (MedPAC and MACPAC, 2017).
Individuals become dually eligible for Medicare and Medicaid programs through multiple pathways. They can become eligible for one of the programs before the other, based on age, disability, or income; or they may simultaneously become eligible for both programs (Woodcock et al., 2011). These pathways typically differ for younger adults (ages 18-64) and for older adults (age 65 or older).
Individuals aged 18-64 who have physical or mental disabilities that make them eligible for Social Security Disability Insurance (SSDI) can meet the federal requirements for Medicare eligibility following a 24-month period on SSDI (with some exceptions) (Bubolz, Emerson, and Skinner, 2012). Many of these individuals also receive Supplemental Security Income (SSI), which allows them to meet state requirements for automatic Medicaid coverage currently in all but nine states, known as 209(b) states (SSA, 2016). The 209(b) states have their own Medicaid eligibility criteria, at least one of which is more restrictive than required for SSI. However, they must provide for deducting incurred medical expenses from income so that individuals may spenddown to the state Medicaid eligibility level (Woodcock et al., 2011). Low income individuals who have Medicaid coverage prior to reaching age 65 can become dually eligible by aging into eligibility for Medicare.
Adults age 65 or older who are eligible for Social Security are also eligible for Medicare based on age and paying Social Security/Medicare taxes for a predefined period. Low income Medicare beneficiaries may become eligible for Medicaid by receiving SSI or by "spending down" to Medicaid eligibility after incurring high medical costs, often due to institutional/nursing home care, or participation in Medicaid home and community-based services (HCBS) waivers that have higher eligibility levels (Irvin, Borck, and Lim, 2013). Each eligibility pathways has distinct income and asset requirements that can vary across states, making some more accessible and more frequently utilized than others (Kaiser Family Foundation, 2014; Watts, Cornachione, and Musumeci, 2016).
The objective of this project is to identify the frequency with which the various pathways to dual eligible status are followed and to understand the circumstances and characteristics of individuals surrounding their transition to dual eligible status. In this analysis, the term dual eligibles refers to beneficiaries with full Medicaid benefits as well as full Medicare benefits. Differences in the pathways to dual eligibility have implications for Medicare and Medicaid spending and service use patterns. Understanding these differences can inform policies and interventions to support the dual eligible population and individuals at risk for becoming dually eligible. We address this objective by answering six specific research questions, enumerated below:
-
What is the frequency with which specific pathways to dual eligible status are followed by individuals, as identified from administrative data?
-
For each eligibility pathway, what is the basis of eligibility for both Medicaid and Medicare?
-
What proportion of new dual eligibles are long-term services and supports (LTSS) users, by age? Within the subgroup of new dual eligibles who are LTSS users, how do their pathways to dual status differ by age and by the types of LTSS used?
-
Among new dual eligibles, how many LTSS users are enrolled in Medicaid prior to age 65?
-
Among new dual eligibles, how many begin LTSS use prior to becoming a dual eligible?
-
What beneficiary characteristics are associated with the transition to full-dual status?
2. METHODS
2.1. Data Source
We used the national Medicare-Medicaid Linked Enrollee Analytic Data Source (MMLEADS) for 2006-2010, the most recent years of data available at the time of our research. MMLEADS contains data on demographics (age, sex, race/ethnicity, date of birth, date of death), program eligibility (Medicare/Medicaid coverage initial start date, original reason for Medicare eligibility and current reason for Medicare/Medicaid eligibility, dual status indicator, fee-for-service [FFS] vs. managed care enrollment), utilization, and spending for all Medicare/Medicaid enrollees (Buccaneer, 2015). Monthly data for most of these variables (e.g., flags for dual status, Medicaid Analytic eXtract [MAX] uniform eligibility codes, Medicare/Medicaid service utilization and spending) are available in MMLEADS. A list of key MMLEADS source variables used in the analyses is provided in Appendix Table A-1.
2.2. Study Population: New Dual Eligibles
In this study, we focused on new dual eligible beneficiaries with full Medicaid and Medicare benefits (full-dual eligibles). Full-benefit dual eligibles constitute most of the total population of dual eligibles. New full-dual eligibles were defined as individuals who experienced their initial transition to full-dual status at some point from January 2007 through December 2010, but had never been a full-dual in calendar year 2006. This allows a look-back period of at least 1 year for every person prior to their transition to full-dual status. Full-dual status was identified using the monthly dual status code with values of either 02 (Qualified Medicare Beneficiaries plus full Medicaid), 04 (Specified Low-Income Medicare Beneficiaries plus full Medicaid), or 08 (other full-benefit duals); the original data source for this code is the Medicare Modernization Act (MMA) State File (Buccaneer, 2015). The first month and year in which an individual was identified as a full-dual was considered their initial point of transition to full-dual status. A total of 3,881,656 new full-dual eligibles were identified who met the inclusion criteria over 2007-2010.
2.3. Temporal Pathways to Full-Dual Status
We identified three temporal pathways to Medicare-Medicaid dual eligibility:
-
Medicare-to-Medicaid: An individual began as a Medicare beneficiary and subsequently became eligible for Medicaid with full benefits.
-
Medicaid-to-Medicare: An individual began as a Medicaid beneficiary (with or without full benefits) and subsequently became eligible for Medicare (with full Medicaid benefits).
-
Simultaneous transition to dual eligible status: An individual was not eligible for either Medicare or full Medicaid coverage and subsequently gained eligibility for both programs with full benefits concurrently.
We determined temporal pathways using the Medicare coverage start date (first occurrence of Medicare Part A or B coverage, based on Medicare enrollment) and the Medicaid coverage start date (first occurrence of Medicaid coverage since 1999, based on the MAX uniform eligibility code). However, while Medicare enrollees tend to retain their coverage once enrolled, Medicaid coverage is less stable owing to changes in income, eligibility status, and failure to renew (Riley, 2014). Thus, it was necessary to use additional information to confirm that an individual's Medicaid coverage start date, which might be as far back as 1999, indicated that coverage continued into our study period (2006-2010). For those individuals with Medicaid coverage start dates prior to January 1, 2006, we used the MMLEADS monthly flag to identify the first month and year of Medicaid coverage during 2006-2010 and treated this as the effective start of Medicaid coverage.
A person's pathway was considered "simultaneous" if his or her Medicare and Medicaid coverage start dates were in the same month and year or within 3 months of each other. We used a 3-month period of overlap (as opposed to 1-month) to accommodate for delays or inaccuracies in reporting new coverage. A graphic illustration of the temporal pathways with further detail is provided in Appendix Figure A-1.
2.4. Reason for Medicaid and Medicare Eligibility
We identified an individual's reason for Medicaid eligibility from the monthly flag of Medicaid maintenance assistance status in MMLEADS, which is derived from the MAX uniform eligibility code. The variable classifies reasons for Medicaid eligibility into five categories, also referred to as Medicaid eligibility groups or pathways in this study:
-
Low Income--SSI-Cash: Individuals who are Medicaid-eligible because of receiving SSI-cash benefits.
-
Low Income--Poverty: Individuals with an income below a set threshold related to the federal poverty level.
-
Medically Needy: Individuals with income too high to qualify for Medicaid but may "spenddown" by incurring high medical expenses which, when subtracted from one's income, bring the income below the state's specified medically needy income level. This category can also include people whose regular incomes are below the medically needy level.
-
Section 1115 Waiver: Individuals receiving benefits through expanded eligibility criteria established by a state's expansion of coverage through a research demonstration waiver agreement with the Centers for Medicare & Medicaid Services.
-
Other: Individuals who meet state eligibility criteria for Medicaid based on income or other eligibility requirements but are not categorized in a preceding category.
A person can be in only one of these categories in any given month (Buccaneer, 2015).
Medicare original and current reasons for eligibility are each classified into the following four categories (Buccaneer, 2015):
-
Old Age and Survivor's Insurance (OASI): Individuals 65 or older.
-
Disability Insurance: Individuals under 65 who have received SSDI benefits for 24 months or more.
-
End-Stage Renal Disease (ESRD): Individuals with ESRD (kidney failure requiring dialysis or transplant).
-
Disability Insurance and ESRD: Individuals who are eligible due to both ESRD and receipt of SSDI benefits.
2.5. Analytic Approach
Among the new full-dual eligibles identified, we report the frequency of each of the temporal pathways to full-dual status (Medicare-to-Medicaid, Medicaid-to-Medicare, or simultaneous eligibility), and within each, the frequency of specific pathways to dual eligibility (based on reasons for Medicaid and Medicare eligibility). These analyses answer the following research questions:
Research Question 1: What is the frequency with which specific pathways to dual eligible status are followed by individuals, as identified from administrative data?
Research Question 2: For each eligibility pathway, what is the basis of eligibility for both Medicaid and Medicare?
In addition, we compared beneficiary characteristics (age, sex, race/ethnicity), presence of chronic conditions, and Medicaid and Medicare utilization and spending on select services in the month of initial transition to full-dual status, by pathway. These variables are briefly described below.
Demographic Characteristics. We calculated age (in years) as of the month and year of initial transition to full-dual status. We defined race/ethnicity using the Medicare beneficiary race code in MMLEADS, which is derived from the Social Security Administration (SSA) and is generally more complete than the information provided by the Medicaid race code (Buccaneer, 2015).
Chronic Conditions. We identified the presence or absence of several chronic conditions for all new dual eligibles. Specifically, we determined whether each beneficiary had ever had a particular chronic condition up to and including the month and year of transition to full-dual status. This was derived from MMLEADS variables that specify the presence of treatment for common or chronic conditions as indicated by Medicare and Medicaid claims from January 1, 1999, through the month and year of transition to full-dual status as a proxy for evidence of the presence of a condition (Buccaneer, 2015).
Utilization and Expenditure. For the month of initial transition to full-dual status, we identified the number and percent of beneficiaries who had any utilization of select health care services, such as inpatient hospital, emergency department, skilled nursing facility (SNF), home health, and hospice. Because the utilization and expenditure measures are based on FFS Medicare or Medicaid claims, we calculated and reported these measures only for beneficiaries who were enrolled in FFS Medicare or Medicaid in the month of transition to full-dual status.
We further identified and reported the use of LTSS for which Medicaid was the payer, in three measures: any LTSS use, any institutional LTSS use, and any use of HCBS. In any given month, if a person used multiple types of LTSS, then that person was assigned to the type that reflected the most intensive level of LTSS received. Institutional LTSS included nursing facility services, mental hospital services for the aged, inpatient psychiatric facility for individuals under age 21, or Indian health services. Home and community-based LTSS included services received under Section 1915(d) or 1915(c) waivers, home health, or personal care services (Buccaneer, 2015).
Research Questions 3-5 are specific to Medicaid LTSS users who are subgroups of all new dual eligibles identified above from 2007-2010. Below, we describe the approach to addressing each of these questions.
Research Question 3: What proportion of new dual eligibles are LTSS users, by age? Within the subgroup of new dual eligibles who are LTSS users, how do their pathways to dual status differ by age and by the types of LTSS used?
To answer the first part of this question, we limited the sample to those full-dual eligibles who had Medicaid FFS eligibility in the month of transition to full-dual status. Among them, we identified Medicaid LTSS users in the transition month. Within this subgroup of new full-duals who were also LTSS users, we address the second part of the question by tabulating the number and percentage of individuals in each of the dual eligibility pathways, stratified by age at the time of transition to full-dual status (under 65 vs. 65+) and by types of LTSS used (institutional vs. HCBS).
Research Question 4: Among new dual eligibles, how many LTSS users were enrolled in Medicaid prior to age 65?
To answer this question, we used the subgroup of new full-duals who used any Medicaid LTSS in the month of transition to full-dual status, as identified above in addressing Research Question 3. We then calculated age for each person in this subgroup of LTSS users as of his or her Medicaid coverage start date, and reported the number and percentage of persons whose age was under 65.
Research Question 5: Among new dual eligibles, how many began LTSS use prior to becoming a dual eligible?
To approach this question, we identified all individuals who began a new spell of Medicaid LTSS use among all new dual eligibles. A new spell of LTSS use was the first instance during 2007-2010 (excluding those who used LTSS in 2006) where an individual had both Medicaid FFS coverage and Medicaid LTSS use in the same calendar month and year. We then compared the month and year of first Medicaid LTSS use with the month and year of initial transition to full-dual status to determine which occurred first.
Research Question 6: What beneficiary characteristics are associated with the transition to full-dual status?
To address this question, we examined Medicare-only beneficiaries who did or did not subsequently become dual eligible and whether these two groups had different beneficiary characteristics (original reason for Medicare eligibility, age at Medicare coverage start date, sex, and race/ethnicity) at the onset of Medicare coverage. Specifically, we identified a cohort of new Medicare enrollees from 2006 (N=2,490,993), who met the following inclusion criteria: (1) Medicare coverage started in 2006; (2) were Medicare-only (no Medicaid coverage) in the first month of Medicare coverage; and (3) did not die in the first month of Medicare coverage.
From the first month of Medicare coverage in 2006 (which varied by person and could be any calendar month in that year), we followed each person in all subsequent months through December 2010 (the end of the follow-up period with data available for this analysis) until the point (month and year) at which one of the following occurred: (1) the person transitioned to full-dual status; (2) the person died during the follow-up period without transition to full-dual status before death; or (3) the person survived without transition to full-dual status throughout the follow-up period. The first category includes individuals who experienced the event (outcome) of interest, and the last two categories include those who did not. We then compared the characteristics of beneficiaries who transitioned to full-dual status as compared with those who did not.
3. RESULTS AND DISCUSSION
3.1. Temporal Pathways to Full-Dual Eligibility
Table 3-1 shows the frequencies and percentage of all new full-duals identified from 2007-2010 who followed each of the three temporal pathways: Medicare-to-Medicaid, Medicaid-to-Medicare, and Simultaneous. Of the 3,881,656 individuals identified as newly dual eligible, approximately two-thirds (67.1%) were first enrolled in Medicare and subsequently became Medicaid-eligible with full benefits. Just over one-quarter (27.2%) followed the Medicaid-to-Medicare pathway. About 4.9% qualified for Medicare and Medicaid simultaneously.
| TABLE 3-1. Frequencies and Percentages of New Full-Dual Beneficiaries, by Temporal Pathway (2007-2010) | |||||
|---|---|---|---|---|---|
| Medicare-to-Medicaid | Medicaid-to-Medicare | Simultaneous Eligibility | Unknown | Total | |
| N | 2,606,018 | 1,055,701 | 190,935 | 29,002 | 3,881,656 |
| Percentage | 67.14 | 27.20 | 4.92 | 0.75 | 100.00 |
| SOURCE: RTI analysis of MMLEADS data. | |||||
3.2. Retaining Full-Dual Eligibility
We conducted an exploratory analysis of continuity in dual eligibility after the initial transition to full-dual status, with results described here (not presented in tables). We found that among individuals with 12 months of follow-up after their initial transition to full-dual status, approximately 70% retained full-dual eligibility throughout the 12 months (in other words, about 30% experienced some gaps in full-dual coverage).
3.3. Medicaid and Medicare Eligibility Pathways to Full-Dual Status
Figure 3-1 shows the reason for Medicaid eligibility at the time of transition to full-dual status. Of all individuals who transitioned to full-dual status, 31.1% were eligible for Medicaid by qualifying for "Low Income--SSI-Cash," 29.8% for "Other," and 18.7% for "Medically Needy" criteria.
Figure 3-2 displays the current reason for Medicare eligibility at the time of transition to full-dual status among all new full-dual beneficiaries. The majority (58.3%) of them were Medicare eligible on the basis of age, followed by 39.7% due to disability. Only approximately 2.0% were eligible for Medicare because of ESRD or Disability and ESRD.
| FIGURE 3-1. Reason for Medicaid Eligibility at Time of Transition to Full-Dual Status: All Individuals (2007-2010) |
|---|
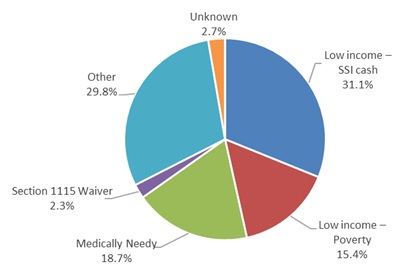 |
| SOURCE: RTI analysis of MMLEADS data. NOTE: See Appendix Table A-2 for data with more details. |
| FIGURE 3-2. Current Reason for Medicare Eligibility at Time of Transition to Full-Dual Status: All Individuals (2007-2010) |
|---|
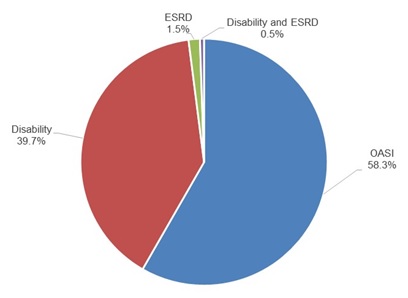 |
| SOURCE: RTI analysis of MMLEADS data. NOTE: See Appendix Table A-2 for data with more details. |
Figure 3-3 depicts the reason for Medicaid eligibility grouped by current reason for Medicare eligibility for all individuals at the time of transition to full-dual status. Among those eligible for Medicare because of age, the most frequent reason for Medicaid eligibility was "Other" (37.6%), followed by "Medically Needy" and "Low Income--SSI-Cash," each accounting for approximately 23.0% of the group. Among those eligible for Medicare due to disability, 43.9% were Medicaid-eligible due to "Low Income--SSI." Among those eligible for Medicare due to ESRD, 62% were eligible for Medicaid due to "Low Income--SSI." Across all Medicare eligibility groups, "Low Income--SSI-Cash" and "Other" were the most common reasons for Medicaid eligibility, whereas "Section 1115 waiver" was the least common reason for Medicaid eligibility.
| FIGURE 3-3. Reason for Medicaid Eligibility at Time of Transition To Full-Dual Status, by Current Reason for Medicare Eligibility (2007-2010) |
|---|
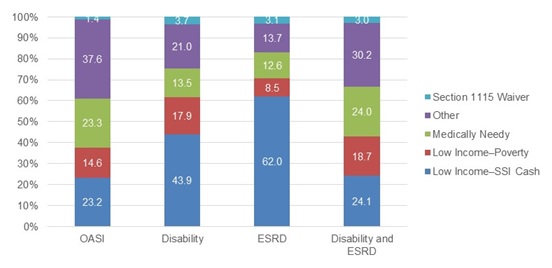 |
| SOURCE: RTI analysis of MMLEADS data. NOTE: See Appendix Table A-2 for data with more details. |
In Table 3-2, we show the Medicaid and Medicare reasons for eligibility at the time of transition to full-dual status, by temporal pathway. Receiving SSI-Cash assistance was the most frequent reason for Medicaid eligibility in the Medicaid-to-Medicare pathway (55.1%), whereas Medicaid eligibility was more varied among those in the Medicare-to-Medicaid pathway, with "Other" being the most frequent reason for Medicaid eligibility (37.1%) and a larger portion of beneficiaries (22.4%) following the Medically Needy (spenddown) pathway to Medicaid eligibility than in the other two temporal pathways.
| TABLE 3-2. Medicaid and Medicare Reasons for Eligibility for New Full-Dual Beneficiaries at Time of Transition to Full-Dual Status, by Temporal Pathway (2007-2010) | ||||||||
|---|---|---|---|---|---|---|---|---|
| Total | Medicare-to-Medicaid | Medicaid-to-Medicare | Simultaneous | |||||
| # | % | # | % | # | % | # | % | |
| Beneficiaries (N) | 3,852,654 | 100 | 2,606,018 | 100 | 1,055,701 | 100 | 190,935 | 100 |
| Medicaid eligibility: | ||||||||
| Low income--SSI-cash | 1,198,514 | 31.11 | 523,657 | 20.09 | 581,573 | 55.09 | 93,284 | 48.86 |
| Low income--Poverty | 593,725 | 15.41 | 410,611 | 15.76 | 144,583 | 13.70 | 38,531 | 20.18 |
| Medically Needy | 720,585 | 18.70 | 582,874 | 22.37 | 108,890 | 10.31 | 28,821 | 15.09 |
| Other | 1,147,891 | 29.79 | 967,527 | 37.13 | 160,900 | 15.24 | 19,464 | 10.19 |
| Section 1115 Waiver | 88,127 | 2.29 | 43,469 | 1.67 | 39,598 | 3.75 | 5,060 | 2.65 |
| Unknown | 103,812 | 2.69 | 77,880 | 2.99 | 20,157 | 1.91 | 5,775 | 3.02 |
| Medicare eligibility: | ||||||||
| OASI | 2,022,340 | 52.49 | 1,548,340 | 59.41 | 336,605 | 31.88 | 137,395 | 71.96 |
| DI | 1,751,035 | 45.45 | 1,017,959 | 39.06 | 693,449 | 65.69 | 39,627 | 20.75 |
| ESRD | 55,709 | 1.45 | 21,017 | 0.81 | 21,602 | 2.05 | 13,090 | 6.86 |
| DI and ESRD | 23,570 | 0.61 | 18,702 | 0.72 | 4,045 | 0.38 | 823 | 0.43 |
| SOURCE: RTI analysis of MMLEADS data. NOTES: Medicare eligibility in this table is original reason for Medicare entitlement. For beneficiaries with unknown or missing reason for Medicaid eligibility in the first month of transition to full-dual status, we looked forward up to 3 months to pick up Medicaid eligibility information, if available (given possible lags in the reporting of such information). Those whose temporal pathway could not be discerned were excluded from this table. | ||||||||
A large portion of beneficiaries (55.1%) in the Medicaid-to-Medicare pathway qualified for Medicaid based on receiving SSI-Cash assistance. SSI-Cash provides monetary support for low income individuals who are blind, disabled or aged (65 or older) with income and resources below a specified threshold. It is likely that those in the Medicaid-to-Medicare pathway may be eligible for SSI-Cash assistance due to a disability and begin to receive Medicare benefits following the 24-month waiting period.
Most beneficiaries in the Medicare-to-Medicaid pathway were eligible for Medicare because of age (59.4%). This contrasts with those in the Medicaid-to-Medicare pathway, most of whom were eligible due to disability (65.7%). However, a substantial proportion of those in the Medicare-to-Medicaid pathway were originally eligible for Medicare due to disability (39.1%).
3.4. Beneficiary Characteristics at the Time of Transition to Full-Dual Status
At the time of transition to full-dual status, there are notable differences in the characteristics of individuals across the three temporal pathways, as shown in Table 3-3 and described below.
| TABLE 3-3. Select Characteristics of New Full-Dual Beneficiaries at Time of Transition to Full-Dual Status, by Temporal Pathway (2007-2010) | ||||||
|---|---|---|---|---|---|---|
| Medicare-to-Medicaid | Medicaid-to-Medicare | Simultaneous Eligibility | ||||
| # | % | # | % | # | % | |
| Age: | ||||||
| 65 | 833,221 | 31.97 | 729,416 | 69.10 | 54,385 | 28.48 |
| 65 | 129,439 | 4.97 | 275,362 | 26.08 | 110,559 | 57.90 |
| >65 | 1,643,269 | 63.06 | 50,856 | 4.82 | 25,989 | 13.61 |
| Sex: | ||||||
| Male | 1,023,210 | 39.26 | 455,803 | 43.18 | 81,794 | 42.84 |
| Female | 1,582,803 | 60.74 | 599,886 | 56.82 | 109,121 | 57.16 |
| Race & ethnicity: | ||||||
| White, nonHispanic | 1,740,631 | 66.79 | 542,733 | 51.41 | 74,030 | 38.77 |
| Black | 438,941 | 16.84 | 238,720 | 22.61 | 31,943 | 16.73 |
| Hispanic | 285,627 | 10.96 | 179,721 | 17.02 | 50,136 | 26.26 |
| Asian/Pacific Islander | 91,753 | 3.52 | 61,363 | 5.81 | 28,832 | 15.10 |
| American Indian/Alaska Native | 18,983 | 0.73 | 11,855 | 1.12 | 1,790 | 0.94 |
| Other/unknown | 30,083 | 1.15 | 21,309 | 2.02 | 4,204 | 2.20 |
| Ever had the following chronic condition: | ||||||
| Alzheimer's or related dementia | 700,445 | 26.88 | 30,033 | 2.84 | 1,636 | 0.86 |
| COPD | 677,334 | 25.99 | 146,691 | 13.90 | 4,116 | 2.16 |
| Diabetes | 831,194 | 31.90 | 258,280 | 24.47 | 15,712 | 8.23 |
| Heart failure | 778,484 | 29.87 | 125,150 | 11.85 | 6,834 | 3.58 |
| Stroke | 459,880 | 17.65 | 61,573 | 5.83 | 2,231 | 1.17 |
| Hypertension | 1,644,876 | 63.12 | 444,727 | 42.13 | 27,120 | 14.20 |
| Depression | 963,355 | 36.97 | 296,840 | 28.12 | 7,688 | 4.03 |
| Cancera | 255,708 | 9.81 | 45,828 | 4.34 | 2,331 | 1.22 |
| Serious mental illnessb | 926,922 | 35.57 | 333,139 | 31.56 | 6,382 | 3.34 |
| Mobility impairment | 201,848 | 7.75 | 45,134 | 4.28 | 1,180 | 0.62 |
| Intellectual disabilities and related conditions | 47,716 | 1.83 | 45,205 | 4.28 | 223 | 0.12 |
| Count of CCW chronic conditions (range 0-26),c Mean (SD) | 5.54 (4.44) | 2.73 (2.67) | 0.72 (1.43) | |||
| Count of conditions related to intellectual, developmental and physical disability (range 0-14),d Mean (SD) | 0.26 (0.57) | 0.21 (0.58) | 0.02 (0.14) | |||
| SOURCE: RTI analysis of MMLEADS data. NOTES:
| ||||||
Age. Individuals using the Medicare-to-Medicaid pathway are older, with 68.0% aged 65 or older in the first month of transition to full-dual status, as compared to 30.9% of those in the Medicaid-to-Medicare pathway. This finding is consistent with the notion that most people taking the Medicare-to-Medicaid pathway are eligible for Medicare because of their age and subsequently become Medicaid-eligible because of a change in income or assets or spenddown to Medicaid. One surprising result is that a substantial minority of individuals taking this pathway (32.0%) are under age 65 at the time of initial transition to full-dual status. Of individuals on this pathway, 39.1% (see Table 3-2) had SSDI as their original reason for Medicare eligibility, implying that a substantial portion of them are younger people with a disability.
Most individuals on the Medicaid-to-Medicare pathway are younger, with 69.1% under age 65 at the initial transition to full-dual status. This provides further support for the interpretation that most of these individuals are younger adults with disabilities, who became Medicare eligible after the 24-month waiting period for Medicare disability benefits.
Race and Ethnicity. The Medicare-to-Medicaid pathway includes the highest percentage of beneficiaries who are White nonHispanic (66.8%), as compared to 51.4% in the Medicaid-to-Medicare pathway.
Chronic Conditions. Across the three temporal pathways to dual eligibility, there are differences in the prevalence of chronic conditions. In general, the percentage ever having the selected chronic conditions is notably higher among beneficiaries in the Medicare-to-Medicaid pathway than among those in the other two temporal pathways. For example, there is a large difference in the prevalence of Alzheimer's disease and related dementias (26.9% among individuals in the Medicare-to-Medicaid pathway vs. 2.8% among those in the Medicaid-to-Medicare pathway). These results are as expected given that there are more older individuals in the Medicare-to-Medicaid pathway. One notable exception to this pattern is the higher percentage of individuals with intellectual disabilities and related conditions in the Medicaid-to-Medicare pathway (4.3%) than in the Medicare-to-Medicaid pathway (1.8%).
There are also differences in beneficiary characteristics by Medicaid eligibility pathway. In the text below, we highlight some of the notable differences, drawing on more detailed data provided in Appendix Table A-3.
Age. The age of beneficiaries in the first month of transition to full-dual status varies by reason for Medicaid eligibility. The majority of individuals in the "Section 1115 Waiver" (66.8%) and "Low Income--SSI-Cash" (58.5%) Medicaid eligibility categories were younger than 65 at the time of transition while the majority of individuals in the "Other" (71.5%), "Medically Needy" (70.4%), and "Low Income--Poverty" (53.3%) categories were 65 years or older.
Race and Ethnicity. The race and ethnicity also varied among these categories, with the highest proportion of minority (other than nonHispanic White) beneficiaries in the "Low Income--SSI-Cash" category (53.7%) and the lowest in the "Other" category (23.1%).
Chronic Conditions. The highest percentage of beneficiaries with any of the select chronic conditions was among those who were in the "Other" Medicaid eligibility category, followed by those in the "Medically Needy" category. Here again, there is one notable exception to this pattern in the percentage of individuals with intellectual disabilities and related conditions, which was highest among those who became eligible for Medicaid because of SSI-Cash assistance.
Figure 3-4 displays the mean number of chronic conditions among new full-dual beneficiaries, grouped by reason for Medicaid eligibility at the time of transition. The highest average number of conditions was among those in the "Other" category (6.6 per beneficiary), followed by the "Medically Needy" group (5.5 per beneficiary) and the "Poverty" group (3.6 per beneficiary). Those in the "Low Income--SSI-Cash" and the "Section 1115 Waiver" groups had similar average counts of conditions per beneficiary, about 2.7 per beneficiary, in each group.
| FIGURE 3-4. Mean Number of CCW Chronic Conditions, by Medicaid Eligibility Pathway (2007-2010) |
|---|
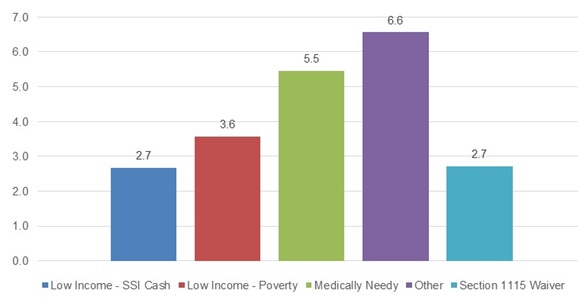 |
| SOURCE: RTI analysis of MMLEADS data. |
3.5. Medicaid/Medicare Utilization and Spending at the Time of Transition to Full-Dual Status
Below, we describe select measures of Medicaid and Medicare utilization and spending in the first month of transition to full-dual status, stratified by temporal pathway (Table 3-4) and also by Medicaid eligibility pathway (Figure 3-5 and Figure 3-6, and more detailed data in Appendix Table A-4). Measures specific to LTSS use are reported separately in a subsequent section. For all Medicaid measures of utilization and spending, the denominator is the number of individuals who had Medicaid FFS coverage in the first month of transition to full-dual status; similarly, for all Medicare measures, the denominator is the number of individuals with Medicare FFS in the first month of transition.
| TABLE 3-4. Medicaid/Medicare Utilization and Spending for New Full-Dual Beneficiaries in the First Month of Transition to Full-Dual Status, by Temporal Pathway (2007-2010) | ||||||
|---|---|---|---|---|---|---|
| Medicare-to-Medicaid | Medicaid-to-Medicare | Simultaneous Eligibility | ||||
| # | % | # | % | # | % | |
| Total N (FFS Medicaid beneficiaries) | 1,992,682 | 100.00 | 631,969 | 100.00 | 144,593 | 100.00 |
| Medicaid utilization (any use of each): | ||||||
| Hospital inpatient stay | 57,599 | 2.89 | 18,765 | 2.97 | 3,563 | 2.46 |
| ED visit | 20,944 | 1.05 | 11,364 | 1.80 | 1,196 | 0.83 |
| Nursing facility | 436,410 | 21.90 | 24,040 | 3.80 | 2,144 | 1.48 |
| Home health | 23,253 | 1.17 | 13,287 | 2.10 | 439 | 0.30 |
| Personal care services | 51,132 | 2.57 | 42,315 | 6.70 | 845 | 0.58 |
| Prescriptions | 395,485 | 19.85 | 267,645 | 42.35 | 23,243 | 16.07 |
| Medicaid spending (dollars), Mean (SD) | ||||||
| Total Medicaid program spendinga | 1,020 | (3,695) | 1,018 | (4,093) | 384 | (3,235) |
| Total Medicaid beneficiary cost-sharingb | 96 | (872) | 113 | (970) | 80 | (917) |
| Total N (FFS Medicare beneficiaries) | 1,867,941 | 100.00 | 886,133 | 100.00 | 132,270 | 100.00 |
| Medicare utilization (any use of each): | ||||||
| SNF | 317,893 | 17.02 | 3,096 | 0.35 | 1,294 | 0.98 |
| Home health | 80,123 | 4.29 | 2,019 | 0.23 | 508 | 0.38 |
| Hospice | 50,383 | 2.70 | 2,522 | 0.28 | 332 | 0.25 |
| Hospital inpatient stay | 255,900 | 13.70 | 29,607 | 3.34 | 5,286 | 4.00 |
| ED visit | 161,037 | 8.62 | 62,301 | 7.03 | 6,338 | 4.79 |
| Physician services | 1,118,297 | 59.87 | 353,204 | 39.86 | 42,621 | 32.22 |
| Durable medical equipment | 245,842 | 13.16 | 42,908 | 4.84 | 3,503 | 2.65 |
| Prescriptions | 854,379 | 45.74 | 431,702 | 48.72 | 27,641 | 20.90 |
| Medicare spending (dollars), Mean (SD) | ||||||
| Total Medicare program spendingc | 4,075 | (9,372) | 982 | (3,752) | 1,192 | (4,957) |
| Total Medicare beneficiary cost-sharingd | 609 | (1,230) | 190 | (454) | 219 | (525) |
NOTES:
| ||||||
As shown in Table 3-4, in general the Medicaid-to-Medicare pathway had a higher percentage of beneficiaries with any utilization of select Medicaid services as compared with those in the Medicare-to-Medicaid pathway, with one notable exception: over one-fifth (21.9%) of those on the Medicare-to-Medicaid pathway used Medicaid paid nursing facility services in the month of transition to full-dual status while only 3.8% did of those in the Medicaid-to-Medicare pathway. Beneficiaries in the Medicaid-to-Medicare pathway had much higher rates of utilization of prescription drugs and personal care services than those following other temporal pathways. For inpatient hospital stays and emergency department visits, similar rates of Medicaid utilization were observed across the three temporal pathway groups (although utilization remained the highest in the Medicaid-to-Medicare group).
In contrast, for the Medicare utilization measures the Medicare-to-Medicaid group had the highest percentage of beneficiaries with any utilization in all but one service category (Medicare-covered prescription drugs). Of individuals in that group, for example, 59.9% used Medicare-covered physician services, 17.0% used SNF services, 13.7% had a hospital inpatient stay, and 8.6% had an emergency department visit, in the first month of transition to full-dual status. Individuals transitioning along the Medicaid-to-Medicare pathway had much lower utilization of these Medicare-covered services--not surprising, given that they were new Medicare enrollees with coverage for only 1 month and relatively few of them would use such services in that month.
Total Medicare program spending in the first month of transition to full-dual status is, on average, approximately four times as high for those in the Medicare-to-Medicaid pathway as compared to those in the other temporal pathways. This high cost may be driven in a large part by the relatively high rates of utilization of hospital inpatient care, emergency department visits and SNF services in this group.
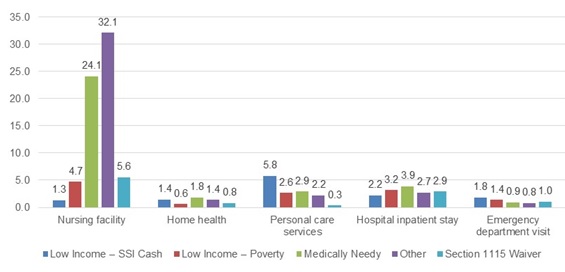
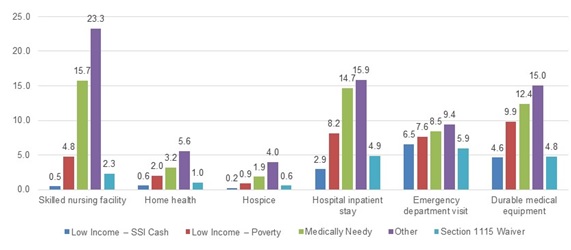
Figure 3-5 and Figure 3-6 present measures of Medicaid and Medicare utilization and spending for new full-dual beneficiaries in the first month of transition to full-dual status, by Medicaid eligibility pathway. In general, those who followed the "Medically Needy" and "Other" pathways to Medicaid had similar rates of Medicaid and Medicare service utilization. Individuals in these two Medicaid eligibility categories had the most frequent use of Medicaid covered nursing facility services (24.1% and 32.1%, respectively) and of Medicare-covered SNF services (15.7% and 23.3%, respectively) in the first month of full-dual eligibility, relative to those in other eligibility categories. Utilization rates for Medicaid covered hospital inpatient stays, emergency department visits, and home health services were similar across all of the Medicaid eligibility categories.
| FIGURE 3-5. Medicaid Utilization of Select Services in the First Month of Transition To Full-Dual Status, by Medicaid Eligibility Pathway (2007-2010) |
|---|
 |
| SOURCE: RTI analysis of MMLEADS data. |
| FIGURE 3-6. Medicare Utilization of Select Services in the First Month of Transition To Full-Dual Status, by Medicaid Eligibility Pathway (2007-2010) |
|---|
 |
| SOURCE: RTI analysis of MMLEADS data. |
Beneficiaries in the "Other" Medicaid eligibility group had the highest rates of Medicare utilization of all the select services, followed by those in the "Medically Needy" group, but their Medicare utilization profiles were similar (Figure 3-6). Notably, there was a difference in Medicare hospital inpatient stays across the Medicaid eligibility categories. Approximately 15% of beneficiaries in both the "Medically Needy" category (14.7%) and the "Other" category (15.9%) had any inpatient hospitalization during the month; however, among those in the "Section 1115 Waiver" and "Low Income--SSI-Cash" groups, less than 5.0% had an inpatient stay. These differences may also be attributable to the characteristics of beneficiaries in each eligibility category. Beneficiaries in the "Low Income--SSI-Cash" category were generally younger than those in the "Other" and "Medically Needy" categories and therefore may be healthier and less likely to utilize these Medicare-covered services. Those who were Medicaid-eligible due to receipt of SSI had the highest rate of Medicaid paid personal care services utilization (5.8%).
We also compared Medicare and Medicaid spending per beneficiary in the first month of transition to full-dual status, separately by Medicaid eligibility pathway. Here we describe the results briefly (more data details are included in Appendix Table A-4). In terms of program spending, beneficiaries in the "Other" Medicaid eligibility group had the highest total Medicaid spending (average $1,404 per beneficiary) and highest total Medicare spending (average $4,884 per beneficiary) in the first month of full-dual eligibility. Beneficiaries in the "Low Income--Poverty" group had the lowest total Medicaid spending ($422 per beneficiary), while those in the "Low Income--SSI-Cash" group had the lowest total Medicare spending ($869 per beneficiary).
3.6. Medicaid Long-Term Services and Supports Utilization
In this section, we first present results on LTSS utilization among all full-dual beneficiaries with Medicaid FFS coverage in the first month of transition to full-dual status, separately by temporal pathway (Table 3-5) and by reason for Medicaid eligibility (Table 3-6).
As shown in Table 3-5, the highest percentage of beneficiaries with any LTSS use was in the Medicare-to-Medicaid group (30.0%), followed by the Medicaid-to-Medicare (16.9%) group. Similarly, the use of institutional LTSS was the highest among those in the Medicare-to-Medicaid pathway (22.0%). Interestingly, while those in the Medicare-to-Medicaid pathway have the highest use of any LTSS, the majority of individuals (70%) on this pathway do not use Medicaid LTSS initially as a cause of the transition. Institutional LTSS use was substantially lower among those on the Medicaid-to-Medicare pathway (4.4%); the majority of beneficiaries in this group utilizing LTSS used HCBS (12.5%).
| TABLE 3-5. Medicaid LTSS Use among Full-Dual Beneficiaries in the First Month of Transition to Full-Dual Status, by Temporal Pathway (2007-2010) | ||||||
|---|---|---|---|---|---|---|
| Medicare-to-Medicaid | Medicaid-to-Medicare | Simultaneous Eligibility | ||||
| # | % | # | % | # | % | |
| Total N (FFS Medicaid beneficiaries) | 1,992,682 | 100.00 | 631,969 | 100.00 | 144,593 | 100.00 |
| Medicaid utilization: | ||||||
| Any LTSS | 597,729 | 30.00 | 106,741 | 16.89 | 3,949 | 2.73 |
| Any Institutional LTSS | 438,380 | 22.00 | 27,520 | 4.35 | 2,190 | 1.51 |
| Any HCBS LTSS | 159,349 | 8.00 | 79,221 | 12.54 | 1,759 | 1.22 |
| SOURCE: RTI analysis of MMLEADS data. | ||||||
Table 3-6 shows that the "Other" Medicaid eligibility category had the highest percentage of beneficiaries with any LTSS use (45.2%), followed by the "Medically Needy" category (29.6%). The lowest percentage of beneficiaries using any LTSS was in the Section 1115 Waiver group (7.2%).
| TABLE 3-6. Medicaid LTSS Use among Full-Dual Beneficiaries in the First Month of Transition Of Full-Dual Status, by Medicaid Eligibility Pathway (2007-2010) | ||||||||||
|---|---|---|---|---|---|---|---|---|---|---|
| Low Income-- SSI-Cash | Medically Needy | Low Income-- Poverty | Other | Section 1115 Waiver | ||||||
| # | % | # | % | # | % | # | % | # | % | |
| Total N (FFS Medicaid beneficiaries) | 781,957 | 100.00 | 596,890 | 100.00 | 447,749 | 100.00 | 889,558 | 100.00 | 51,277 | 100.00 |
| Medicaid utilization: | ||||||||||
| Any LTSS | 85,916 | 10.99 | 176,578 | 29.58 | 39,708 | 8.87 | 402,339 | 45.23 | 3,685 | 7.19 |
| Any Institutional LTSS | 11,887 | 1.52 | 144,809 | 24.26 | 20,645 | 4.61 | 287,831 | 32.36 | 2,867 | 5.59 |
| Any HCBS LTSS | 74,029 | 9.47 | 31,769 | 5.32 | 19,063 | 4.26 | 114,508 | 12.87 | 818 | 1.60 |
| SOURCE: RTI analysis of MMLEADS data. NOTES: For beneficiaries with unknown or missing reason for Medicaid eligibility in the first month of transition to full-dual status, we looked forward up to 3 months to pick up Medicaid eligibility information, if available (given possible lags in the reporting of such information). | ||||||||||
Among all new full-dual beneficiaries (2007-2010) with Medicaid FFS eligibility, 25.6% used some form of Medicaid LTSS in the first month of transition to full-dual, as shown in Table 3-7. LTSS users accounted for approximately one-third (33.9%) of beneficiaries who were 65 years or older and one-eighth (12.5%) of those who were under 65 at the time of transition to full-dual. [These results addressed the first part of research question 3.]
| TABLE 3-7. Medicaid LTSS Use among Full-Dual Beneficiaries in the First Month of Transition to Full-Dual Status, by Age at Time of Transition (2007-2010) | ||||||
|---|---|---|---|---|---|---|
| Total | Age 65 | Age 65+ | ||||
| # | % | # | % | # | % | |
| Total N (FFS Medicaid beneficiaries) | 2,769,175 | 100.00 | 1,073,781 | 100.00 | 1,695,394 | 100.00 |
| Medicaid Utilization: | ||||||
| Any LTSS | 708,419 | 25.58 | 134,217 | 12.50 | 574,202 | 33.87 |
| Any Institutional LTSS | 468,088 | 16.90 | 44,075 | 4.10 | 424,013 | 25.01 |
| Any HCBS LTSS | 240,331 | 8.68 | 90,142 | 8.39 | 150,189 | 8.86 |
| SOURCE: RTI analysis of MMLEADS data. NOTE: Beneficiaries with missing age were not included in this table. | ||||||
Of all new full-dual beneficiaries who were Medicaid FFS eligible and who used Medicaid LTSS in the first month of transition to full-dual status (N=708,419), a total of 192,373 (or 27.2%) began Medicaid coverage when they were younger than 65 years old. [These numbers, not shown in any table, addressed research question 4.]
Among the subset of new full-dual beneficiaries who were using Medicaid LTSS as they entered full-dual status, shown in Table 3-8, the vast majority were 65 years of age or older at the time of transition to full-dual status (including 59.9% with institutional LTSS use and 21.2% with HCBS use). The majority of LTSS users in the Medicare-to-Medicaid pathway were those aged 65 or older who used institutional LTSS (69.0%), while in the Medicaid-to-Medicare pathway the greatest number of LTSS users were under 65 and using home and community-based LTSS (49.7%). [These results addressed the second part of research question 3.]
We also identified a subset of new full-duals who began a new spell of Medicaid LTSS use (either institutional or HCBS) at some point during 2007-2010 (N=1,233,932) to better understand to temporal relationship between LTSS use and transitioning to full-dual status. Of these new LTSS users, only about one-fifth (20.3%) began using LTSS prior to the month of initial transition to full-dual status, as shown in Table 3-9. Thus, the majority (79.7%) of these new LTSS users started using LTSS upon or after initial transition to full-dual status. Among new LTSS users who were under age 65 when they started LTSS use, about half (47.4%) began using LTSS prior to becoming full-duals. In contrast, among those who were 65 years or older when they started LTSS use, only 12.8% began using LTSS prior to becoming full-duals. [These results addressed research question 5.]
| TABLE 3-8. Medicaid LTSS Use among Full-Dual Beneficiaries in the First Month of Transition To Full-Dual Status, by Age and Temporal Pathway (2007-2010) | ||||||||
|---|---|---|---|---|---|---|---|---|
| Total | Medicare-to-Medicaid | Medicaid-to-Medicare | Simultaneous | |||||
| # | % | # | % | # | % | # | % | |
| Total N (Any LTSS) | 708,419 | 100.00 | 597,727 | 100.00 | 106,739 | 100.00 | 3,949 | 100.00 |
| Any Institutional LTSS | ||||||||
| Age 65 | 44,075 | 6.22 | 25,840 | 4.32 | 17,193 | 16.11 | 1,042 | 26.39 |
| Age 65+ | 424,013 | 59.85 | 412,538 | 69.02 | 10,327 | 9.68 | 1,148 | 29.07 |
| Any HCBS LTSS | ||||||||
| Age 65 | 90,142 | 12.72 | 36,275 | 6.07 | 52,993 | 49.65 | 871 | 22.06 |
| Age 65+ | 150,189 | 21.20 | 123,074 | 20.59 | 26,226 | 24.57 | 888 | 22.49 |
| SOURCE: RTI analysis of MMLEADS data. NOTE: Beneficiaries with missing age were not included in this table. | ||||||||
| TABLE 3-9. Full-Dual Beneficiaries with a New Spell of Medicaid LTSS Use, by Age and Full-Dual Status at the Onset of LTSS Use (2007-2010) | ||||||
|---|---|---|---|---|---|---|
| Age 65 when LTSS Use Began | Age 65+ when LTSS Use Began | Total | ||||
| # | % | # | % | # | % | |
| Total (N) | 265,658 | 100.00 | 968,274 | 100.00 | 1,233,932 | 100.00 |
| LTSS Use Began Prior to Transition to Full-Dual Eligibility | 125,884 | 47.39 | 124,214 | 12.83 | 250,098 | 20.27 |
| LTSS Use Began Upon or After Transition to Full-Dual Eligibility | 139,774 | 52.61 | 844,060 | 87.17 | 983,834 | 79.73 |
| SOURCE: RTI analysis of MMLEADS data. NOTE: Beneficiaries with missing age were not included in this table. | ||||||
3.7. Characteristics of Medicare-Only Beneficiaries Who Transitioned to Full-Dual Eligibility
Among the nearly 2.5 million new Medicare beneficiaries in the sample identified from 2006, 7.9% transitioned to full-dual status by the end of 2010 (Table 3-10). Beneficiaries who originally qualified for Medicare due to disability or ESRD were almost four times as likely to experience the transition as those who qualified for Medicare because of age (19.1% vs. 4.8%). Differences of a similar magnitude were observed between beneficiaries who were younger than 65 (17.5%) and those who were 65 or older (4.8%) at the start of Medicare initial coverage. This pattern is not surprising given that the original reason for Medicare entitlement is largely determined by age. Females were slightly more likely to become a full-dual than males (8.6% vs. 7.2%). Beneficiaries of racial/ethnic minority groups are significantly more likely than nonHispanic Whites to become full-duals: 16.8% of Blacks, 18.6% of Hispanics, and 20.2% of other/unidentified minority beneficiaries, as compared to only 5.0% of nonHispanic Whites.
| TABLE 3-10. Percentage of New Medicare Beneficiaries in 2006 Who Transitioned to Full-Dual Status by 2010 | ||
|---|---|---|
| N (beneficiaries) | Of N, % Transitioned to Full-Dual Status | |
| Total | 2,490,993 | 7.92 |
| Original reason for Medicare entitlement *** | ||
| Age | 1,948,978 | 4.83 |
| Disability/ESRD | 542,015 | 19.05 |
| Age at Medicare initial coverage start date *** | ||
| 65 | 605,548 | 17.53 |
| 65+ | 1,885,410 | 4.84 |
| Gender *** | ||
| Female | 1,276,129 | 8.62 |
| Male | 1,214,864 | 7.19 |
| Race/ethnicity *** | ||
| White, nonHispanic | 1,938,459 | 5.01 |
| Black | 238,313 | 16.78 |
| Hispanic | 200,199 | 18.57 |
| Other/unknown | 114,022 | 20.18 |
| SOURCE: RTI analysis of MMLEADS data. NOTES: Statistical significance in between-group differences (X2 test): *** p0.001. | ||
4. SUMMARY
Based on Medicare and Medicaid eligibility, enrollment, and claims in the MMLEADS dataset, this study identified a total of 3,881,656 individuals who newly became dually eligible beneficiaries with full Medicaid benefits during 2007-2010. Thus, almost one million people a year newly gain full-dual eligibility status. Of these new full-dual beneficiaries, 67.1% transitioned from Medicare to Medicaid, 27.2% from Medicaid to Medicare, and 4.9% became eligible for both programs simultaneously (we were unable to determine the temporal pathway for fewer than 1% of all new dual eligibles). There were major differences among individuals on these temporal pathways in terms of demographic characteristics, reasons for Medicaid and Medicare eligibility, and patterns of service utilization at the time of transition to full-dual status. Among individuals who followed the Medicare-to-Medicaid pathway, over two-thirds (68.0%) of people making the transition were 65 years or older at the time of transition to full-dual status. Accordingly, most of them (59.4%) originally qualified for Medicare due to age as opposed to disability or ESRD (40.6%). The Medicaid eligibility pathway varied for these individuals, with "Other" being the most frequent reason for eligibility (37.1%), followed by "Medically Needy" (22.4%), "Low Income--SSI-Cash" (20.1%), and "Low Income--Poverty" (15.8%). A substantial proportion of individuals on the Medicare-to-Medicaid pathway also used Medicare-covered services in the first month of transition to full-dual status: 13.7% had a hospitalization, 8.6% had an emergency department visit, and 17.0% used SNF services. In the same month, nearly 30.0% of individuals in this group received some form of Medicaid covered LTSS; among these LTSS users, the majority (nearly three-quarters) used institutional services instead of HCBS services.
In contrast, most individuals taking the Medicaid-to-Medicare pathway were under age 65 (69.1%) at the time of transition to full-dual status, and most of them originally qualified for Medicare eligibility because of disability or ESRD (68.1%) rather than age (31.9%). Among these individuals, the predominant reason for Medicaid eligibility was receipt of SSI-cash assistance (55.1%), followed by "Other" (15.2%), "Low Income--Poverty" (13.7%), and "Medically Needy" (10.3%). About 16.9% of individuals on the Medicaid-to-Medicare pathway had any Medicaid LTSS use in the first month of transition to full-dual status, which was notably lower as compared to those in the Medicare-to-Medicaid pathway (30.0%). Among those in the Medicaid-to-Medicare group who did use LTSS, however, the majority (about three-quarters) were HCBS users.
The differences in the pattern of Medicaid LTSS use among individuals on the Medicare-to-Medicaid pathway and those on the Medicaid-to-Medicare pathway is expected and consistent with known differences in the populations that follow these pathways. Most individuals in the Medicaid-to-Medicare group were younger adults (under 65) with disabilities, many of whom receive LTSS in home and community-based settings under a Medicaid waiver or a state plan. In contrast, most people in the Medicare-to-Medicaid group were older adults (age 65 and over) who typically receive Medicaid LTSS in institutions (mostly nursing facilities) despite increased use of HCBS in recent years.
The finding that many individuals fell into the "Other" Medicaid eligibility category, especially those who followed the Medicare-to-Medicaid pathway, suggests that there exist additional state-specific Medicaid eligibility criteria that shape these individuals' transition to full-dual status. We found the "Other" Medicaid eligibility category had the highest percentage of individuals with any Medicaid LTSS use in the first month of transition to full-dual status (45.2%; Table 3-6) and the highest number of chronic conditions (6.6 conditions per person, on average; Figure 3-4). Most individuals in this category were over 65 (Appendix Table A-3), and more than 70% became eligible for Medicare by virtue of age (calculated from Appendix Table A-2). Furthermore, among the 43 states and the District of Columbia that applied the special income rule for Medicaid eligibility determination during our study period, the average percentage of new full-duals in the "Other" category is 37%, compared with only 11% in the remaining states (calculations based on state-specific information not shown in this report). Taken together, these findings suggest that a substantial portion of the "Other" eligibility category comprises individuals who qualify for Medicaid due to the special income rule. The special income rule allows states to cover individuals who require at least 30 days of nursing home level care but have an income too high to qualify for Medicaid otherwise (Walker, 2010). The special income limits are typically up to 300% of the SSI, and states may also extend this eligibility to people who use HCBS waiver services as an alternative to institutionalization (MedPAC and MACPAC, 2017).
The prevalence of chronic conditions was generally lower among those in the Medicaid-to-Medicare pathway than those in the Medicare-to-Medicaid pathway. This is largely attributable to the younger age of individuals who make the transition from Medicaid to Medicare (the majority being under age 65), as compared to those on the Medicare-to-Medicaid pathway (the majority being 65 or older) at the time of transition to full-dual status. The prevalence of chronic conditions tends to increase with age.
Our results revealed racial/ethnic differences in the transition to full-dual eligibility. Among all new full-duals who followed the Medicaid-to-Medicare pathway, nearly half were racial/ethnic minorities; among those in the Medicare-to-Medicaid pathway, roughly one-third were racial/ethnic minorities. Among a cohort of new Medicare enrollees in 2006 who were not also Medicaid-eligible at the onset of Medicare coverage, the chances of transitioning to full-dual eligibility by 2010 were 3-4 times as high for individuals of racial/ethnic minority groups as those who were nonHispanic Whites.
5. LIMITATIONS AND FUTURE RESEARCH
The focus of the current study is on pathways of transition to dual eligibility. However, our exploratory analysis revealed a substantial level of "churn" in post-transition full-dual eligibility, with approximately 30% of beneficiaries experiencing some gaps in full-dual coverage in the subsequent 12 months. Anecdotal data suggest that some of these people may lose eligibility because of failure to provide the needed documentation rather than a change in financial or disability status. For dual eligible beneficiaries, the loss of full-benefit Medicaid coverage is of particular concern because most do not have an alternative source of health insurance for the services covered by full-benefit Medicaid (Riley, Zhao, & Tilahun, 2014). Without Medicaid support, many of these low income individuals may have difficulty paying for cost-sharing of Medicare services and may be unable to access services that are not covered by Medicare (such as LTSS). It is beyond the scope of this study to further explore possible causes for the volatility in full-dual coverage following the initial transition to full-dual status and the consequences of coverage gaps for beneficiaries in terms of access to care, qualify, and costs. These issues warrant additional research.
Due to limitations in the Medicare and Medicaid administrative data used in this study, we were unable to identify individuals with privately financed LTSS use prior to becoming eligible for Medicaid. Future research may consider using survey based data that capture all types of LTSS use, ideally also linked with Medicare or Medicaid claims data, for a more complete picture of individual circumstances and factors that precipitate the transition to dual eligibility.
In this study, we identified and reported Medicaid and Medicare utilization and spending on select services (limited to FFS beneficiaries of each program) during the first month of transition to full-dual status. Although we also conducted an exploratory analysis of service utilization and spending over several periods prior to the transition to full-dual status, that analysis (not presented here) is not the focus of this study. Additional insights can be gained in future research by comparing program utilization and spending patterns before and after the transition to full-dual eligibility.
In addition, due to the lack of information on utilization and program spending for individuals enrolled in managed care organizations, our utilization and spending measures are limited to FFS enrollees. However, we were able to identify their pathways to dual status using the enrollment and eligibility information. Future research should examine the patterns of service utilization and spending for beneficiaries in managed care given the rapid growth of this population. However, this entails the use of managed care encounter data, which are still under development.
6. CONCLUSION
Individuals who are dually eligible for Medicare and Medicaid represent a vulnerable segment of the population. They are low income, and many are elderly or disabled with complex care needs and high health care spending. Thus, the dually eligible population has been the focus of policy attention for decades and will remain so in the foreseeable future.
There are several different pathways to become dually eligible. In terms of temporal pathways, the majority (roughly three-quarters) of individuals who for the first time become dually eligible with full Medicaid benefits made the transition from Medicare to Medicaid; more than one-quarter transitioned from Medicaid to Medicare; and about one in 20 became eligible for both programs at the same time. The reason for Medicare eligibility is relatively stable and predictable because Medicare is a federal program with uniform eligibility rules and benefits. Generally, individuals qualify for Medicare on the basis of age (65 years or older) or disability. However, the pathway to Medicaid eligibility is more complex and varied, due to different eligibility rules and benefits across states. Broadly, individuals making the transition to full-dual status qualified for Medicaid by one of the following eligibility categories: Low Income--SSI-Cash, Low Income--Poverty, Medically Needy, Section 1115 Waiver, or Other (a residual category capturing individuals who meet state eligibility criteria based on special income rule or other requirements).
Given a long-standing interest in the issue of spenddown to Medicaid among older adults, the focus of policy attention has been on the Medicare-to-Medicaid transition, which is likely accompanied by the use of expensive uncovered medical care and LTSS. Among individuals making the Medicare-to-Medicaid transition, it is plausible that many in the "Medically Needy" or "Other" Medicaid eligibility category qualified for Medicaid as a result of spending down their incomes to the level of state Medicaid eligibility. Medicaid-to-Medicare is also an important pathway, whereby qualified low income or disabled individuals receive Medicaid covered services before they become Medicare eligible. Most individuals following this pathway were under age 65 or people who became dually eligible by aging into 65 rather than older people who spent down to Medicaid.
While Medicaid LTSS use certainly figures in the transition of many individuals to full-dual status, our results indicate that most people make the transition without using Medicaid LTSS. This suggests that they make the transition because they are older and poor (if on the Medicare-to-Medicaid pathway), or because they have attained Medicare eligibility upon turning 65 or have been on SSDI for 24 months (if on the Medicaid-to-Medicare pathway).
This study shows that reasons for Medicaid and Medicare eligibility, demographic characteristics, presence of chronic conditions, and service utilization at the time of initial transition to full-dual status vary by pathway, suggesting that different subgroups of dually eligible beneficiaries may have different care needs. In particular, a substantial portion of the people transitioning to full-dual status have severe mental illness, Alzheimer's disease or related dementias. Individuals with these conditions tend to have more complex care needs and higher health care spending than people without these conditions. In addition, a disproportionate number of people transitioning to dual status are racial/ethnic minorities. The findings from this study can inform policy efforts to support individuals at risk of becoming dually eligible and address their care needs both during and after the transition to full-dual status.
REFERENCES
Bubolz, T., Emerson, C., & Skinner, J. (2012). State spending on dual eligibles under age 65 shows variations, evidence of cost shifting from Medicaid to Medicare. Health Affairs, 31(5), 939-947.
Buccaneer, Systems and Service, Inc. (2015). Medicare-Medicaid Linked Enrollee Analytic Data Source (MMLEADS Version 2.0): User Guide. Available at: https://www.ccwdata.org/cs/groups/public/documents/training/mmleads_ext….
Irvin, C., Borck, R., & Lim, W. (2013). New Medicare-Medicaid Enrollees: The Transition to Medicaid Coverage Among Medicare Beneficiaries. Paper presented at the Center for Excellence on Disability Research, National Conference.
Kaiser Family Foundation. (2014). Section 1915(i) Home and Community-Based Services State Plan Option. Available at: http://kff.org/medicaid/state-indicator/section-1915i-home-and-community-based-services-state-plan-option/#notes.
Medicare-Medicaid Coordination Office. (2016). Data Analysis Brief: Medicare-Medicaid Dual Eligible Enrollment from 2006 through 2015. Available at: https://www.cms.gov/Medicare-Medicaid-Coordination/Medicare-and-Medicaid-Coordination/Medicare-Medicaid-Coordination-Office/Downloads/DualEnrollment_2006-2015.pdf.
Medicare Payment Advisory Commission (MedPAC) and the Medicaid and CHIP Payment and Access Commission (MACPAC). (2017). Data Book: Beneficiaries Dually Eligible for Medicare and Medicaid. Available at: http://www.medpac.gov/docs/default-source/publications/jan17_medpac_mac….
Riley, G.F., Zhao, L., & Tilahun, N. (2014). Understanding factors associated with loss of Medicaid coverage among dual eligibles can help identify vulnerable enrollees.Health Affairs, 33(1), 147-152.
Social Security Administration (SSA). (2016). SI 01715.020 List of State Medicaid Programs for the Aged, Blind and Disabled. Available at: https://secure.ssa.gov/apps10/poms.nsf/lnx/0501715020.
Walker, L., & Accius, J. (2010). Access to Long-Term Services and Supports: A 50-state Survey of Medicaid Financial Eligibility Standards. Washington DC: AARP. Available at:http://assets.aarp.org/rgcenter/ppi/ltc/i44-access-ltss_revised.pdf.
Watts, M.O., Cornachione, E., & Musumeci, M. (2016). Medicaid Financial Eligibility for Seniors and People with Disabilities in 2015. Kaiser Family Foundation. Available at: http://files.kff.org/attachment/report-medicaid-financial-eligibility-for-seniors-and-people-with-disabilities-in-2015.
Woodcock, C., Cannon-Jones, S., Tripp, A., & Holt, B. (2011). Pathways to Medicare-Medicaid Eligibility: A Literature Review. Baltimore, MD: Hilltop Institute, UMBC.
Young, K., Garfield, R., Musumeci, M., Clemans-Cope, L., and Lawton, E. (2013). Medicaid's Role for Dual Eligible Beneficiaries. Kaiser Family Foundation. Available at: http://kff.org/medicaid/issue-brief/medicaids-role-for-dual-eligible-beneficiaries/.
APPENDIX A. ADDITIONAL DATA
| FIGURE A-1. Graphic Illustration of Temporal Pathways to Full-Dual Eligible Status |
|---|
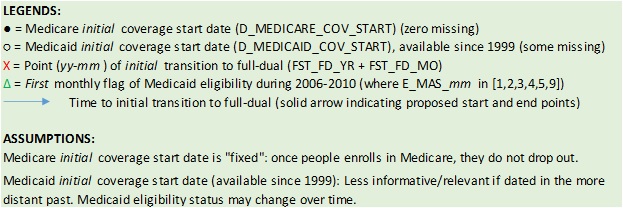 |
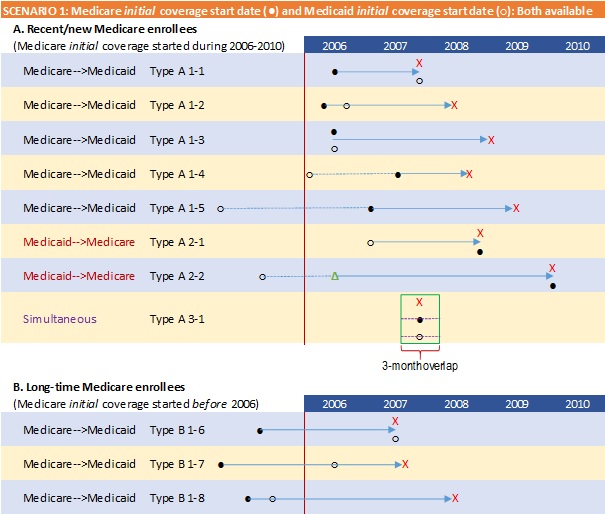 |
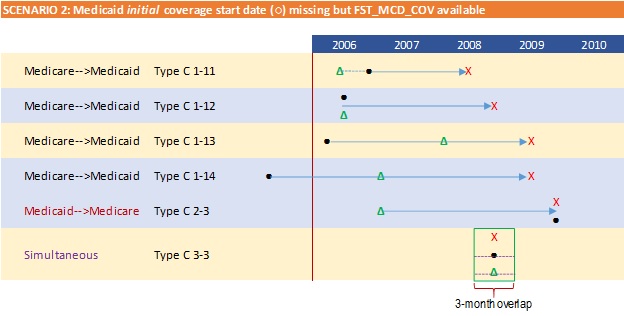 |
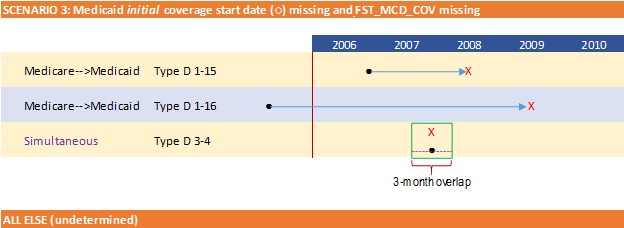 |
| SOURCE: RTI analysis of MMLEADS data. |
| TABLE A-1. List of Select MMLEADS Variables Utilized in Analysis | |||
|---|---|---|---|
| Category | Variables Name | Description | Purpose |
| Eligibility | e_DUAL_1 - e_DUAL_12 | Monthly dual status indicator (source: MMA) | Identify full-dual |
| e_MAX_DUAL_1 - e_MAX_DUAL_12 | Monthly Code indicating if Medicaid enrollee is covered by Medicare (source: MSIS) | ||
| e_MME_TYPE_1 - e_MME_TYPE_12 | Monthly dual flags using e_DUAL_1 - e_DUAL_12 | ||
| e_CREC | Medicare Current reason for eligibility | Identify/ approximate pathways to full-dual | |
| e_OREC | Original Medicare reason for eligibility | ||
| e_MAS1 - e_MAS12 | Monthly Medicaid Maintenance Assistance Status (position one of MAX uniform eligibility code) | ||
| e_BOE1 - e_BOE12 | Monthly Medicaid Basis of Eligibility (position 2 of MAX uniform eligibility code) | ||
| e_Waiver1_01 - e_Waiver1_12 | Monthly Medicaid Waiver Status (source: Monthly Waiver Indicator from the MAX PS file) | Determine Medicaid waiver participation status | |
| e_Waiver2_01 - e_Waiver2_12 | |||
| e_Waiver3_01 - e_Waiver3_12 | |||
| Demographics | d_DOD | Beneficiary date of death | Describe beneficiary demographic characteristics at the time of transition to full-dual |
| d_DOB | Beneficiary date of birth | ||
| d_AGE | Age at the end of the year | ||
| d_GENDER | Gender | ||
| d_Medicare_RACE | Medicare RTI Race code | ||
| d_Medicaid_Race | Medicaid-Eligible Race/Ethnicity code | ||
| d_Medicare_COV_START | Medicare Coverage Start Date (First occurrence of Medicare A/B coverage based on Medicare enrollment) | Determine temporal sequence of transition to full-dual | |
| d_Medicaid_COV_START | Medicaid Coverage Start Date (First occurrence of Medicaid coverage, since 1999) (source: MAX uniform eligibility code) | ||
| Long Term Services & Support (LTSS) | LTSS_DTL1 - LTSS_DTL12 | Monthly indicator on LTSS use, by type (Nursing Facility Institutional; Other Institutional; Waiver Community; Home Health and Personal Care Community) | Determine LTC use around transition to full-dual |
| Chronic Conditions (total 27 available) | ALZ_COMBINED ALZRDSD_COMBINED ... (Other variable names: omitted) | Select CCW conditions (Alzheimer's disease or related dementia, COPD, diabetes, heart failure, stroke, etc.) and additional conditions on mental health (Schizophrenia, bipolar disorder, etc.) and mental disability (intellectual disabilities & related conditions, learning disabilities & other developmental delays, etc.), identified from combined Medicare & Medicaid claims | Describe beneficiary health status and comorbidities around transition to full-dual (use select discrete conditions) |
| Physical and Mental Disability Conditions (total 24 available) | CERPAL_COMBINED | Cerebral Palsy | Calculate number of physical and mental disability conditions per person around transition to full-dual |
| CYSFIB_COMBINED | Cystic Fibrosis and Other Metabolic Developmental Disorders | ||
| EPILEP_COMBINED | Epilepsy | ||
| INTDIS_COMBINED | Intellectual Disabilities and Related Conditions | ||
| LEADIS_COMBINED | Learning Disabilities and Other Developmental Delays | ||
| MOBIMP_COMBINED | Mobility Impairments | ||
| MULSCL_COMBINED | Multiple Sclerosis and Transverse Myelitis | ||
| MUSDYS_COMBINED | Muscular Dystrophy | ||
| HEARIMP_COMBINED | Sensory--Deafness and Hearing Impairment | ||
| VISUAL_COMBINED | Sensory--Blindness and Visual Impairment | ||
| SPIBIF_COMBINED | Spina Bifida and Other Congenital Anomalies of the Nervous System | ||
| SPIINJ_COMBINED | Spinal Cord Injury | ||
| BRAINJ_COMBINED | Traumatic Brain Injury and Nonpsychotic Mental Disorders due to Brain Damage | ||
| OTHDEL_COMBINED | Other Developmental Delays | ||
| (Additional variables: omitted) | |||
| FFS/Managed Care Status | e_MedicareFFS1 - e_MedicareFFS12 | Monthly Medicare FFS vs. HMO Indicator | Potential criteria for sample exclusions |
| e_MedicaidFFS1 - e_MedicaidFFS12 | Monthly Medicaid FFS vs. managed care indicator | ||
| Medicaid Utilization | u_Medicaid_DRUG_RX_FFS1 - u_Medicaid_DRUG_RX_FFS12 | Monthly # Medicaid Prescriptions | Describe patterns of use of Medicaid covered services surrounding the transition to full-dual |
| u_Medicaid_NURS_FAC_FFS1 - u_Mediciad_NURS_FAC_FFS12 | Monthly # Medicaid Nursing Facility claims | ||
| u_Medicaid_HH_VST_FFS1 - u_Medicaid_HH_VST_FFS12 | Monthly # Medicaid Home Health visits | ||
| u_Medicaid_PCS_VST_FFS1 - u_Medicaid_PCS_VSTFFS12 | Monthly # Medicaid Personal Care Services visits | ||
| u_Medicaid_IP_DAYS_FFS1 - u_Medicaid_IP_DAYS_FFS12 | Monthly # Medicaid Inpatient Days | ||
| u_Medicaid_IER_VST_1 - u_Medicaid_IER_VST_12 | Monthly # Medicaid Inpatient ER visits | ||
| u_Medicaid_OER_VST_1 - u_Medicaid_OER_VST_12 | Monthly # Medicaid Hospital Outpatient ER visits | ||
| Total Medicaid Spending | s_Medicaid_PMT_1 - s_Medicaid_PMT_12 | Monthly (based on ending date of service) Medicaid MC and FFS payments | Determine Medicaid spending around transition to full-dual |
| Medicare Utilization | u_Medicare_IER_CNT_1 - u_Medicare_IER_CNT_12 | Monthly # Medicare Inpatient ER visits | Describe patterns of use of Medicare-covered services surrounding the transition to full-dual |
| u_Medicare_OER_CNT_1 - u_Medicare_OER_CNT_12 | Monthly # Medicare Hospital Outpatient ER visits | ||
| u_Medicare_HH_VST_CNT_1 - u_Medicare_HH_VST_CNT_12 | Monthly # Medicare Home Health visits | ||
| u_IP_ACUTE_DAY_cnt_1 - u_IP_ACUTE_DAY_cnt_12 | Monthly # Medicare Acute Inpatient covered days | ||
| u_SNF_DAY_cnt_1 - u_SNF_DAY_cnt_12 | Monthly # Medicare Skilled Nursing Facility covered days | ||
| u_PAC_OTH_DAY_cnt_1 - u_PAC_OTH_DAY_cnt_12 | Monthly # Medicare Post-Acute Care covered days | ||
| u_HOSPICE_DAY_cnt_1 - u_HOSPICE_DAY_cnt_12 | Monthly # Medicare Hospice covered days | ||
| u_HOP_VST_1 - u_HOP_VST_12 | Monthly # Medicare Hospital Outpatient visits | ||
| u_PHYS_VST_1 - u_PHYS_VST_12 | Monthly # Medicare Physician claims | ||
| u_DME_VST_1 - u_DME_VST_12 | Monthly # Medicare DME claims | ||
| u_DRUG_PTD_1 - u_DRUG_PTD_12 | Monthly # Medicare Prescriptions | ||
| Total Medicare Spending | s_Medicare_PMT_1 - s_Medicare_PMT_12 | Monthly (based on claim through date) Medicare FFS payments | Determine Medicare spending around transition to full-dual |
| SOURCE: ResDAC. http://www.resdac.org/cms-data/files/mmleads. | |||
| TABLE A-2. Medicaid Eligibility Pathway to Full Dual Status, by Current Reason for Medicare Eligibility (2007-2010) | ||||||||||||
|---|---|---|---|---|---|---|---|---|---|---|---|---|
| Total | Low Income-- SSI-Cash | Low Income-- Poverty | Medically Needy | Other | Section 1115 Waiver | |||||||
| # | % | # | % | # | % | # | % | # | % | # | % | |
| Total | 3,748,906 | 100 | 1,198,541 | 31.97 | 593,733 | 15.84 | 720,602 | 19.22 | 1,147,902 | 30.62 | 88,128 | 2.35 |
| Current reason for Medicare eligibility: | ||||||||||||
| OASI | 2,185,096 | 100 | 506,069 | 23.16 | 318,581 | 14.58 | 508,273 | 23.26 | 821,819 | 37.61 | 30,354 | 1.39 |
| DI | 1,487,914 | 100 | 653,010 | 43.89 | 266,631 | 17.92 | 200,461 | 13.47 | 312,375 | 20.99 | 55,437 | 3.73 |
| ESRD | 55,875 | 100 | 34,643 | 62.00 | 4,776 | 8.55 | 7,058 | 12.63 | 7,653 | 13.70 | 1,745 | 3.12 |
| DI and ESRD | 20,021 | 100 | 4,819 | 24.07 | 3,745 | 18.71 | 4,810 | 24.02 | 6,055 | 30.24 | 592 | 2.96 |
| SOURCE: RTI analysis of MMLEADS data. NOTES: For beneficiaries with unknown or missing reason for Medicaid eligibility in the first month of transition to full-dual status, we looked forward up to 3 months to pick up Medicaid eligibility information, if available (given possible lags in the reporting of such information). Those with missing or unknown Medicaid eligibility are not shown in table. | ||||||||||||
| TABLE A-3. Select Characteristics of Full-Dual Beneficiaries at Time of Transition to Full-Dual Status, by Medicaid Eligibility Pathway (2007-2010) | ||||||||||
|---|---|---|---|---|---|---|---|---|---|---|
| Low Income-- SSI-Cash | Low Income-- Poverty | Medically Needy | Other | Section 1115 Waiver | ||||||
| # | % | # | % | # | % | # | % | # | % | |
| Beneficiaries (N) | 1,198,541 | 100 | 593,733 | 100 | 720,602 | 100 | 1,147,902 | 100 | 88,128 | 100 |
| Age: | ||||||||||
| 65 | 701,512 | 58.53 | 277,548 | 46.75 | 213,038 | 29.56 | 326,949 | 28.48 | 58,903 | 66.84 |
| 65 | 278,891 | 23.27 | 79,348 | 13.36 | 67,744 | 9.40 | 65,274 | 5.69 | 12,560 | 14.25 |
| >65 | 218,013 | 18.19 | 236,823 | 39.89 | 439,816 | 61.03 | 755,666 | 65.83 | 16,663 | 18.91 |
| Sex: | ||||||||||
| Male | 503,393 | 42.00 | 240,343 | 40.48 | 306,146 | 42.48 | 426,695 | 37.17 | 40,812 | 46.31 |
| Female | 695,123 | 58.00 | 353,389 | 59.52 | 414,454 | 57.52 | 721,207 | 62.83 | 47,316 | 53.69 |
| Race & ethnicity: | ||||||||||
| White, nonHispanic | 555,231 | 46.33 | 352,028 | 59.29 | 457,207 | 63.45 | 882,332 | 76.86 | 47,432 | 53.82 |
| Black | 280,346 | 23.39 | 119,519 | 20.13 | 109,678 | 15.22 | 164,948 | 14.37 | 16,641 | 18.88 |
| Hispanic | 238,211 | 19.88 | 80,878 | 13.62 | 95,413 | 13.24 | 66,422 | 5.79 | 18,455 | 20.94 |
| Asian/Pacific Islander | 86,641 | 7.23 | 27,059 | 4.56 | 44,668 | 6.20 | 17,738 | 1.55 | 2,850 | 3.23 |
| American Indian/Alaska Native | 14,603 | 1.22 | 5,474 | 0.92 | 2,996 | 0.42 | 6,912 | 0.60 | 1,039 | 1.18 |
| Other/Unknown | 23,509 | 1.96 | 8,775 | 1.48 | 10,640 | 1.48 | 9,550 | 0.83 | 1,711 | 1.94 |
| Ever had the following chronic condition: | ||||||||||
| Alzheimer's or related dementia | 41,900 | 3.50 | 49,793 | 8.39 | 189,779 | 26.34 | 425,466 | 37.06 | 4,563 | 5.18 |
| COPD | 160,266 | 13.37 | 105,444 | 17.76 | 172,404 | 23.92 | 360,070 | 31.37 | 10,050 | 11.40 |
| Diabetes | 264,840 | 22.10 | 148,695 | 25.04 | 236,007 | 32.75 | 412,400 | 35.93 | 18,378 | 20.85 |
| Heart failure | 135,627 | 11.32 | 100,831 | 16.98 | 216,718 | 30.07 | 423,866 | 36.93 | 10,180 | 11.55 |
| Stroke | 58,498 | 4.88 | 51,403 | 8.66 | 125,766 | 17.45 | 269,549 | 23.48 | 4,848 | 5.50 |
| Hypertension | 482,154 | 40.23 | 287,440 | 48.41 | 456,907 | 63.41 | 807,516 | 70.35 | 34,848 | 39.54 |
| Depression | 315,282 | 26.31 | 162,779 | 27.42 | 243,662 | 33.81 | 493,650 | 43.00 | 24,247 | 27.51 |
| Cancera | 39,953 | 3.33 | 41,023 | 6.91 | 76,967 | 10.68 | 133,831 | 11.66 | 3,984 | 4.52 |
| Serious mental illnessb | 347,967 | 29.03 | 154,177 | 25.97 | 235,817 | 32.72 | 476,323 | 41.50 | 25,287 | 28.69 |
| Mobility impairment | 32,215 | 2.69 | 22,455 | 3.78 | 57,631 | 8.00 | 127,715 | 11.13 | 2,216 | 2.51 |
| Intellectual disabilities and related conditions | 47,336 | 3.95 | 7,099 | 1.20 | 7,304 | 1.01 | 30,013 | 2.61 | 535 | 0.61 |
| Count of CCW chronic conditions (range 0-26),c Mean (SD) | 2.67 | (2.90) | 3.57 | (3.62) | 5.46 | (4.39) | 6.56 | (4.48) | 2.72 | (3.05) |
| Count of conditions related to intellec-tual, developmental and physical disability (range 0-14),d Mean (SD) | 0.18 | (0.52) | 0.15 | (0.44) | 0.25 | (0.57) | 0.35 | (0.65) | 0.11 | (0.38) |
| SOURCE: RTI analysis of MMLEADS data. NOTES: For beneficiaries with unknown or missing reason for Medicaid eligibility in the first month of transition to full-dual status, we looked forward up to 3 months to pick up Medicaid eligibility information, if available (given possible lags in the reporting of such information).
| ||||||||||
| TABLE A-4. Medicaid/Medicare Utilization and Spending for Full-Dual Beneficiaries in the First Month of Transition to Full-Dual Status, by Medicaid Eligibility Pathway (2007-2010) | ||||||||||
|---|---|---|---|---|---|---|---|---|---|---|
| Low Income-- SSI-Cash | Low Income-- Poverty | Medically Needy | Other | Section 1115 Waiver | ||||||
| # | % | # | % | # | % | # | % | # | % | |
| Total N (FFS Medicaid beneficiaries) | 781,957 | 100.00 | 447,749 | 100.00 | 596,890 | 100.00 | 889,558 | 100.00 | 51,277 | 100.00 |
| Medicaid utilization (any use of each): | ||||||||||
| Nursing facility | 9,985 | 1.28 | 20,991 | 4.69 | 143,572 | 24.05 | 285,161 | 32.06 | 2,847 | 5.55 |
| Home health | 11,022 | 1.41 | 2,644 | 0.59 | 10,869 | 1.82 | 12,001 | 1.35 | 428 | 0.83 |
| Personal care services | 45,478 | 5.82 | 11,786 | 2.63 | 17,389 | 2.91 | 19,403 | 2.18 | 175 | 0.34 |
| Hospital inpatient stay | 17,129 | 2.19 | 14,195 | 3.17 | 23,283 | 3.90 | 23,785 | 2.67 | 1,483 | 2.89 |
| ED visit | 14,067 | 1.80 | 6,069 | 1.36 | 5,523 | 0.93 | 7,286 | 0.82 | 532 | 1.04 |
| Prescriptions | 277,624 | 35.50 | 62,167 | 13.88 | 114,415 | 19.17 | 216,086 | 24.29 | 15,682 | 30.58 |
| Medicaid spending (dollars), Mean (SD) | ||||||||||
| Total Medicaid program spendinga | 693 | (2,968) | 422 | (6,377) | 1,205 | (3,467) | 1,404 | (2,692) | 586 | (2,119) |
| Total Medicaid beneficiary cost-sharingb | 77 | (907) | 94 | (672) | 118 | (759) | 109 | (1,071) | 72 | (580) |
| Total N (FFS Medicare beneficiaries) | 914,320 | 100.00 | 449,472 | 100.00 | 504,854 | 100.00 | 887,547 | 100.00 | 61,783 | 100.00 |
| Medicare utilization (any use of each): | ||||||||||
| SNF | 4,279 | 0.47 | 21,364 | 4.75 | 79,351 | 15.72 | 206,774 | 23.30 | 1,429 | 2.31 |
| Home health | 5,254 | 0.57 | 9,018 | 2.01 | 15,985 | 3.17 | 49,645 | 5.59 | 607 | 0.98 |
| Hospice | 1,790 | 0.20 | 3,914 | 0.87 | 9,343 | 1.85 | 35,324 | 3.98 | 360 | 0.58 |
| Hospital inpatient stay | 26,854 | 2.94 | 36,697 | 8.16 | 73,975 | 14.65 | 140,863 | 15.87 | 3,025 | 4.90 |
| ED visit | 59,607 | 6.52 | 34,246 | 7.62 | 42,734 | 8.46 | 83,785 | 9.44 | 3,663 | 5.93 |
| Physician services | 310,768 | 33.99 | 219,720 | 48.88 | 322,635 | 63.91 | 600,218 | 67.63 | 23,394 | 37.86 |
| Durable medical equipment | 42,288 | 4.63 | 44,274 | 9.85 | 62,454 | 12.37 | 133,393 | 15.03 | 2,951 | 4.78 |
| Prescriptions | 352,931 | 38.60 | 217,721 | 48.44 | 234,651 | 46.48 | 461,928 | 52.05 | 20,584 | 33.32 |
| Medicare spending (dollars), Mean (SD) | ||||||||||
| Total Medicare program spendingc | 869 | (3,804) | 2,122 | (6,763) | 4,351 | (10,360) | 4,884 | (9,553) | 1,378 | (5,357) |
| Total Medicare beneficiary cost-sharingd | 160 | (459) | 314 | (758) | 666 | (1,285) | 740 | (1,325) | 229 | (700) |
| SOURCE: RTI analysis of MMLEADS data. NOTES: For beneficiaries with unknown or missing reason for Medicaid eligibility in the first month of transition to full-dual status, we looked forward up to 3 months to pick up Medicaid eligibility information, if available (given possible lags in the reporting of such information).
| ||||||||||
Analysis of Pathways to Dual Eligible Status
This report was prepared under contract #HHSP23320100021WI between the U.S. Department of Health and Human Services (HHS), Office of Disability, Aging and Long-Term Care Policy (DALTCP) and the Research Triangle Institute. For additional information about this subject, you can visit the DALTCP home page at http://aspe.hhs.gov/office-disability-aging-and-long-term-care-policy-daltcp or contact the ASPE Project Officer, Jhamirah Howard, at HHS/ASPE/DALTCP, Room 424E, H.H. Humphrey Building, 200 Independence Avenue, S.W., Washington, D.C. 20201; Jhamirah.Howard@hhs.gov.
Reports Available
Loss of Medicare-Medicaid Dual Eligible Status: Frequency, Contributing Factors and Implications
- HTML: https://aspe.hhs.gov/basic-report/loss-medicare-medicaid-dual-eligible-status-frequency-contributing-factors-and-implications
- PDF: https://aspe.hhs.gov/pdf-report/loss-medicare-medicaid-dual-eligible-status-frequency-contributing-factors-and-implications
Analysis of Pathways to Dual Eligible Status: Final Report