
U.S. Department of Health and Human Services
A Systematic Comparison of Community Care Demonstrations
Peter Kemper, National Center for Health Services Research
Robert Applebaum, Miami University
Margaret Harrigan, Wisconsin Legislative Fiscal Bureau
June 1987
This report was prepared under contract between HHSs Office of Social Services Policy (now the Office of Disability, Aging and Long-Term Care Policy) and the University of Wicsonin. For additional information about this subject, you can visit the DALTCP home page at http://aspe.hhs.gov/_/office_specific/daltcp.cfm or contact the office at HHS/ASPE/DALTCP, Room 424E, H.H. Humphrey Building, 200 Independence Avenue, S.W., Washington, D.C. 20201. The e-mail address is: webmaster.DALTCP@hhs.gov.
This research was begun under the small grants program sponsored by the Institute for Research on Poverty at the University of Wisconsin, Madison, and the U.S. Department of Health and Human Services. It builds on work done as part of the Channeling evaluation under contract number HHS-100-80-0157. The views are those of the authors, not the Institute or the Department.
TABLE OF CONTENTS
- B. THE INTERVENTIONS TESTED
- 1. Case Management and Expanded Community Services
- 2. Populations
- C. EVALUATION DESIGNS
- 1. Comparison Methodologies
- 2. Sample Size
- 3. Number of Replications and Service Environments
- 4. Data Collection
- D. RESULTS
- 1. Nursing Home Use
- 2. Hospital Use
- 3. Costs
- 4. Substitution of Formal for Informal Care
- 5. Quality of Life
- E. CONCLUSION
- 1. The Basic Findings
- 2. Cost Reductions through Improved Targeting?
- 3. Implications for the Policy Debate and Research
- LIST OF FIGURES AND TABLES
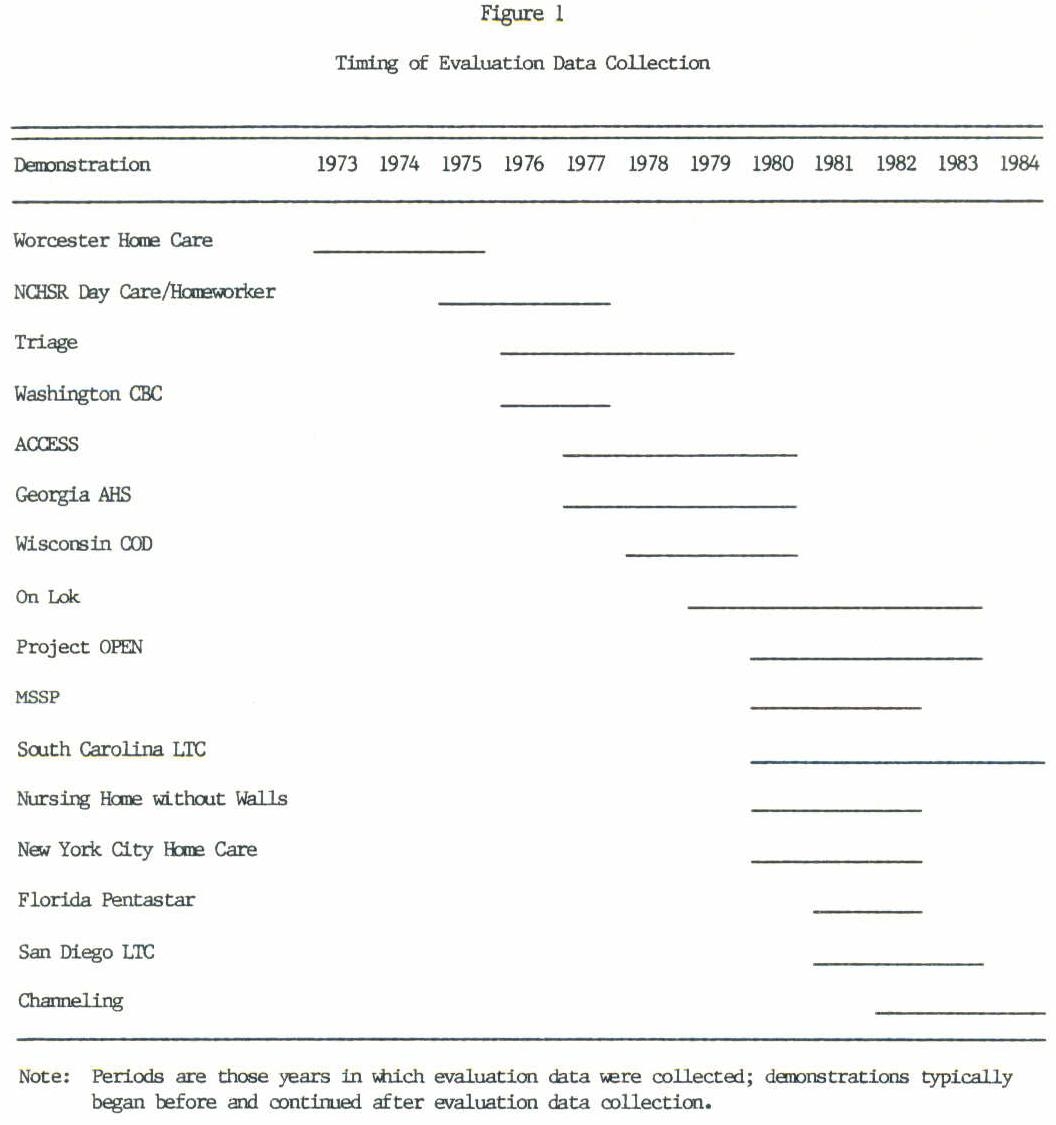
- FIGURE 1: Timing of Evaluation Data Collection
- TABLE 1: Client Disability at Enrollment
- TABLE 2: Evaluation Methodologies
- TABLE 3: Nursing Home Days during the First Year
- TABLE 4: Hospital Use during the First Year
- TABLE 5: Monthly Costs
- TABLE 6: Mortality Rates after One Year
- TABLE A.1: Service Coverage Expanded under Demonstration Waivers
- TABLE A.2: Service Authorization Power, Cost Controls, and Expenditures
- TABLE A.3: Eligibility Criteria
- TABLE A.4: Data Collection
- TABLE A.5: Differences in Effects on Nursing Home Use across Population Subgroups
- TABLE A.6: Monthly Costs, by Type of Service and Payor
- TABLE A.7: Informal Caregiving
- TABLE A.8: Satisfaction with Arrangements for Service after One Year
- TABLE A.9: Unmet Service Needs after One Year
- TABLE A.10: Problems with Physical Environment after One Year
- TABLE A.11: Social Activities after One Year
- TABLE A.12: Self-rated Health after One Year
- TABLE A.13: Disability in Activities of Daily Living after One Year
- TABLE A.14: Life Satisfaction/Morale after One Year
ABSTRACT
Concern about inappropriate nursing home placement and rising long-term care costs led to a series of government-financed demonstrations to study whether substituting care at home for care in nursing homes could reduce costs and improve the quality of life for the frail elderly. Based on the evaluations of these demonstrations, we conclude that expanding public financing of community services beyond what already exists under the current system does not reduce costs. Small nursing home cost reductions are more than offset by increased costs of providing expanded community services to those who would not enter nursing homes even without the expanded services. Although they do not reduce costs, expanded community services appear to make people better off. Moreover, the expanded services do not appear to cause substantial reductions in care by family and friends. The research and policy debate should move beyond the question of whether expanded public financing of community care will reduce costs to the problems of how much community care society is willing to pay for, who should receive it, and how it can be delivered efficiently.
ACKNOWLEDGMENT
The authors are grateful to Don Blackman, John Capitman, Donald Goldstone, Vernon Greene, Mary Harahan, Rosalie Kane, Leslie Saber, and Bill Saunders for their helpful comments on an earlier version of this paper.
INTRODUCTION
The aging of the U.S. population has increased the demand for formal long-term care services; associated with that demand are increases in public and private costs. The existing formal long-term care system, it has been argued, favors nursing home over community care for two reasons. First, the broad range of personal care, housekeeping, meals, transportation, and other services needed by an impaired person to live in the community are difficult to identify and coordinate, leading to unnecessary decisions to enter nursing homes. Second, for individuals with chronic care needs, public programs pay for nursing home care but typically do not pay for long-term care such as personal care and homemakers in the community (Morris 1971; Congressional Budget Office 1977; Mechanic 1979; Kane and Kane 1980). These arguments led to a series of demonstrations of expanded government financing for case management and community services, beginning in the 1970s. This paper reviews the results of these demonstrations--their effects on nursing home use, public and private costs and the quality of clients' lives--and assesses the implications of the results.
Although the question of the substitution of community care for nursing home care is currently receiving considerable attention, this issue is not new. Framers of the English Poor Law in 1601, the first major codification of Anglo-American social welfare laws, allowed for both indoor relief (within the almshouse) and outdoor relief (in one's home) (Woodroofe 1971). In 1821 Josiah Quincy's "Report to the Committee Who Was Referred in Consideration of the Pauper Laws of this Commonwealth" compared care in the almshouse to care in one's home (Quincy 1852). He found that only those desperately in need of care chose the almshouse, because of poor conditions there. He recommended that the government finance only care in the almshouse--reasoning that total public costs would be lower because, given the poor conditions, fewer people would use this form of relief.
A. EVOLUTION OF RESEARCH ON COMMUNITY CARE
Research on community care has had two strands. The first analyzed the substitution of visiting nurses for acute care in hospitals. The second analyzed the substitution of a broader range of community care, including personal care and homemaking services, for chronic care in nursing homes.
Research focused first on hospital care. The hypothesis was that by having nursing care at home, patients could leave the hospital sooner. The cost savings from the reduced length of hospital stays would more than offset the costs of the visiting nurses. Two methodologies were used to test this hypothesis. First, the hypothetical cost of nursing care at home was compared to the cost of hospital care. Studies ranged from those based on physicians' judgments about the number of hospital days that might be saved if visiting nursing care were available for a sample of their patients (e.g., Scutchfield and Freeborn 1971) to those based on retrospective matching of patients who received home health care with those who received hospital care (e.g., Bryant, Candland, and Lowenstein 1974). Second, a series of randomized experiments assigned hospital patients to two groups, one with home health care available after the hospitalization and the other without (e.g., Bakst and Marra 1955; Katz et al,1968; Stone, Patterson, and Felson 1968; Gerson and Collins 1976). There were many studies of both types, and they generally concluded that the total costs of acute care could be reduced by expanding home health benefits. (See Hammond 1979 and Hedrick and Inui 1986 for reviews of the literature.)
Gradually the focus of attention shifted to the question of whether home care (including nonmedical services such as personal care and homemakers as well as nursing) substitutes for nursing home care. The distinction between home health care as a substitute for hospital care and home care as a substitute for nursing home care was not clearly drawn, perhaps because of the inherent substitutability of care at home for both hospital and nursing home care. Nonetheless, the framework that implicitly lay behind the studies of nursing homes differed from that of the hospital studies. The nursing home studies asked whether long-term care for chronic disabilities would be less costly if the disabled person received care at home rather than moving permanently to a nursing home. The hypothesis was that costs at home would be below nursing home costs for those with low levels of disability because they do not need the level of care provided in nursing homes. As the patient's level of disability increases, the cost of care in the community increases up to a break-even point, beyond which community care costs more than nursing home care. Pollak (1973) formalized this framework, which was implicit in many of the studies.
Studies of community care as a substitute for nursing home care used both hypothetical cost comparison and experimental methodologies. Among the hypothetical comparisons, Bell (1973), Greenberg (1974), Rathbone-McCuan and Lohn (1975), Brickner and Scharer (1977), General Accounting Office (1977), Piland (1978), and Arkansas Office on Aging (1981) compared the cost of home care for a sample of impaired clients in the community to what the cost would have been in a nursing home. Anderson, Patten, and Greenberg (1980) compared actual costs for a sample of nursing home patients to actual costs for a sample in the community with similar levels of disability. The results of these hypothetical cost comparisons were consistent with expectations: Community care was less costly than nursing home care, except for those with very high levels of disability.1
The hypothetical cost comparisons demonstrated that many impaired elders, including some who reside in nursing homes, can be cared for in the community at lower cost than in a nursing home. Such comparisons together with research suggesting that from 10 to 40 percent of those in nursing homes were inappropriately placed there (Morris 1971, Williams et al. 1973, Congressional Budget Office 1977, General Accounting Office 1979) -- served as the basis for the argument that public financing of community care should be expanded to reduce unnecessary nursing home use and thereby reduce public costs and improve the quality of clients' lives.
That community care is less costly than nursing home care for many individuals does not, however, necessarily imply that expanded financing of community care will reduce aggregate costs. The hypothetical cost comparisons implicitly assumed that every individual who received community care would be in a nursing home in the absence of community care. Actual experiments with expanded financing of home care were needed to determine the effect on aggregate expenditures. Without experiments, it was impossible to determine the extent to which the expanded public financing would go to those who would not enter a nursing home even without expanded community services.
The early experiments with community care as a substitute for nursing home care tested limited expansions of services: case workers (Goldberg 1970), protective service case workers and home health aides (Blenkner, Bloom, and Nielsen 1971), monitoring visits by nurses (Katz et al. 1972), and personal care, housekeeping, and escort services (Nielsen et al. 1972). All employed random assignment to treatment and control groups, but the samples were relatively small (100 to 300). Katz et al. and Nielsen et al. found statistically significant reductions in nursing home use (although the differences found by Katz et al. were significant only for important subgroups, not overall). Blenkner, Bloom, and Nielsen reported an unexpected increase in nursing home placement, but it was not statistically significant. These early field trials also found some evidence of effects on other outcomes. Nielsen et al. reported increased contentment, Goldberg reported increased social activities, and Blenkner, Bloom, and Nielsen reported decreased stress among informal caregivers.
Because the use of home health care under Medicare and Medicaid had not grown to present levels at the time of these field trials, their results may not be useful in assessing current policies. These studies did, however, demonstrate that field tests could be successfully undertaken with rigorous evaluation designs, thus laying the foundation for community care demonstrations in the 1970's and 1980's.
In this paper, we review the demonstrations from this period that provided case-managed community care to impaired elderly populations and were funded through special waivers of certain Medicaid or Medicare regulations.2 The 16 such demonstrations are listed together with their variants when more than one model was tested:
- Worcester Home Care
- National Center for Health Services Research (NCHSR) Day Care/Homemaker Experiment:
- Day Care Model
- Homemaker Model
- Combined Day Care and Homemaker Model
- Triage
- Washington Community Based Care (CBC)
- ACCESS
- Georgia Alternative Health Services (AHS)
- Wisconsin Community Care Organization (CCO)
- On Lok Community Care Organization for Dependent Adults
- Organizations Providing for Elderly Needs (OPEN)
- Multipurpose Senior Services Project (MSSP)
- South Carolina Community Long-Term Care (CLTC)
- Nursing Home Without Walls
- New York City Home Care
- Florida Pentastar
- San Diego Long-Term Care (LTC)
- Channeling:
- Basic Model
- Financial Model
Sources for our review are preceded by an asterisk in the reference list. When the demonstration had a final evaluation report, we generally relied on it as the primary source. In four cases, we relied on a cross-cutting evaluation by Haskins et al. (1985) which was the primary evaluation of these four demonstrations.
Although we have limited our review to the demonstrations funded through Medicare and Medicaid waivers, other studies have also have been undertaken during this period (see for example, Papsidero et al. 1979, Hughes 1981, and Groth-Juncker et al. 1983).3 Their findings are consistent with those reported for the demonstrations reviewed here. (See Hedrick and Inui 1986 for a review.) In addition, numerous states have undertaken community care initiatives (Greenberg, Schmitz, and Lakin 1983, and Health Care Financing Administration 1984). Typically the state initiatives have been designed as service programs rather than experiments, and they have therefore not been accompanied by rigorous evaluations.
Our review builds on a number of previous reviews (Applied Management Sciences 1976, LaVor and Callender 1976, Doherty, Segal, and Hicks 1978, Greenberg et al. 1980, Steiner and Needleman 1981, Stassen and Holahan 1980, Toff 1981, General Accounting Office 1982, Zawadski 1984, Palmer 1984, Hughes 1985, Kotler et al. 1985, Capitman, Haskins, and Bernstein 1986, Capitman 1986, and Hedrick and Inui 1986). The previous reviews have not systematically compared quantitative results and do not include the most recent demonstrations. The present paper attempts to fill those gaps.
B. THE INTERVENTIONS TESTED
Large-scale community care demonstrations began in 1973 with the Worcester Home Care demonstration and continued to completion of the South Carolina CLTC and Channeling demonstrations in 1984 (see Figure 1). Despite the 12-year time span and varied programmatic and research designs, all demonstrations shared the objective of substituting community care for nursing home care wherever appropriate. Meeting this objective was expected to reduce long-term care costs and improve the quality of clients' lives. Most of the demonstrations focused on the elderly.
1. Case Management and Expanded Community Services
Case management and an expanded package of community services (typically including personal care and homemaker services) were the key program elements of these demonstrations. Although there had been some debate about whether an ongoing case management role was needed after services were arranged, only the NCHSR Day Care/Homemaker experiment did not include ongoing case management in its intervention. Because it did not provide a broad range of services (one model provided adult day care; the second, homemaker services; and the third, adult day care and homemaker services), ongoing case management to coordinate of services was not essential to the intervention. Most demonstrations employed individual case managers to be responsible for assessment of needs, design of a care plan, arrangement of services, and ongoing monitoring, but four (Triage, OPEN, South Carolina CLTC, and MSSP) used teams made up of professionals from different disciplines. The intensity of case management varied. Triage had the highest average caseload: 125 cases per case manager. Caseloads of the other demonstrations reporting this information ranged from 45 to 80 clients.
Expanded community services were funded through waivers of Medicare or Medicaid regulations4 to permit payment for services not normally covered (e.g., homemaker services), in situations not normally covered (e.g., personal care without a need for skilled nursing care), or to individuals not normally eligible (e.g., those who would be eligible for Medicaid if in a nursing home but not in the community). These waivers made it possible to pay for a broader range of community care services over a longer period to different types of people than is typically possible under Medicaid and Medicare. (The only exception to funding through waivers was for the Basic Model of the Channeling demonstration, which had only limited funds to pay for services to fill in the gaps in the existing system. These services were funded directly through demonstration contracts rather than through waivers. The Financial Model of Channeling paid for the full range of community services through waivers of Medicaid and Medicare regulations.)
The demonstrations all expanded in-home service coverage to include nonmedical services such as homemaking and personal care. The specific services (and the specific waivers enabling their coverage) varied across the demonstrations. They include new services not covered at all under Medicaid or Medicare and services already covered but for which limitations on coverage were modified (see appendix Table A.1). (Extension of coverage to additional individuals is discussed under eligibility criteria be low.)
All demonstrations except the NCHSR Day Care Model covered homemaker or personal care -- the services most needed by chronic care patients at home. Other services often covered included chore, companion, escort services, transportation, and home-delivered meals. Many demonstrations also covered one or more other community services that are believed to be important for some clients in the community -- adult day care, foster care, housing improvements, respite care, medical equipment, mental health counseling, prescription drugs, etc. Most could pay for nurses and home health aides in circumstances not normally covered by Medicare and Medicaid. The demonstrations generally did not cover acute medical care. There was one important exception. On Lok covered physician, hospital, and nursing home care, laying the foundation for the social health maintenance organizations now being tested. (Triage paid clients' deductibles and coinsurance under Medicare.)
Another program element that varied across the demonstrations is service authorization power. The extent to which case managers can authorize payment for the full package of community care determines whether they can control service delivery or must act as brokers and advocates for their clients, coordinating care paid for by other agencies. (Authorization power is not always clearly described in the evaluation reports, but Table A.2 summarizes our understanding of case managers' authorization power.) Typically the demonstrations had power to authorize only expanded services (the breadth of which varied of course), the intent being to rely on existing programs before using demonstration funds. But in several cases the demonstration's authority was extended to include Medicaid or Medicare home health care or services funded under Title XX of the Social Security Act: Washington CBC (Title XX), ACCESS (Medicaid home health), On Lok (Medicare home health), Nursing Home without Walls (Medicaid home health), and Financial Model Channeling (Medicare and Medicaid home health through a pooling of funds). As indicated, On Lok could also authorize Medicare physician, hospital, and nursing home care. Finally, ACCESS and South Carolina CLTC could withhold authorization for Medicaid nursing home payment for clients not satisfying the eligibility requirements -- that is, they were preadmission screening units for nursing homes under Medicaid. Thus in all but three demonstrations, authorization power was limited essentially to community services, and in most of these it was further limited to services whose coverage was expanded under waivers.
In expanding government financing for community services, there was some concern that total costs might increase. In an effort to control costs, seven of the demonstrations (ACCESS, Georgia AHS, Wisconsin CCO, MSSP, South Carolina CLTC, Nursing Home without Walls, and Channeling) implemented limits on the amount that could be spent on community services for each individual. These cost "caps ranged from 60 to 85 percent of nursing home reimbursement rates (see Table A.2). Most demonstrations reported procedures to allow for temporarily high cost clients to be served above the cap. Financial Model Channeling also imposed a cap on expenditures for the caseload as a whole -- average expenditures had to be less than 60 percent of the nursing home rate.
A second cost control element, client cost sharing, was implemented by three demonstrations (ACCESS, South Carolina CLTC, and Channeling). Clients with incomes above a specified dollar amount were required to contribute to the cost of services purchased by the demonstration. Because the incomes of clients were typically quite low, the extent of cost sharing turned out to be quite small.
2. Populations Serve
Ten of the demonstrations were directed toward the elderly (minimum ages ranged from 50 to 65); one had no minimum age; and the other five served the adult disabled population as well as the elderly (see Table A.3).
All of the demonstrations required that clients be eligible for an existing program, usually the program (Medicare or Medicaid) under whose waivers services were funded. (One demonstration required Title XX as well as Medicaid eligibility.) Requiring Medicaid eligibility ensures that the demonstration serves a low-income population. Restricting the program to the Medicaid-eligible does, however, exclude the "spend-down" population -- those who enter nursing homes as private pay patients but use up their assets over time and become eligible for Medicaid -- which account for about half of those whose nursing home costs are ultimately covered by Medicaid.
The demonstrations sought to serve those at risk of nursing home placement and developed specific eligibility criteria to identify them. The only exception was the first phase of the Triage demonstration, although its second phase implemented disability requirements. The other demonstrations used three different approaches. Eight (Worcester Home Care, NCHSR Day Care/ Homemaker, Washington CBC, OPEN, MSSP, New York City Home Care, Florida Pentastar, and San Diego LTC) required that a client have a service need, but they did not have specific formalized disability criteria (see Table A.3). Five (Georgia AHS, Wisconsin CCO, On Lok, Nursing Home without Walls, and Channeling) imposed specific disability requirements. Finally, ACCESS and South Carolina CLTC, as indicated, identified clients as part of the nursing home preadmission screening process. To be eligible for these demonstrations clients had to satisfy Medicaid requirements for nursing home admission.
The targeting approach determined the frailty of the populations served. Table 1 presents disability measures for the demonstrations grouped by their approach to targeting. Although not a perfect correlation, the frailty of the clients increases with the stringency of the disability requirements.5 At one extreme Triage had neither need nor disability criteria, and 54 percent of its clients turned out to have at least one disability in ADL's. At the other extreme, South Carolina CLTC, relied on preadmission screening, and 95 percent of its clients turned out to have at least one ADL disability.
| TABLE 1: Client Disability at Enrollment | ||||
| Demonstration (evaluation period) | Disabled on at Least One ADL (percentage) | Impaired on at Least One IADL (percentage) | Incontinent (percentage) | Cognitive Impairmenta |
| NO NEED/FUNCTIONING CRITERIA | ||||
| Triageb (1976-1979) | 54 | 94 | --- | 1.7 |
| SERVICE NEED CRITERIAc | ||||
| Worcester Home Care (1973-1975) | 41 | --- | --- | --- |
| NCHSR Day Care/ Homemakerd (1975-1977) | 77 | --- | --- | --- |
| Project OPENb (1980-1983) | 50 | 81 | 24 | 0.6 |
| MSSPb (1980-1983) | 61 | 80 | 47 | 1.7 |
| New York City Home Careb (1980-1983) | 78 | 100 | 38 | 2.6 |
| Florida Pentastarb (1981-1983) | 58 | 97 | 22 | 1.4 |
| San Diego LTCb (1981-1983) | 55 | 97 | 43 | 2.3 |
| FUNCTIONING CRITERIA | ||||
| Georgia AHS (1977-1980) | 60 | --- | --- | 3.1 |
| Wisconsin CCOb (1978-1980) | 62 | 97 | --- | --- |
| On Lokb (1979-1983) | 85 | 93 | 60 | 3.2 |
| Nursing Home without Walls (1980-1983) | 76 | --- | --- | --- |
| Channeling (1982-1984) | 84 | 100 | 55 | 3.5 |
| PRE-ADMISSION SCREEN | ||||
| ACCESSb (1977-1980) | 82 | 99 | 44 | 2.4 |
| South Carolina LTCb (1980-1984) | 95 | 97 | 58 | 3.5 |
|
||||
C. EVALUATION DESIGNS
Whether an evaluation provides sound estimates of the true effects of expanded community care depends on many features of the evaluation design, the most important of which is the comparison methodology. After discussing comparison methodologies, we review other issues that affect interpretation: the sample size, the number of replications of the intervention, and the extent of data available to measure outcomes.
1. Comparison Methodologies
To measure the effect of expanded community care, it is essential to be able to contrast the experiences of the persons to whom the expanded services were available -- the treatment group -- with some measure of what the experiences of the same persons would have been if they had not had the service opportunities provided by the demonstration. Every evaluation developed a methodology intended to estimate the effects of the demonstration based on such a comparison. The strength of the comparison methodologies, however, differed substantially across the demonstrations. We have classified the methodologies into three categories based on the likelihood of biased estimates of demonstration effects.
The strongest comparison methodologies are the experiments that randomly assigned eligible applicants either to receive the demonstration services (treatment status) or to receive only those services regularly available in the community (control status). Random assignment is a powerful design, because it ensures that, for a large sample, the treatment group will be similar to the control group on both measured and unmeasured characteristics. Evaluations that use randomized designs are most likely to obtain unbiased estimates of demonstration effects. Nine demonstrations are in this first group (see Table 2).
The second group -- comprising five evaluations were quasi experiments. To represent what would have happened in the absence of the demonstration, they selected comparison groups intended to be similar to the treatment group, but did not use random assignment. Three selected comparison groups entirely from outside the demonstration catchment area; two drew comparison-group members partly from within and partly from outside the area.
A comparison group methodology that does not use randomization is generally a weaker design because the comparison group may differ from the treatment group on measured and unmeasured characteristics. Nonparticipants within the catchment area are likely to differ in unknown ways from those who choose to apply or are referred to the program; a comparison group outside the catchment area faces a different service environment. The comparison group is inevitably selected in a different way from the treatment group. Potential clients typically apply to the program or are referred by a provider and then are subjected to an eligibility determination process. The treatment group is thus self- and program-selected in ways that are only partially known. Comparison groups, in contrast, must be chosen from existing lists (e.g., Medicaid rolls) based on available measured characteristics. Selecting a group that is similar to the treatment group is particularly difficult for community care demonstrations because the central outcome of interest --nursing home use -- is extremely difficult to predict. The overwhelming finding of existing research is that measured characteristics explain little of the variation in nursing home placement rates (see Grannemann et al. 1986 for a review of the literature).
Moreover, as it turned out, even the measured characteristics of the treatment and comparison groups differed for all the quasi experiments, in some cases substantially. Thus, evaluations constrained to use a comparison-group methodology rather than a randomized experiment run a high risk of inaccurately representing what would have happened to participants in the absence of the demonstration.6
Although evidence on the bias of quasi-experimental methodologies as applied to community care does not exist, recent research on evaluation of employment and training programs is not encouraging. LaLonde (1986) and Fraker and Maynard (forthcoming) compared the actual results of an actual randomized experiment with simulations of quasi-experimental results for the same demonstration using various comparison groups and estimation methodologies. They found that the results using the quasi-experimental methodologies differed substantially from the actual results of the randomized experiment. LaLonde (1986, p. 617) concludes that "policymakers should be aware that the available nonexperimental evaluations of employment and training programs may contain large and unknown biases." A similar caution applies to nonexperimental evaluations of community care demonstrations.
The third group of studies includes two (ACCESS and Washington CBC) that were countywide interventions which compared aggregate Medicaid cost and nursing home use in the demonstration counties with the corresponding estimates for a set of comparison counties. Because many factors other than the demonstrations affect nursing home use and costs, the results of these evaluations are subject to considerable uncertainty. For example, if a certificate of need for construction of new nursing home beds had been granted in the comparison county, then the newly constructed beds are likely to cause an increase in nursing home use in the comparison county. When growth in aggregate nursing home use-in the treatment county is compared to that in the comparison county, growth in nursing home use will be lower in the treatment county. It is not clear, however, whether this should be attributed to the effect of the demonstration or to the nursing home bed construction policy in the comparison county. Because of the difficulty of distinguishing treatment effects from other factors affecting service use and costs, comparisons using aggregate data for a small number of counties seldom provide persuasive evidence about program effects.
| TABLE 2: Evaluation Methodologies | ||||
| Demonstration (evaluation period) | Comparison Methodology | Number of States | Number of Sites | Sample Size |
| Worcester Home Care (1973-1975) | Random assignment | 1 | 1 | 485 |
| NCHSR Day Care/ Homemaker (1975-1977) | Random assignment | 4 | 6 | 1,566 |
| Triage (1976-1979) | Comparison group outside area | 1 | 1 | 502 |
| Washington CBC (1976-1977 | County-level comparison | 1 | 2 | --- |
| ACCESS (1977-1980) | County-level comparison | 1 | 1 | --- |
| Georgia AHS (1977-1980) | Random assignment | 1 | 1 | 1,332 |
| Wisconsin CCO (1978-1980) | Random assignment | 1 | 1a | 417 |
| On Lok (1979-1983) | Comparison group outside area | 1 | 1 | 139b |
| Project OPEN (1980-1983) | Random assignment | 1 | 1 | 335 |
| MSSP (1980-1983) | Comparison group within and outside area | 1 | 8 | 4,200 |
| South Carolina LTC (1980-1984) | Random assignment | 1 | 1 | 1,867 |
| Nursing Home without Walls (1980-1983) | Comparison group within and outside area | 1 | 9 | 1,373 |
| New York City Home Care (1980-1983) | Comparison group outside area | 1 | 1 | 704 |
| Florida Pentastar (1981-1983) | Random assignment (plus comparison group outside area) | 1 | 5 | 1,046 |
| San Diego LTC (1981-1983) | Random assignment | 1 | 1 | 831c |
| Channeling (1982-1984) | Random assignment | 10d | 10 | 6,326 |
|
||||
In the remainder of this article, we place primary emphasis on the randomized experiments. Results of quasi experiments are reported in the tables but do not figure heavily in our assessment of the findings. Finally, the two studies using aggregate data are included only in the discussion of nursing home use, which was the primary outcome they analyzed.
In interpreting the results, keep the nature of the comparison in mind. The demonstrations compared expanded case-managed community care to the existing long-term care system. Although little information is available on how much, the existing service system paid for some community care under Medicare, Medicaid, and other government programs. Thus, the demonstrations evaluated the expansion of community care beyond what already existed, not community care versus its total absence. Moreover, some of the demonstrations were undoubtedly tested in environments where nursing home bed supply was constrained by restrictions on reimbursement rates and construction of new beds. Unfortunately, we do not know the extent to which bed supply was restricted, and it is difficult to speculate on how the effect of community care might differ in different service environments.
2. Sample Size
The sample size determines the evaluation's ability to detect effects if they exist. If samples are small, estimates of program effects are subject to greater sampling error, and the absence of a statistically significant measured effect may not correctly indicate the absence of a true effect.
The sample sizes of the community care demonstrations vary widely. The smallest used a sample of only 139 people. Four of the studies had sample sizes between 300 and 600. The largest sample size was just over 6,300. Differences in sampling error therefore varied considerably across the evaluations.
3. Number of Replications and Service Environments
The number of replications of the intervention and the diversity of service environments in which it is tested determine the ability to generalize from the demonstration results. Limited site selection increases the risk that observed results are due to special features of the particular implementation or the environment.
The number of replications was generally quite limited. Of the nine randomized experiments, only two (NCHSR Day Care/Homemaker and Channeling) were tested in communities in more than one state. Several were tested in more than one site within a state.
4. Data Collection
The amount and quality of the information collected determines the range of effects that can be measured. Five potential sources of data are available to demonstrations of this kind: individual interviews with treatment and control (or comparison) groups,7 demonstration project records (for clients only), public program records such as Medicare and Medicaid claims, provider records, and official death records.
The demonstrations varied in the range of data sources they were able to use (see Table A.4). One was limited to a single data source (aggregate county social service department data). One relied on individual interviews, supplemented by project and death records. Seven combined individual interviews with records data from Medicare, Medicaid, or project records, but did not collect both Medicaid and Medicare data. (One of these also collected death records.) Seven used individual interviews and both Medicaid and Medicare records. (One of these also collected from service providers data on the use and cost of services not covered by Medicare, Medicaid, or the project; interviewed the primary informal caregivers of a subsample of the treatment and control groups; and obtained official death records.)
The breadth of the data collection affects primarily the service use and cost outcomes. Evaluations limited to Medicare and project records, for example, will miss effects on most nursing home use, which is paid for by Medicaid or private individuals.
Measures of quality of life are obtained from individual interviews. They are subject to potential bias due to data noncomparability.8 For several of the evaluations, program staff conducted treatment group follow-up interviews, but research staff conducted control group follow-up interviews. Because of their different orientations, the data that the two types of interviewers collect may differ, introducing measurement bias into the treatment-control comparisons.9 Among randomized experiments six evaluations (Worcester Home Care, NCHSR Day Care/Homemaker, Georgia AHS, South Carolina CLTC, San Diego LTC, and Channeling) used comparable follow-up data collection for the two groups; three (Wisconsin CCO, OPEN, and Florida Pentastar) were at risk of measurement bias because of differential data collection for the treatment and control groups.
The length of the follow-up data collection period determines the capability of detecting long-term program effects. All the evaluations collected follow-up data for at least 12 months; two followed at least a subsample for 18 months; and four followed at least a subsample for two years or 9 longer.10
D. RESULTS
1. Nursing Home Use
All the demonstrations sought to substitute community care for nursing home care, and all evaluations examined this outcome. As indicated, the data sources determine the comprehensiveness of the nursing home use measures. Medicaid and private individuals are the major payors for nursing homes. Evaluations that relied on Medicare records alone measured only a fraction of nursing home use. When clients were required to be Medicaid eligible, Medicaid and Medicare records capture nearly all nursing home use, when clients were not required to be eligible for Medicaid, however, Medicaid and Medicare records without provider records or individual interviews do not capture use paid for by private individuals. The omission of use paid for privately is potentially important because many enter nursing homes as private pay patients, only later spending down their assets to the point of Medicaid eligibility. Indeed, about half of those in nursing homes under Medicaid enter as private pay patients. For this reason, much of the effect of demonstrations that were not limited to the Medicaid-eligible could reflect nursing home use paid for privately. In presenting the results in Table 3,11 therefore, we distinguish among studies that measure essentially all use and those with partial measures of nursing home use.
Overall effects. Of the six studies that used randomized designs and had essentially complete data on nursing home use, five tell a consistent story. For Worcester Home Care, Georgia AHS, Wisconsin CCO,12 Florida Pentastar, and Channeling, treatment group nursing home use was equal to or less than the control group use, but the differences were small ranging from zero to eight days during the year after enrollment -- and not statistically significant.13 (The Florida Pentastar evaluation did not measure nursing home days; however, the percentage who had entered a nursing home by 18 months was slightly smaller for the treatment group than for the control group -- 7.6 vs. 8.5 percent, a difference that was also not statistically significant.)
In all of these cases, the populations served turned out to be at relatively low risk of nursing home placement, precluding large reductions in nursing home use. The control group experience measures the risk of nursing home use in the absence of expanded services. The control groups spent between 26 and 46 days in nursing homes during the first year after enrollment. Even if these demonstrations had cut nursing home use by 50 percent, the number of nursing home days saved would have been modest. Moreover, actual reductions were well below 50 percent, ranging from 0 to 24 percent.
| TABLE 3: Nursing Home Days during the First Year | ||||||
| Demonstration (source) | Data Source | Treatment Mean | Control Mean | Difference in Means | Percentage Difference | |
| RANDOMIZED EXPERIMENTS, ALL USE | ||||||
| Worcester Home Carea (Sherwood, Morris, and Gutkin, 1975, pp. 25, 38) | Interviews | 46 | 46 | 0 | 0.0 | |
| Georgia AHS (Skellie et al., 1982, pp. 171-172) | Medicaid records Medicare records | 22 | 29 | -7 | -24.1 | |
| South Carolina LTC (Brown et al., 1985, p. 98) | Medicaid records Medicare records | 90 | 130 | -40* | -30.8 | |
| Florida Pentastar (Maurer et al., 1984, p. 84) | Interviews | --- | --- | --- | -10.6b | |
| Channelingc (Wooldridge and Schore, 1986, pp. 92-93) | Medicaid records Medicare records Provider records | |||||
| Basic Model | 25 | 29 | -4 | -13.8 | ||
| Financial Model | 23 | 26 | -3 | -11.5 | ||
| RANDOMIZED EXPERIMENT, MEDICAID USE ONLY | ||||||
| Wisconsin CCOd (Seidl et al., 1980, p. 206) | Medicaid records | 25 | 33 | -8 | -24.2 | |
| RANDOMIZED EXPERIMENTS, MEDICARE USE ONLY | ||||||
| NCHSR Day Care/Homemaker (Weissert, Wan and Livieratos, 1980, pp. 44, 46, 48) | Medicare records | |||||
| Day care | 5 | 7 | -2 | -28.6 | ||
| Homemaker | 3 | 4 | -1 | -25.0 | ||
| Combined | 4 | 5 | -1 | -20.0 | ||
| Project OPENe (Haskins et al., 1985, Appendix A, p. 119) | Medicare records | 0.1 | 0.3 | -0.2 | -66.7 | |
| San Diego LTCe (Haskins et al., 1985, Appendix A. pp. 100, 102) | Medicare records | 0.5 | 0.9 | -0.4 | -44.4 | |
| QUASI EXPERIMENTS, ALL USE | ||||||
| Triage (Shealy, Hicks, and Quinn, 1979, pp. 449, 450) | Interviews/diaries | 7 | 4 | 3f | 75.0 | |
| On Loke (Haskins et al., 1985, Appendix A, p. 102) | Interviews/diaries | 20 | 117 | -97* | -82.9 | |
| MSSP (Miller et al., 1984, pp. 1-24, 1-70) | Medicaid records Medicare records | 39 | 45 | -6g | -13.3 | |
| QUASI EXPERIMENT, MEDICAID AND MEDICARE USE ONLY | ||||||
| Nursing Home without Wallsh (Birnbaum et al., 1984, p. IV-3) | Medicaid records Medicare records | |||||
| Upstate | 6 | 99 | -93* | -93.9 | ||
| New York City | 5 | 40 | -35* | -87.5 | ||
| QUASI EXPERIMENT, MEDICARE USE ONLY | ||||||
| New York City Home Caree (Haskins et al., 1985, Appendix A, p. 103) | Medicare recordsi | 0.2 | 1.1 | -0.9 | -81.8 | |
NOTE: Estimates for the full sample wherever possible. For Project OPEN, San Diego LTC, On Lok, Nursing Home Without Walls, and New York City Home Care, estimates are for survivors only.
* Statistically significant at the 5 percent level. All clients were required to be eligible for Medicaid. |
||||||
The possibility of delayed reductions in nursing home use is not addressed by these data, which are for only one year. As indicated (see Table A.4), the length of follow up was generally short. Three of these five experiments had more than one year of follow-up data: Georgia AHS (two years), Florida Pentastar (18 months), and Channeling (18 months). None of the three found significant differences after the first year.
Although direct evidence concerning effects more than a year or two after enrollment was not collected in these five experiments, the likelihood of a long-run reduction is low. It would require a large increase in control group nursing home use over time or a large increase in the percentage reduction in use, and probably both. The limited time-trend evidence (not shown) suggests that neither occurred.
The South Carolina CLTC project stands in contrast to the findings of the other five randomized experiments with essentially complete nursing home use data. It reported high control group use (130 days during the first year after enrollment) and a large, statistically significant reduction (40 days). Moreover, longer follow-up data indicate that the reduction persists for at least three years.
The distinguishing feature of the South Carolina CLTC demonstration appears to have been its integration with a nursing home preadmission screen. All clients came through this screen and were eligible for nursing home admission under Medicaid. They were among the most disabled of any of the demonstrations (see Table 1) and were at greatest risk of nursing home use. By identifying clients at the nursing home door and requiring nursing home eligibility under Medicaid, the South Carolina CLTC demonstration appears to have identified the intended target population and reduced its nursing home use.14 In addition to its success at identifying a high-risk population, South Carolina CLTC's reduction was higher in relative terms as well (31 percent compared with 0-24 percent for the other five demonstrations).
The three randomized experiments that only measured nursing home use under Medicare also found treatment group use below control group use. As indicated, however, Medicare claims capture only a small fraction of all nursing home use. Although larger in relative terms than the differences for the randomized experiments that measured essentially all use, none of the differences for the randomized experiments that measured only Medicare use was statistically significant, and the magnitudes of the measured differences were small (two days or less).
The quasi experiments varied widely in their findings. Two (Triage and New York City Home Care) reported small, nonsignificant increases, one (MSSP) reported a 6-day decrease (statistical significance not reported), and two (On Lok and Nursing Home without Walls) reported large, statistically significant reductions. As indicated above, however, the inherent difficulty in choosing a comparison group similar to the treatment group on both measured and unmeasured characteristics substantially reduces the confidence that can be placed in the results from the quasi experiments.
Finally, the two evaluations that used county-level comparisons both reported reductions in nursing home use relative to the comparison counties (not shown). The Washington CBC project reported annual declines in Medicaid nursing home populations of -3.0 and -4.5 percent in the two demonstration sites compared to -0.6 in the balance of the state (Solem et al., 1979, p. 66). ACCESS (the only other demonstration to rely on preadmission screening) reported that Medicaid nursing home expenditures rose 5.7 percent in the demonstration site compared to 23.1 percent in the six comparison counties (Price and Ripp, 1980, p. VII.17). Whether these (relative) reductions in Medicaid nursing home use were due to the expanded community care or other factors cannot be determined.
The weight of the evidence is that expanding community care beyond what already is provided under existing programs reduces nursing home use, but the magnitude of the reduction is small. The only apparent exception is an expansion of community care combined with nursing home preadmission screening.
Differences across subgroups. The general failure of the demonstrations to identify client populations at high risk of nursing home placement raises the question of whether there are identifiable groups for which expanded community care substitutes for nursing home care. Several of the evaluations analyzed differences in effects across subgroups of the populations, permitting identification of groups for which reductions in nursing home use were greatest.
The evaluations differed in the subgroup variables analyzed. We were able to classify variables as measures of disability, living arrangement/availability of informal supports, Medicaid eligibility, or risk of nursing home placement. (Definitions of subgroups and results are summarized in appendix Table A.5.) Because subgroup samples are small (increasing the risk of false negative tests) and because a large number of tests were conducted (increasing the risk of false positive tests), the subgroup results must be interpreted cautiously.15
Disability and variables closely related to disability were the subgroup variables most often analyzed. Measures used to define subgroups were ability to perform activities of daily living (ADL), whether certified eligible for skilled nursing facility (SNF) or intermediate care facility (ICF) care, recommended services, continence, and cognitive impairment. Among randomized experiments that measured effects on all nursing home use, differences across disability subgroups appeared in about half the analyses. Larger reductions were generally associated with greater disability, although in two cases this relationship did not hold for the most extreme level of disability. In this regard, it is worth noting that some of the South Carolina CLTC demonstration sample were not eligible for nursing home placement. Although they were not part of the basic analysis, a separate analysis of this group found low control group nursing home use and no reduction in use. (All but one of the other evaluations found either no differences in effects across disability levels or, consistent with the randomized experiments with complete data, larger reductions for the more disabled.)
Although evidence on differences in effects with measures of living arrangement/informal support is limited, it is consistent with the hypothesis that reductions in nursing home use are greater among those with limited informal support. Among the randomized experiments that measured all nursing home use, the reductions of the South Carolina CLTC were larger for the group receiving only formal care at enrollment than for the groups receiving informal care (either alone or in combination with formal care). (Reductions were, however, smaller among the group without any formal or informal care.) Financial Model Channeling reduced nursing home use during the first six months among those who lived alone but not among those living with others. (Among the other evaluations, three -- NCHSR Day Care/Homemaker, San Diego LTC, and the upstate site of Nursing Home without Walls-- found no differences in effects with living arrangement; one, the New York City site of Nursing Home without Wall found larger reductions in nursing home use for those living alone and over age 75.)
Those in a nursing home at enrollment (a small group) had significant reductions in nursing home use under both Channeling models. It is important to note, however, that Channeling clients had to be certified as able to be discharged within three months, so these were not typical nursing home patients. Although the Channeling result is rather strong, supporting evidence from other studies is lacking among the randomized experiments. (On Lok's reported reduction in nursing home use was also greater among those in a nursing home at enrollment.)
Three randomized experiments with complete data examined differences in effects associated with Medicaid eligibility. (These subgroups are of interest because Medicaid will cover nursing home care for persons with higher incomes than that required for eligibility in the community.) Results were inconsistent: no differences for Worcester Home Care and Financial Model Channeling; increased nursing home use among the Medicaid-eligible (apparently those on nursing home waiting lists), but decreased use among those with higher incomes under Basic Model Channeling; and a larger decrease in nursing home use among those who were Medicaid-eligible in the community than among those with higher incomes under South Carolina CLTC. Contrary to expectations, nursing home reductions do not appear to be greater among those with incomes above the level required for Medicaid eligibility in the community.
Summary measures of the risk of nursing home placement defined subgroups in two randomized experiments, providing limited support for the hypothesis that nursing home reductions are larger for those predicted to be at higher risk of nursing home placement. Channeling defined risk groups based on a multiple regression model of the determinants of nursing home admission. Basic Model Channeling reduced nursing home use among the high-risk group but not the extreme-risk group; Financial Model Channeling exhibited a pattern of larger reductions with increasing risk (including the extreme-risk group). Worcester Home Care relied on interviewer judgments about risks and found no differences. (Two quasi experiments that analyzed differences with regression model predictions of risk of nursing home placement-- MSSP and Nursing Home without Walls-- found larger nursing home reductions among those at higher risk.)
Other subgroup variables were analyzed by only one evaluation or exhibited inconsistent results: whether on a nursing home waiting list, hospitalization, unmet needs, prognosis, age, gender, race, diagnosis, and loneliness.16
In summary, the evidence on differences in effects across subgroups is quite limited because of the small subgroup samples, limited number of evaluations analyzing subgroups, and lack of consistency of subgroup definitions and results. The limited evidence suggests that larger nursing home reductions may be associated with being more disabled (up to some level), having less informal support, being in a nursing home (certified for discharge), and having a higher statistically predicted probability of nursing home placement (up to some level). Although the differences in effects across subgroups suggest that high risk of nursing home placement is necessary for expanded community care to reduce nursing home use, it is by no means sufficient. Some subgroups associated with high nursing home use were not associated with large reductions in its use. Moreover, many of the subgroups for which significant reductions were observed were small, and the evidence is not sufficiently precise to define eligibility cutoffs, particularly to identify those for whom the risk of nursing home placement is too high.
2. Hospital Use
Although reduction in hospital use was not a main objective of most of the demonstrations (the two exceptions being San Diego LTC and OPEN), there was some hope that community care might substitute for hospital care. This could occur by enabling earlier discharge, or by enabling patients awaiting nursing home placement but not needing hospital care to be discharged to their homes. Community care programs might increase hospital use, however, either because increased monitoring of patients conditions may increase admissions or because patients at home may require more hospitalizations than those in nursing homes nursing homes may be able to treat some conditions that would require hospitalization if the person lived at home.
Data problems that plagued analysis of nursing home use do not as seriously affect analysis of hospital use. Because Medicare pays for most hospital use of the elderly, evaluations that used Medicare records captured virtually all use. Wisconsin CCO was the only demonstration that did not use interview or Medicare data and hence did not measure an important component of hospital use. (Data sources for hospital use were the same as for nursing home use.)
Table 4 summarizes the results for hospital use. Among the randomized experiments that measured essentially all hospital use, control group use varied from lows of 4 days over the first year after enrollment (Worcester Home Care and Georgia AHS) to 25 days (Financial Model Channeling). Although treatment group use is typically one day smaller than control group use (in only one case, Georgia AHS, is treatment group use higher; the largest difference was three days lower for OPEN), none of the differences is statistically significant. Based on these results, hospital use appears to be unaffected or at most slightly reduced by case-managed community care. Concern that hospital use might be increased by expanded case management and community services does not appear justified. (The Wisconsin CCO randomized experiment, which relied solely on Medicaid data, found a large statistically significant reduction in hospital use -- a result which appears inconsistent with the predominant evidence of no effect. Results for the quasi experiments are not statistically significant and are without pattern.)
| TABLE 4: Hospital Use during the First Year | |||||
| Demonstration | Treatment Mean | Control Mean | Difference In Mean | Percentage Difference | |
| RANDOMIZED EXPERIMENTS, ALL USE | |||||
| Worcester Home Carea (Sherwood, Morris, and Gutkin, 1975, Appendix B, p. 27) | 4 | 4 | 0 | 0.0 | |
| NCHSR Day Care/Homemaker (Weissert, Wan, and Livieratos, 1980, pp. 44, 46, 48) | |||||
| Day Care | 11 | 12 | -1 | -8.3 | |
| Homemaker | 16 | 16 | 0 | 0.0 | |
| Combined | 15 | 16 | -1 | -6.3 | |
| Georgia AHS (Skellie et al., 1982, pp. 173-174) | 6 | 4 | 2 | 50.0 | |
| Project OPENb (Haskins et al., 1985, Appendix A, p. 118) | 9 | 12 | -3 | -25.0 | |
| South Carolina LTC (Blackman et al., 1985, p. III.88) | 18 | 20 | -2 | -10.0 | |
| San Diego LTCb (Haskins et al., 1985, Appendix A, p. 101) | 9 | 10 | -1 | -10.0 | |
| Channelingc (Wooldridge and Schore, 1986, p. c.16) | |||||
| Basic Model | 17 | 18 | -1 | -5.6 | |
| Financial Model | 24 | 25 | -1 | -4.0 | |
| RANDOMIZED EXPERIMENT, MEDICAID USE ONLY | |||||
| Wisconsin CCOd (Seidl et al., 1980, p. 206) | 3 | 12 | -9* | -75.0 | |
| QUASI EXPERIMENTS, ALL USE | |||||
| Triage (Shealy, Hicks, and Quinn, 1979, pp. 449-450) | 8 | 6 | 2e | 33.3 | |
| On Lokb (Haskins et al., 1985, p. 102) | 6 | 8 | -2 | -25.0 | |
| MSSP (Miller et al., 1984, p. 1.24, 1.72) | 20 | 19 | 1f | 5.3 | |
| Nursing Home without Wallsg (Birnbaum et al., 1984, p. IV.13) | |||||
| Upstate | 19 | 16 | 3 | 18.8 | |
| New York City | 18 | 16 | 2 | 12.5 | |
| New York City Home Careb,h (Haskins et al., 1985, Appendix A, p. 102) | 21 | 21 | 0 | 0.0 | |
NOTE: Estimates are for the full sample wherever possible. For Project OPEN, San Diego LTC, On Lok, Nursing Home without Walls, and New York City Home Care, estimates are for survivors only.
|
|||||
3. Costs
Analysis of effects on costs are limited by the data collected. Given the multiple providers and funding sources, cost data are dispersed throughout the provider system, and hence comprehensive cost data are difficult to collect. Among the randomized experiments, two (Worcester Home Care and' Florida Pentastar) did not collect sufficient cost information for meaningful cost analysis. The other randomized experiments, in addition to project costs, collected only Medicare costs (NCHSR Day Care/Homemaker), only Medicaid (Wisconsin CCO), Medicare and Medicaid (Georgia AHS, South Carolina CLTC, and San Diego LTC) and Medicare, Medicaid, other public and private costs (OPEN and Channeling). (See appendix Table A.6). Thus, all the evaluations except OPEN and Channeling omitted at least private costs and public costs other than Medicaid, Medicare, and project costs. To the extent that case-managed community care reduces private expenditures (e.g., for nursing homes or community care) or other public expenditures (e.g., for community care), this omission leads to overestimates of cost differences. Given the partial nature of the cost data and the difficulty of collecting cost data, the cost estimates, and particularly comparisons of them across demonstrations, must be interpreted cautiously.
| TABLE 5: Monthly Costs (1984 dollars) | |||||
| Demonstration | Treatment Mean | Control Mean | Difference In Mean | Percentage Difference | |
| RANDOMIZED EXPERIMENT, ALL PAYORS | |||||
| Project OPENa | 963 | 1028 | -65 | -6.3 | |
| Channeling | |||||
| Basic Model | 1412 | 1330 | 82 | 6.2 | |
| Financial Model | 1878 | 1592 | 286 | 18.0 | |
| RANDOMIZATION EXPERIMENTS, MEDICARE AND MEDICAID ONLY | |||||
| Georgia AHD | 377 | 254 | 123 | 48.4 | |
| South Carolina LTC | 691 | 676 | 15 | 2.2 | |
| San Diego LTC | 1018 | 672 | 346 | 51.5 | |
| RANDOMIZED EXPERIMENTS, MEDICARE ONLY | |||||
| NCHSR | |||||
| Day Care | 813 | 534 | 279 | 52.2 | |
| Homemaker | 1095 | 786 | 309 | 39.3 | |
| Combined | 1243 | 847 | 396 | 46.8 | |
| RANDOMIZED EXPERIMENTS, MEDICAID ONLY | |||||
| Wisconsin CCO | 515 | 508 | 7 | 1.4 | |
| QUASI EXPERIMENTS, ALL DATA | |||||
| Triage | 455 | 191 | 264 | 138.2 | |
| On Lok | 1518 | 2198 | -680 | -30.9 | |
| QUASI EXPERIMENTS, MEDICARE AND MEDICAID ONLY | |||||
| MSSP | 1154 | 606 | 548 | 90.4 | |
| Nursing Home without Walls | |||||
| Upstate | 825 | 1117 | -292 | -26.1 | |
| New York City | 1633 | 1159 | 474 | 40.9 | |
| New York City Home Care | 1215 | 713 | 502 | 70.4 | |
NOTE: Statistical significance is not reported. (Evaluations generally did not test cost differences for statistical significance.) For breakdowns of costs by type of service and payor, see Appendix Table A.6.
|
|||||
Although their cost estimates are subject to question,17 OPEN reported a reduction in costs of $65 per person per month and Wisconsin CCO essentially broke even (see Table 5). They did so through reductions in hospital use, not nursing home use. Since then the service environment has changed. The advent of Medicare prospective payment using diagnosis-related groups (DRGs) has increased pressure to reduce hospital lengths of stay. While this change may have increased the need for home care, expanding public financing for such care is less likely to reduce hospital use now than at the time of these demonstrations.
South Carolina CLTC does appear to have broken even by substituting community care for nursing home care. During the first year, total Medicaid and Medicare costs increased an average of $53 per person per month, an increase of 7.7 percent. Over three years, costs were increased by $15 (2.2 percent) for the subsample followed that long.18 (Total costs probably increased somewhat more if private costs are included: because more clients remained in the community, they incurred more room and board costs themselves.)
Without substantial reductions in nursing home use, all the other randomized experiments increased costs: Basic Model Channeling ($82 per person per month), Georgia AHS ($123), Financial Model Channeling $286), NCHSR Day Care/Homemaker ($279-$396, depending on the model), and San Diego LTC ($346).
Evidence from the quasi experiments is inconsistent. Four (Triage, MSSP, the New York City site of Nursing Home without Walls , and New York City Home Care) found large increases, while two (On Lok and the upstate of Nursing Home without Walls) found large decreases. Given their inconsistency and the inherent problems with a comparison group methodology, the results from the quasi experiments do not alter our conclusion based on the randomized experiments.
4. Substitution of Formal for informal Care
Families and friends provide much of the care of the frail elderly. In 1982, of the 18 percent of the noninstitutionalized elderly who had limitations in ADL's or IADL's, only 5.5 percent relied exclusively on paid formal providers, 20.6 percent relied on both formal and informal caregivers, and 73.9 percent relied exclusively on informal caregivers (Liu, Manton, and Liu 1985, Table 1). Expanding public funding for formal services has the potential of partially substituting those paid formal services for informal care provided without cost to the government by family and friends. Two views of substitution differ in their implications for public costs. One asserts that formal services will (partially) replace informal care, perhaps with benefits to the informal caregivers and clients, but at increased public cost. The other asserts that formal services will supplement informal care -- leading to some substitution in the short run but will enable caregivers to continue caregiving longer, thereby reducing total public costs in the long run (Spivak 1984; Christianson 1986).
Little attention was given to the substitution issue by the community care evaluations. Only six estimated demonstration effects on informal caregiving, and the measures were generally limited (See appendix Table A.7).
The South Carolina CLTC project substantially increased the proportion of the sample receiving informal care at home. This increase was directly associated with the decrease in nursing home placement. Because more of the treatment group remained at home, where they relied on informal care, a higher proportion of the treatment group as a whole received informal care than the control group. (Informal care in nursing homes was not measured.)
In the absence of reductions in nursing home use, however, formal care appears to substitute to a small extent for informal help with IADL tasks. Of the demonstrations that used randomized experimental designs but did not significantly reduce nursing home use, three (Worcester Home Care, OPEN, and Basic Model Channeling) had no significant effect on informal caregiving.
Two (San Diego LTC and Financial Model Channeling) did not affect informal help with ADL tasks but decreased informal help with IADL tasks. The San Diego LTC study did not report the magnitude, but the reduction by the Financial Model of Channeling was small in magnitude and concentrated among caregivers least closely associated with clients (visiting caregivers, friends or neighbors, and relatives other than spouses or children). Channeling did not affect the amount of care by the primary caregivers, who provide most of the care. Finally, the evaluation of the New York Home Care Project found a reduction in informal help with ADL tasks, but it used a comparison group methodology to estimate effects.
Whether the small amount of substitution of formal for informal IADL care in the short run extends the capacity of informal caregivers to continue giving care, thereby increasing aggregate caregiving over the long run, remains unresolved. The small reductions in informal help with IADL by the San Diego LTC and Financial Model Channeling demonstrations did not lead to substantial reductions in nursing home use during the 18 months of evaluation follow up. Whether the modest reduction in caregiving burden would have enabled them to continue giving care in the community after 18 months is unknown.
5. Quality of Life
All of the demonstrations shared to some degree the objective of improving the quality of clients' lives. Providing clients the opportunity to choose to live in their own homes rather than nursing homes was one mechanism expected to make clients better off. Providing needed services to those who would live at home even without the intervention of case management and expanded community services was a second mechanism.
Although all the demonstrations sought to improve life quality, attempts to measure it varied considerably across the evaluations, making overall assessment of effects on life quality and comparisons across projects difficult. Indicators of life quality range from narrow measures such as satisfaction with arrangements for services and number of unmet needs for care to global measures such as morale, life satisfaction, and ultimately longevity.
Unmet Needs and Satisfaction with Service Arrangements. Two demonstrations, both randomized experiments, asked about the care received. Georgia AHS asked whether sample members were getting enough help. Channeling asked about satisfaction with arrangements for housecleaning, meals, laundry, and shopping. Both found small but statistically significant benefits (see appendix Table A.8). Channeling also found large significant increases in primary informal caregivers' satisfaction with care arrangements under the Financial Model, significant increases in clients' confidence about getting help under both models (not shown), and significant reductions in reported unmet needs for care (see appendix Table A.9). Together, this evidence, although from only two demonstrations, suggests that expanding coverage of community services has the immediate effect one might expect of increasing satisfaction with the amount of help being received and reducing perceived unmet needs. (New York City Home Care, a quasi experiment that used noncomparable data, reported significant reductions in unmet needs in two areas, medical and economic/social/environmental, but not in ADL and IADL care.)
Problems with the Physical Environment. Although the community care demonstrations were not intended primarily to alter community housing arrangements, some had limited ability to pay for such things as emergency shelter and removal of architectural barriers, and case managers could encourage changes in residence and assist clients in seeking new housing. Some improvement in clients' physical environment is possible as a consequence. The three randomized experiments that examined measures of problems with the physical environment showed a pattern of reductions in problems, but it was statistically significant only for Basic Model Channeling (see appendix Table A.10). Although in the expected direction, the evidence is too limited to suggest that the demonstrations improved clients' physical environments. (New York City Home Care, a quasi experiment, also reported a significant reduction in problems with the physical environment.)
Social Interaction. Although not its central focus, case managers might be expected to encourage more social activities, and the provision of transportation might permit socializing (e.g., at senior centers or adult day care). Of the six randomized tests using one or more measures of social interaction, three (NCHSR Day Care/Homemaker Combined Model, Basic Model Channeling, and OPEN) found significant increases (see appendix Table A.11). The NCHSR Day Care/Homemaker analysis was, however, based on comparison of treatment group members receiving project services with control group members receiving no similar services, rather than on the full experimental sample, and the OPEN data were not comparably collected, undercutting the confidence that can be placed in the results of these two evaluations. Nevertheless, the studies provide limited evidence that case-managed community care leads to small increases in social interaction. (The results of the one quasi experiment that examined social interaction, New York City Home Care, are consistent with this conclusion.)
Health and Functioning. Health and functioning were expected to be improved, or their deterioration slowed, through regular monitoring to identify and respond to problems and through increased access to services (e.g., physical therapy). In addition, functioning was expected to be improved by reducing nursing home placements. Nursing homes are believed to increase functional dependence because they do not permit patients to perform some ADL (e.g., bathing) by themselves. Three randomized experiments analyzed self-rated health (see appendix Table A.12). San Diego LTC found a significant increase in self-rated health at 6 months (not shown) and Basic model Channeling found significant increases at 12 months. This provides limited support for the hypothesis that case-managed community care improves health as perceived by clients. Financial Model Channeling, however, found more worry about health reported by clients at 6 months (not shown). Worcester Home Care found no effect.
The eight randomized experiments that tested effects on disability in ADL split about evenly on the outcome (see appendix Table A.13). Only two were statistically significant. South Carolina CLTC found a significant reduction in reported disability at 6 months (not shown). Financial Model Channeling found statistically significant increases in reported disability at 6 and 12 months. These results are consistent with two conflicting interpretations. Both interpretations are based on the relation of the receipt of services to measures of disability in ADL, but they have very different substantive implications. The first is that receipt of services leads to overreporting of disability. Because most ADL questions ask about performance of ADL (e.g., "Does someone help you take a bath?"), they may measure those who receive help as more disabled, even if they are not. The second interpretation is that those who receive services are either more dependent or in fact more disabled as a result of getting help -- when individuals do less for themselves either psychological dependence may develop or skills may atrophy.19
The South Carolina CLTC and Financial Model Channeling results, although in opposite directions, are both consistent with either interpretation. Because South Carolina CLTC reduced nursing home use without large increases in community service use, clients probably got less help with ADL than they would have without the intervention. In contrast, because Financial Model Channeling substantially increased community service use without reducing nursing home use, its clients got more help than controls. Under the overreporting interpretation, both results are artifacts. South Carolina CLTC's reduction in measured disability reflects the change in reporting due to the reduction in help from nursing home staff because more clients are in the community. Financial Model Channeling's increase in measured disability reflects a change in reporting in the opposite direction due to the substantial increase in the provision of community services that increased help with ADL. Under the dependence interpretation, both results reflect real changes in functioning in opposite directions due to the opposite effects of the two demonstrations on receipt of help with ADL.
Although evidence to distinguish between the two interpretations is lacking,20 our own view is that the apparent effects on disability reflect, at least in part, measurement error. Further research would be required, however, to determine which interpretation is correct.
Results of the quasi experiments are consistent with those of the randomized experiments. Nursing Home without Walls, which reported a very large reduction in nursing home use, found significant reductions in disability in ADL. New York City Home Care, which reported a substantial increase in community service costs but no significant effect on nursing home use, reported a significant increase in disability.21
Five randomized experiments also analyzed impairment of IADL (not shown). Only one (Florida Pentastar) reported an increase in IADL impairment, a result which could be affected by noncomparable data collection. Four (Georgia AHS, South Carolina CLTC, Channeling, and OPEN) found no effect. Thus there is little evidence of any effect on impairment of IADL. Because questions on IADL typically measure capacity rather than performance, the measurement problems discussed above for ADL do no apply to IADL. (Results for the quasi experiments are inconsistent: New York City Home Care reported increased impairment in IADL's where as On Lok reported decreased impairment.)
Finally, only two evaluations examined days restricted to bed (not shown). San Diego LTC and Basic model Channeling found significant reductions in restricted days six months after enrollment. In both cases the reductions were small and did not persist at 12 months, suggesting that there may have been a small short-term reduction in disability that restricted clients to bed.
Life Satisfaction/Morale. Global measures of psychological well-being ranged from single questions concerning overall life satisfaction (e.g., "In general, how satisfying do you find the way you are spending your life these days?") to multiple-item scales (e.g., the Philadelphia Geriatric Center's scale, which had a dozen items including whether life is worth living, whether there is a lot to be sad about, whether you have pep, etc.).
All six randomized experiments that analyzed global life satisfaction reported that treatment group life satisfaction was higher than that of the control group in at least one period, but the differences were generally small (appendix Table A.14). They were statistically significant for NCHSR Homemaker and Combined Models (based on comparison of the treatment group members who receive d project services with control group members who did not receive similar services), San Diego LTC (at 6 months, not shown) both models of Channeling (but only on some measures). (On Lok, the only quasi experiment to analyze a related measure, psychological requirements of living, also reported a significant increase.)
Taken together, this provides some support for the hypothesis that case-managed community care improves the global life satisfaction of its clients. Given the difficulty of defining and measuring psychological well-being, however, the magnitude of the effect and its ultimate value are impossible to assess.
Expansion of case management and community care might also be expected to improve the well-being of informal caregivers. Channeling analyzed caregiver life satisfaction, confirming this expectation. Both Channeling models significantly increased the percentage of primary informal caregivers who answered "completely satisfying" or "pretty satisfying" to the question: "In general, how satisfying do you find the way you are spending your life these days?"
Longevity. Case-managed community care may not be a strong enough intervention to affect longevity, but two countervailing effects are possible. On the one hand, risk that medical conditions that would be detected and treated in a nursing home will go untreated in the community could increase the risk of death. Since there was little evidence of substitution of community care for nursing home care, this hypothesis is unlikely to hold. On the other hand, case manager monitoring of medical conditions of those in the community and reducing forced relocations to nursing homes may reduce the risk.
Table 6 presents treatment and control group mortality rates one year after enrollment. Death rates were high, ranging among the randomized control groups from 7 percent to 35 percent. The variation is generally associated with the level of disability of the clients served.
Of the randomized experiments, treatment group death rates were 2 percentage points higher than control group rates in one case (OPEN); equal in a second (Financial Model Channeling); but lower in all the rest, with differences ranging from 1 to 8 percentage points. Only the eight-percentage-point reduction of Georgia AHS was statistically significant, however. Together these results provide weak evidence that longevity may be slightly increased by expanded case management and community care.
Whether the risk of dying is increased by substituting community for nursing home care was tested only by South Carolina CLTC, which did significantly reduce nursing home use. Its mortality rate was two percentage points lower for the treatment group than for the control group. Although this is not statistically significant and is an overall average comprised of some who would have been in a nursing home in the absence of the intervention and some who would have been in the community, it is nonetheless not consistent with large increases in risk of death due to the substitution of community care for nursing home care.
The results of the quasi experiments are generally consistent with the randomized experiments: two small, nonsignificant increases and three large decreases, one of which was significant.
| TABLE 6: Mortality Rates after One Year (percentage) | ||||
| Demonstration (source) | Treatment Mean | Control Mean | Difference In Means | |
| RANDOMIZED EXPERIMENTS | ||||
| Worcester Home Care (Sherwood, Morris, and Gutkin, 1975, p.24) | 13 | 16 | -3 | |
| NCHSR Day Care/Homemaker (Weissert, Wan, and Livieratos, 1980, pp. 44, 46, 48) | ||||
| Day Care | 17 | 18 | -1 | |
| Homemaker | 30 | 35 | -5 | |
| Combined | 21 | 24 | -3 | |
| Georgia AHS (Skellie et al., 1982, p. 232) | 13 | 21 | -8* | |
| Wisconsin CCO (Seidl et al., 1980, p. 205) | 6 | 8 | -2 | |
| Project OPENa (Haskins et al., 1985, p. 152) | 9 | 7 | 2 | |
| South Carolina LTC (Blackman et al., 1985, p. 48) | 30 | 32 | -2b | |
| Florida Pentastar (Maurer et al., 1984, p. 84) | 8 | 11c | -3b | |
| San Diego LTCa (Haskins et al., 1985, p. 149) | 21 | 23 | -2 | |
| Channeling (Wooldridge and Schore, 1986, p. F.26) | ||||
| Basic Model | 28 | 30 | -2 | |
| Financial Model | 27 | 27 | 0 | |
| QUASI EXPERIMENTS | ||||
| Triage (Shealy, Hicks, and Quinn, 1979, p. 373) | 8 | 7 | 1b | |
| On Loka (Haskins et al., 1985, p. 148) | 15 | 23 | -8 | |
| Nursing Home without Walls (Birnbaum et al., 1984, p. IV-45) | ||||
| Upstate | 12 | 22 | -10* | |
| New York City | 17 | 24 | -7 | |
| New York City Home Carea (Haskins et al., 1985, p. 144) | 17 | 15 | 2 | |
* Statistically significant at the 5 percent level. |
||||
E. CONCLUSION
Early research demonstrated that community care can be a cost-saving substitute for nursing home care for some individuals. That research concluded that for a particular individual nursing home care is more costly than community care until care needs reach a critical level. To the extent that financial incentives under Medicaid, lack of information about community services, or inability to manage those services result in nursing home placement of those with care needs below that critical level, caring for them in the community will reduce costs. Because people generally prefer to live in their own homes rather than in nursing homes, moreover, their life quality is likely to improve. The case managed community care demonstrations were based on this logic.
1. The Basic Findings
What the demonstrations have shown is that expanding publicly funded case management and community care does not reduce aggregate costs, and is likely to increase them--at least in the current long-term care service environment, which already provides some community care under Medicare, Medicaid, and other public programs. Small reductions in nursing home costs for some are more than offset by the increased costs of providing expanded community services to others who, even without expanded services, would not enter nursing homes. Program eligibility criteria can only imperfectly identify in advance those who would enter nursing homes without expanded services. Expanded community services can therefore not be limited only to those bound for more expensive nursing home care. Services also have to be provided to many who would live in the community in any case, but without the expanded services. Although costs are lower for some individuals who are cared for at lower cost in the community, aggregate costs increase because many in the community receive more services as a result of the expanded coverage.
An exception to this conclusion was the South Carolina Community Long-Term Care (CLTC) demonstration, which substantially reduced nursing home use. It essentially broke even with respect to public costs, but several conditions were responsible for this result. It identified a high-risk population by requiring Medicaid nursing home eligibility certified through a nursing home pre-admission screen. It achieved a relatively high rate of nursing home reduction -- 31 versus 0-24 percent for the other randomized experiments with complete nursing home use data. It kept community care costs low -- its case management cost was only $49 per client per month compared to a range of $85-145 for the other demonstrations for which data are available -- and it increased community service costs less than did most of the demonstrations.
A single demonstration in a single State cannot tell us whether these conditions can be replicated and maintained in an ongoing program; it can only suggest that it may be possible under some conditions to expand public financing of community care without increasing aggregate public costs. On balance, however, the demonstration experience suggests, that costs are likely to increase. This is because it is difficult to serve only those at high-risk of nursing home placement, large percentage reductions in placement rates are difficult to bring about, and it is costly to provide the level of community care that many feel is appropriate.
Although it is likely to increase aggregate costs, expanding public financing for case management and community services does appear to make people better off. Although the measures varied and are imperfect in many respects, the evidence presents a pattern of improved life quality. The magnitude of the increase and its value to society are difficult to assess -- indeed the measures do not support such an assessment. But some improvement in life quality does appear to result from the expanded services. It is wrong therefore to conclude that expanding public financing for community care is not cost effective -- costs are likely to go up, but so are the benefits.
Moreover, the limited available evidence suggests that the demonstrations did not cause wholesale substitution of publicly financed formal services for care provided informally by family and friends. Although some substitution appears to occur in the area of help with IADL, the extent of substitution is small -- certainly less than some had feared.
2. Cost Reductions Through Improved Targeting?
Our interpretation of the cost results -- that expanded community care benefits are likely to increase aggregate costs -- will not be universally accepted. Some will assert that improved targeting -- developing mechanisms for identifying and serving only those who would otherwise be placed in nursing homes at higher cost -- could result in interventions that reduce costs. There are several reasons why we believe that changes in the approach to targeting are not likely to reduce aggregate costs by substituting community care for nursing home care.22
First, the targeting issue is not new. The demonstrations have sought to varying extents to serve precisely this population. Failure to identify this population is not for lack of trying. Indeed, recent theoretical work suggests that the nursing home placement rates that were observed in the demonstrations may imply more accurate screening than generally understood (Greene 1986).
Second, demonstrations may overstate success in targeting. In a permanent program, participation rates of those not at risk of nursing home placement may increase over time both because more potential clients learn about the expanded benefits and how to assess them, and because case managers' commitment to enforcing eligibility criteria may weaken after the special demonstration. Neither was the case for the South Carolina CLTC demonstration, however, suggesting that it may be possible to maintain consistent targeting through quality control. Nonetheless, there is a risk that targeting success may diminish in an ongoing program.
Third, the research on differences in effects across subgroups had only limited results. They do not translate directly to changes in eligibility criteria that will reduce costs. Although reductions in nursing home use seem to be greater for some subgroups, the evidence is far from definitive, the cutoff levels for the definitions of the subgroups are not well-defined, and many of the subgroups appear to be quite small. The evidence from the community care demonstrations and research on the determinants of nursing home use is that nursing home placement is very difficult to predict.
Finally, the cost difference between community care and nursing home care may not be large for individuals at high risk of nursing home placement. Although the cost advantage of community care is large for those with minimal care needs, it diminishes as care needs increase -- eventually reversing for those with extreme care needs. Because the risk of nursing home placement also increases with need for care, the cost advantage of community care diminishes as nursing home risk increases. The cost saving from serving those at high risk therefore may not be great, and is certainly below the community-nursing home cost difference for the average impaired person in the community.
This does not imply that the population served is unimportant. On the contrary, a central lesson of the demonstrations is the importance of mechanisms that determine who is served: the referral and outreach process, eligibility criteria and their application, and rules and procedures for termination. But in our judgment, cost reductions through improved targeting of expanded community care benefits are not likely.
3. Implications for the Policy Debate and Research
The demonstration results should alter the nature of the debate about expanding case managed community care. Expansion of community care must be justified on not the basis of its cost savings but on its benefits to the disabled elderly and the family and friends who care for them. Proper evaluation requires consideration not only of the monetary costs of expanded financing of community care but also of the nonmonetary benefits. The issue then becomes who should get publicly financed community care and how much, and how an efficient long-term care system care can be designed.
Because expanded community care has usually been justified on the basis of cost savings, relatively little thought has been given to who should receive publicly financed community care. In light of the demonstration results, the issue of eligibility criteria changes from one of targeting efficiency -- for whom will cost reduction through substitution of community care for nursing home care be greatest -- to one of equity -- who deserves the limited community care that society can pay for. Should clients pass a means test to be eligible, and if so, should family income be counted? What level of physical or mental disability defines need? How is it measured, how are disputes adjudicated, and how often is it reviewed? Does the availability of family and friends to help with care affect eligibility?
These questions pose extraordinarily difficult societal choices. How much service should be provided is ultimately a political decision. But research on the extent of unmet need in the community, the cost of alternative care options, and the design of an efficient system to provide long-term care would inform the decisions.
Measures of poverty and health status in the nation, although imperfect, are routinely collected. These indicators provide a periodic reading on the state of the nation's health and welfare and inform the political debate on policy. Measures of unmet need for care due to chronic disability have not been developed. Defining and measuring need and developing standards of care are not simple tasks. But regularly collected national data on how much care is already being received and on the extent of unmet need would usefully inform this important policy choice.
The cost of alternative long-term care policies will be central to the debate. Estimates of costs require substantial advances in our understanding of the demand for community and nursing home care. How large are various potential eligibility groups? How large will they grow over time? How responsive is demand to the price paid by the individual, the relative price of community and nursing home care, and the characteristics of the service package covered? How does the availability of informal care affect the demand for nursing homes and formal community care? How will the availability of informal care change over time? Research on these questions is essential if believable cost estimates are to inform the debate.
Finally, regardless of the aggregate level of public support, efficiency in the delivery of services should be a central goal. At the level of system design, nursing home and community care policies should be integrated. We need to understand the interdependence between the two types of long-term care policy. For example, how do limitations on nursing home construction or reimbursement rates affect the cost of community care programs? We also need to understand more about alternative financing mechanisms -- How do different financing mechanisms such as entitlements based on disability as certified by a health professional, case manager determination based on needs assessment, optional coverage with cost-sharing, or capitation through social health maintenance organizations -- affect costs and client outcomes?
At the level of program operations, a great deal is to be learned about the efficiency of the technology of providing care. Can case management be used to ensure that cost-minimizing care plans are implemented? How can error rates in eligibility determination be reduced? Which care packages are more effective for different types of clients? How should care for acute and chronic conditions be coordinated and managed, particularly for very costly clients? For what individual cases is community care more costly than nursing home care? What provider payment mechanisms encourage efficient production of specific services? Community care is here to stay, and some research should be directed at improving the efficiency of care delivery.
The contribution of the community care demonstrations, in short, should be to move the research and policy debate about community care the next step forward -- beyond the question of whether expanded public financing of community care will reduce costs to how much community care society is willing to pay for, who should receive it, and how it can be delivered efficiently. To inform that debate, research is needed to provide better information on the extent of unmet need, the cost of alternative policies, and efficient delivery of long- term care.
APPENDIX TABLES
| TABLE A.1: Service Coverage Expanded under Demonstration Waivers | ||||||
| Demonstration (evaluation period) | Physicians, Hospitals, and Nursing Homes | Home Health Care | Other In-Home Care | Transportation and Meals | Other | |
| Worcester Home Care (1973-1975) | --- | Visiting nurse | Homemaker Chore Escort | Transportation | Linen | |
| NCHSR Day Care/ Homemaker (1975-1977) | ||||||
| Day Care | --- | --- | --- | Transportationa | Day care | |
| Homemaker | --- | --- | Homemaker Personal care Escort Help with shopping | Transportationa | --- | |
| Combined | --- | --- | Homemaker Personal care Escort Help with shopping | Transportationa | Day care | |
| Triage (1976-1979) | --- | Skilled nursing Therapies Home health aide | Homemaker | Home-delivered meals | Dental care Glasses Hearing aids | |
| Washington CBC (1976-1977) | --- | --- | Personal care Chore | Transportation Home-delivered meals Congregate meals | Day care | |
| ACCESS (1977-1980) | --- | --- | Homemaker Chore Friendly visiting | Transportation | Respite care Foster care Housing improvements | |
| Georgia AHS (1977-1980) | --- | Skilled nursing Therapies Home health aide | Homemaker Personal care | Home-delivered meals | Day care | |
| Wisconsin CCO (1978-1980) | --- | Skilled nursing Therapies Home health aide | Personal care Companion | Transportation Home-delivered meals | Day care Respite care | |
| On Lok (1979-1983) | Physician Hopsital Nursing home | Skilled nursing Therapies Home health aide | Homemaker Personal care | Transportation Home-delivered meals | Day care Hospice Nutrition Group exercise | |
| Project OPEN (1980-1983) | --- | Skilled nursing Therapies Home health aide | Homemaker Chore | Transportation Home-delivered meals | Day care Mental health counseling Respite care Interpreter | |
| MSSP (1980-1983) | --- | Skilled nursing | Personal care In-home supportive services | Transportation Home-delivered meals | Day care Protective services Legal services Housing Discretionaryb | |
| South Carolina LTC (1980-1984) | --- | Therapies Medical social services | Personal care | Home-delivered meals | Day care Respite care | |
| Nursing Home without Walls | --- | Skilled nursing Therapies Home health aide Medical social service | Homemaker | Transportation Home-delivered meals Congregate meals | Respite care Moving assistance Housing improvements Nutrition counseling | |
| New York City Home Care (1980-1983) | --- | --- | Homemaker Personal care | Transportation | Prescription drug | |
| Florida Pentastar (1981-1983) | --- | Skilled nursing Therapies Home health aide | Personal care | Transportation (medical) | Day care Respite care Pest control | |
| San Diego LTC (1981-1983) | --- | Skilled nursing Home health aide | Homemaker | Transportation Home-delivered meals | Day care Health education | |
| Channeling (1982-1984) | --- | Skilled nursing Therapies Home-health aide | Homemaker Personal care Chore Companion | Transportation Home-delivered meals | Day care Respite care Foster care Mental health services Medical supplies and equipment Housing assistance Discretionaryc | |
|
||||||
| TABLE A.2: Service Authorization Power, Cost Controls, and Expenditures | ||||
| Demonstration (evaluation period) | Service Authorization Powera | Cost Maximum (percentage of nursing home costs) | Cost Sharing | |
| Worcester Home Care (1973-1975) | Services expanded under waiver | None | No | |
| NCHSR Day Care/ Homemaker (1975-1977) | Services expanded under waiver | None | No | |
| Triageb (1976-1979) | Services expanded under waiver | None | No | |
| Washington CBC (1976-1977) | Services expanded under waiver Title XX services | None | No | |
| ACCESSb (1977-1980) | Medicaid home health Medicaid nursing home Services expanded under waiver | 75 (individual maximum) | Yes | |
| Georgia AHS (1977-1980) | Services expanded under waiver | 85 (individual maximum) | No | |
| Wisconsin CCO (1978-1980) | Services expanded under waiver | 60 (individual maximum) | No | |
| On Lokb (1979-1983) | All Medicare services Services expanded under waiver | None | No | |
| Project OPEN (1980-1983) | Services expanded under waiver | None | No | |
| MSSPc (1980-1983) | Services expanded under waiver | 70 (individual maximum) | No | |
| South Carolina LTC (1980-1984) | Medicaid nursing home Services expanded under waiver | 75 (individual maximum) | Yes | |
| Nursing Home without Walls (1980-1983) | Services expanded under waiver Medicaid home health | 75 (individual maximum) | No | |
| New York City Home Care (1980-1983) | Services expanded under waiver | None | No | |
| Florida Pentastar (1981-1983) | Services expanded under waiver | None | No | |
| San Diego LTC (1981-1983) | Services expanded under waiver | None | No | |
| Channeling (1982-1984) | ||||
| Basic Model | Services expanded under special demonstration budget (no waiver) | Limited by total budget | Yes | |
| Financial Model | Medicaid home health Medicare home health Services expanded under waiver | 60 (average caseload maximum) 85 (individual maximum) | Yes | |
|
||||
| TABLE A.3: Eligibility Criteria | |||
| Demonstration (evaluation period) | Minimum Age | Program Eligibility | Functioning/Service Need |
| Worcester Home Care (1973-1975) | 57 | Medicare or Medicaid if institutionalizeda | Living in the community with high level of need, or Likely to be institutionalized unless services are provided, or Living in a nursing home but could return to the community |
| NCHSR Day Care/ Homemaker (1975-1977) | 18b | Medicare | Need health care services to restore or maintain functional ability, and Hospitalized at least three days in prior two weeksc |
| Triage (1976-1979) | 60 | Medicare | None |
| Washington CBC (1976-1977) | 18 | Medicaid or Title XX | Discharged from a hospital and would be placed in a nursing home except for the program, or Resides in the community but with severe disabilities in ADL, or In a nursing home but no longer needs nursing services and could be returned to be community |
| ACCESS (1977-1980) | 18 | Medicaid | Certified eligible for nursing home care under Medicaid (as determined by preadmission assessment by the project) |
| Georgia AHS (1977-1980) | 50 | Medicaid | Previously institutionalized, or Applied to a nursing home in the past month, or Certified eligible for nursing home care under Medicaid (as determined by the Georgia Medical Care Foundation) |
| Wisconsin CCO (1978-1980) | 18 | Medicaid | Score 20 or less on the Geriatric Functional Rating Scale |
| On Lok (1979-1983) | 55 | Medicared | Certified eligible for nursing home care under Medicaid (as determined by the project) |
| Project OPEN (1980-1983) | 65 | Medicare | Be sufficiently cognitive to respond to interviewer questions, and Have a medical problem, and Need assistance to function independently, and Have been in a hospital or skilled nursing facility (SNF) in the last 30 days, or have been identified as needing SNF level care, or have suffered a personal crisis (such as the death of spouse) in the past year, or require assistance with personal care, or be judged by the interviewer to have difficulty living independently |
| MSSP (1980-1983) | 65 | Medicaid | Nursing home application or placement, or Recent hospitalization, or Over 75, or Mental disorientation, or Loss of major caregiver |
| South Carolina LTC (1980-1984) | 18 | Medicaid or Medicaid if institutionalizeda | Certified eligible for nursing home care under Medicaid (as determined by preadmission assessment by the project)e |
| Nursing Home without Walls (1980-1983) | None | Medicaid or Medicaid if institutionalizeda | Certified eligible for nursing home (as determined by the project), and Have informal supports available to provide supplemental care |
| New York City Home Care (1980-1983) | 65 | Medicare | Chronically ill or functionally disabled to the extent that assistance is needed to perform personal care, and Have unmet needs that could be meet with 8 to 20 hours of personal care per week |
| Florida Pentastar (1981-1983) | 60 | Medicaid | At risk of institutional placement within one year or In need of project services |
| San Diego LTC (1981-1983) | 65 | Medicare | Unable to maintain self at home without assistance, or At risk of institutional placement, or At risk of frequent acute hospital admissions, or Have stabilized chronic or nonhome bound status which restricts them from receiving traditionally funded home health care, but in need of long-term care |
| Channeling (1982-1984) | 65 | Medicaref | Functionally impaired as measured by two ADL disabilities or three IADL impairments or one ADL and two IADL impairments, and Need help in two or more categories of service for six months or have a fragile informal support system that may no longer be able to provide needed care, and If institutionalized, be certified for discharge within three months |
|
|||
| TABLE A.4: Data Collection | |||
| Demonstration (evaluation period) | Months of Follow-up | Data Sources | Follow-up Interview Data |
| Worcester Home Care (1973-1975) | 12 | Individual interviews Project records Death records | Comparable |
| NCHSR Day Care/ Homemaker (1975-1977) | 3, 6, 9, 12 | Individual interviews Medicare records Project records | Comparable |
| Triage (1976-1979) | 6, 12, 18, 24 | Individual interviews Diaries Project records Medicare records Medicaid records | Noncomparable |
| Washington CBC (1976-1977) | 15 | Individual interviews Project records Medicaid records Welfare records Provider records | --- |
| ACCESS (1977-1980) | 24 | Department of Social Service records | --- |
| Georgia AHS (1977-1980) | 6, 12, 18, 24 | Individual interviews Project records Medicaid records with Medicare crossover | Comparable |
| Wisconsin CCO (1978-1980) | 6, 12 | Individual interviews Medicaid records Death records | Noncomparable |
| On Loka (1979-1983) | 6, 12 | Individual interviews Project records Provider records | Comparable |
| Project OPENb (1980-1983) | 6, 12 | Individual interviews Project records Provider records | Noncomparable |
| MSSP (1980-1983) | 6, 12 | Individual interviews Medicaid records Medicare records | Noncomparable |
| South Carolina LTC (1980-1984) | 3, 6, 12, 18, 24, 36 | Individual interviews Project records Medicaid records Medicare records | Comparable |
| Nursing Home without Walls (1980-1983) | 6, 12 | Individual interviews Medicaid records Medicare records Food stamp records SSI records | Comparablec |
| New York City Home Care (1980-1983) | 6, 12 | Individual interviews Medicaid records Medicare records | Noncomparable |
| Florida Pentastar (1981-1983) | 12, 18 | Individual interviews Medicaid records Medicare records Food stamp records | Noncomparable |
| San Diego LTCe (1981-1983) | 6, 12 | Individual interviews Medicare records | Comparable |
| Channeling (1982-1984) | 6, 12, 18 | Individual interviews Project records Medicaid records Medicare records Provider records Death records Caregiver interviews | Comparablec |
|
|||
| TABLE A.5: Differences in Effects on Nursing Home Use across Population Subgroups | |||
| Demonstration (source) | Measures | Subgroups | Differences in Effects |
| RANDOMIZED EXPERIMENTS, ALL USE | |||
| Worcester Home Care (Sherwood, Morris, and Gutkin, 1975, Appendix 5.3, pp. 10, 29, 30) | Percentage of time spent in a nursing home, months 1-12 | Eligible for Medicaid only if institutionalized (vs. not) | No difference |
| Risk of institutionalizationa | Significant reduction for group at risk of institutionalization with high unmet needs | ||
| Georgia AHS (Skellie et al., 1982, pp. 199, 201) | Medicaid nursing home costs, months 1-12, 1-24 | Recommended service category (supportive housing, medical day care, in-home services) | Pattern of large reductions for those recommended for supportive housing (both months 1-12 and 1-24). Significant increase for those recommended for in-home services for months 1-24 |
| South Carolina LTCb (Brown et al., 1985, part III, pp. 109-115, 130-131) | Whether admitted to a nursing home, months 1-6, 1-12, 1-24, 1-36 | Disability in ADL (scores of 0-3, 4-6, 7-9, and 10-12) | Pattern of largest reductions for the two intermediate categories of disability |
| Eligible for Medicaid only if institutionalized (Medicaid vs. SSI but not Medicaid) | Pattern of larger reductions among those eligible for Medicaid | ||
| Recent hospitalization (hospitalized vs. in community)c | Pattern of larger reductions for those in the community | ||
| Level of nursing home care (SNF vs. ICF) | No differences | ||
| Availability of informal support (informal care only, both formal and informal, formal care only, none)d | Pattern of smaller reductions for those without any initial support and larger reductions for the small group with only formal care | ||
| Channelinge (Grannemann, Grossman, and Dunstan, 1986, pp. 78-79, 81-82, 85, 87, 89-90, 93-94, A.17-A.22) | Nursing home days, expenditures, and percent admitted, months 1-6, 7-12f | Disability in ADLg | Basic model: no differences Financial model: for months 1-6 nursing home days were increased for those with extreme disability and were decreased for those moderately and severely disabled; pattern continued for months 7-12 but was not significant |
| Incontinence (incontinent, help with device, continent) | Basic model: no differences Financial model: for months 7-12, nursing home days were reduced for the incontinent subgroup and increased for the small subgroup requiring help with a device (catheter or colostomy bag) | ||
| Cognitive impairment | No differences | ||
| Medicaid eligibility (eligible, eligible within 3 months, not eligible within 3 months) | Basic model: for both months 1-6 and 7-12 nursing home days were increased for those eligible and were decreased for those not eligible; analysis of combined subgroup categories suggests the increase among the Medicaid eligible was among those who were also on nursing home waiting lists Financial model: no differences | ||
| Living arrangement/informal support (lives: with child, with other, alone with support, alone without support) | Basic model: no differences Financial model: for months 1-6, nursing home days and the percent admitted were reduced for those who lived alone, especially those without any informal support | ||
| Unmet needs (0-2, 3, 4-5) | Basic model: no differences Financial model: for both months 1-6 and 7-12, nursing home days were reduced for those with low reported unmet needs | ||
| Referral source (in a nursing home, in hospital or referral by hospital or nursing home, wait-listed/applied to nursing home, referred by home health agency, self/family/other referral) | Both models: nursing home days were reduced for the small group in a nursing home at enrollment (significant months 1-6 and 7-12 under the basic model and months 7-12 under the financial model using the combined category approach with a consistent pattern for months 1-6 under the financial model) Basic model: for months 7-12 nursing home days were increased for those who had applied or were on a waiting list for a nursing home; analysis of combined subgroup categories suggests this was among the Medicaid eligible or near-eligible Financial model: analysis of combined subgroups found reductions in nursing home days for those who had applied or were on a waiting list for a nursing home and were not eligible or near eligible for Medicaid for both months 1-6 and 7-12 | ||
| Risk of institutionalization (low, moderate, high, extreme, based on regression) | Basic model: for months 1-6 nursing home days and the percent admitted were reduced for the high risk subgroup Financial model: no differences (pattern of increasing reductions in nursing home days with increasing risk for months 1-6) | ||
| RANDOMIZED EXPERIMENTS, MEDICARE USE ONLY | |||
| NCHSR Day Care/ Homemaker (Weissert, Wan, and Livieratos, 1980, pp. 43-44, 46, 48) | Nursing home days | Age | No differences |
| Gender | No differences | ||
| Race (white, nonwhite) | Day care model: significant reduction among whites Homemaker mode; no difference Combined model: no difference | ||
| Disability in ADL (none, bathing or dressing; eathing, transfer, toileting, or continence) | Day care model: nursing home days were reduced for those dependent in eating, transfer, toileting or continence Homemaker mode; no difference Combined model: no difference | ||
| Incontinence | Day care model: nursing home days were reduced for the incontinent Homemaker mode; no difference Combined model: no difference | ||
| Living arrangement | No differences | ||
| Diagnosis | No differences | ||
| Recent hospitalizationh | No differences | ||
| San Diego LTC (Haskins et al., 1985, Appendix A, pp. 103-105, 108-111) | Nursing home days and expenditures, months 1-6, 1-12 | Disability in ADL | No differences |
| Cognitive impairment | No differences | ||
| Living arrangement | No differences | ||
| Social resources | No differences | ||
| Loneliness | No differences | ||
| QUASI EXPERIMENTS, ALL USE | |||
| On Lok (Haskins, et al., 1985, Appendix A, p. 104) | Nursing home days and expenditures, months 1-12 | Institutionalization (in a nursing home vs. in the community) | Pattern of larger reductions for those in a nursing home |
| MSSP (Miller et al., 1984, p. 1.74) | Expected nursing home days per year | Risk of institutionalization (low, moderate, high based on regression) | Pattern of greatest expected saving of nursing home days for those at high risk of institutionalization |
| QUASI EXPERIMENT, MEDICAID AND MEDICARE USE ONLY | |||
| Nursing Home without Walls (Birnbaum et al., 1984, p. IV.50) | Nursing home days, months 1-12 | Disability in ADL (0-3, 4-6) | Update: larger reduction for more disabled New York City: no difference |
| Level of nursing home care (SNF vs. HRF) | Update: larger reduction for SNF eligibles New York City: smaller reduction for SNF eligibles | ||
| Living arrangement/age (over 75 and living alone vs. under 75 or living with others) | Update: no difference New York City: larger reduction for those over 75 and living alone | ||
| Prognosis (will recover vs. not) | Update: smaller reduction for those expected to recover New York City: Larger reduction for those expected to recover | ||
| Risk of institutionalization (above vs. below mediam based on regression) | Update: larger reduction among those at greater risk New York City: no difference | ||
| QUASI EXPERIENCE, MEDICARE USE ONLY | |||
| New York City Home Care (Haskins et al., 1985, Appendix A, p. 106) | Nursing home days and expenditures, months 1-8 | Race | No differences |
| Cognitive impairment | No differences | ||
| Number in household | No differences | ||
| Disability in ADL | No differences | ||
| Unmet ADL needs | No differences | ||
Significance refers to tests of treatment-control differences for each subgroup category separately. Tests of equality of differences across subgroup categories were not performed. Significance tests were generally not reported. No difference refers to the absence of an apparent pattern of treatment-control differences across subgroups. |
|||
| TABLE A.6: Monthly Costs, by Type of Service and Payor (1984 dollars) | ||||||||||||
| Demonstration | Nursing Home | Hospital | Community | Other Medical | Total | |||||||
| Treatment | Control | Treatment | Control | Treatment | Control | Treatment | Control | Treatment | Control | |||
| RANDOMIZED EXPERIMENTS | ||||||||||||
| Worcester Home Care | ||||||||||||
| Project | 0 | 0 | 0 | 0 | 54 | 0 | 0 | 0 | 54 | 0 | ||
| NCHSR Day Care/Homemaker | ||||||||||||
| Day Care | ||||||||||||
| Project | 0 | 0 | 0 | 0 | 281 | 0 | 0 | 0 | 281 | 0 | ||
| Medicare | -- | -- | -- | -- | -- | -- | -- | -- | 533 | 534 | ||
| Total | -- | -- | -- | -- | 281 | -- | -- | -- | 813 | 534 | ||
| Homemaker | ||||||||||||
| Project | 0 | 0 | 0 | 0 | 232 | 0 | 0 | 0 | 232 | 0 | ||
| Medicare | -- | -- | -- | -- | -- | -- | -- | -- | 864 | 786 | ||
| Total | -- | -- | -- | -- | 232 | -- | -- | -- | 1095 | 786 | ||
| Combinedb | ||||||||||||
| Project | 0 | 0 | 0 | 0 | 243 | 0 | 0 | 0 | 243 | 0 | ||
| Medicare | -- | -- | -- | -- | -- | -- | -- | -- | 1000 | 847 | ||
| Total | -- | -- | -- | -- | -- | -- | -- | -- | 1243 | 847 | ||
| Georgia AHS | ||||||||||||
| Project | 0 | 0 | 0 | 0 | 131 | 0 | 0 | 0 | 131 | 0 | ||
| Medicaid | 72 | 75 | 29 | 11 | 5 | 6 | 37 | 50 | 143 | 143 | ||
| Medicare | 1 | 0 | 73 | 78 | 1 | 1 | 30 | 31 | 104 | 11 | ||
| Total | 72 | 75 | 101 | 90 | 137 | 7 | 67 | 82 | 377 | 254 | ||
| Wisconsin CCO | ||||||||||||
| Project | 0 | 0 | 0 | 0 | 206 | 0 | 0 | 0 | 206 | 0 | ||
| Medicaid | -- | -- | -- | -- | -- | -- | -- | -- | 309 | 508 | ||
| Total | -- | -- | -- | -- | -- | -- | -- | -- | 515 | 508 | ||
| Project OPENc | ||||||||||||
| Project | -- | -- | -- | -- | -- | -- | -- | -- | 362 | 0 | ||
| Medicare | -- | -- | -- | -- | -- | -- | -- | -- | 577 | 823 | ||
| Other | -- | -- | -- | -- | -- | -- | -- | -- | 24 | 205 | ||
| Total | -- | -- | -- | -- | -- | -- | -- | -- | 963 | 1026 | ||
| South Carolina LTC | ||||||||||||
| Project | 0 | 0 | 0 | 0 | 121 | 0 | 0 | 0 | 121 | 0 | ||
| Medicaid | -- | -- | -- | -- | -- | -- | -- | -- | 341 | 472 | ||
| Medicare | -- | -- | -- | -- | -- | -- | -- | -- | 229 | 204 | ||
| Total | -- | -- | -- | -- | -- | -- | -- | -- | 691 | 676 | ||
| Florida Pentastar | ||||||||||||
| Project | 0 | 0 | 0 | 0 | 202 | 19d | 0 | 0 | 202 | 19 | ||
| Food stamps | 0 | 0 | 0 | 0 | 43 | 42 | 0 | 0 | 43 | 42 | ||
| Housing assistance | 0 | 0 | 0 | 0 | 27 | 28 | 0 | 0 | 27 | 28 | ||
| Medicare/ Medicaid | -- | -- | -- | -- | -- | -- | -- | -- | 207 | 199 | ||
| Other public | 0 | 0 | 0 | 0 | 18 | 21 | 0 | 0 | 18 | 21 | ||
| Total | -- | -- | -- | -- | 290 | 110 | -- | -- | 497 | 312 | ||
| San Diego LTC | ||||||||||||
| Project | 0 | 0 | 0 | 0 | 478 | 0 | 0 | 0 | 478 | 0 | ||
| Medicare | 5 | 8 | 444 | 473 | 13 | 63 | -- | -- | 462 | 543 | ||
| Medicaid | -- | -- | -- | -- | -- | -- | -- | -- | 78 | 129 | ||
| Total | 5 | 8 | 444 | 473 | 491 | 63 | -- | -- | 1018 | 672 | ||
| Channeling | ||||||||||||
| Basic Model | ||||||||||||
| Project | 0 | 0 | 0 | 0 | 108 | 0 | 0 | 0 | 108 | 0 | ||
| Medicare | 11 | 15 | 440 | 426 | 128 | 113 | 116 | 108 | 695 | 660 | ||
| Medicaid | 67 | 62 | 17 | 23 | 27 | 30 | 13 | 16 | 124 | 131 | ||
| Other public | 0 | 1 | 0 | 0 | 63 | 79 | 0 | 0 | 63 | 80 | ||
| Clients and families | 45 | 68 | 29 | 28 | 324 | 341 | 24 | 22 | 422 | 459 | ||
| Total | 123 | 145 | 486 | 477 | 650 | 563 | 153 | 145 | 1412 | 1330 | ||
| Financial Model | ||||||||||||
| Project | 0 | 0 | 0 | 0 | 408 | 0 | 0 | 0 | 408 | 0 | ||
| Medicare | 17 | 15 | 597 | 575 | 101 | 181 | 162 | 157 | 877 | 928 | ||
| Medicaid | 60 | 59 | 35 | 36 | 14 | 30 | 17 | 15 | 125 | 140 | ||
| Other public | 1 | 1 | 0 | 0 | 33 | 67 | 0 | 0 | 34 | 68 | ||
| Clients and families | 54 | 66 | 43 | 39 | 308 | 322 | 29 | 29 | 434 | 456 | ||
| Total | 132 | 141 | 675 | 650 | 864 | 600 | 208 | 201 | 1878 | 1592 | ||
| QUASI EXPERIMENTS | ||||||||||||
| Triage | ||||||||||||
| Totale | 35 | 2 | 213 | 124 | 93 | 18 | 114 | 47 | 455 | 191 | ||
| On Lok | ||||||||||||
| Project | 0 | 0 | 0 | 0 | 98 | 0 | 0 | 0 | 98 | 0 | ||
| All othere | 1443 | 679 | 469 | 1145 | 387 | 263 | 421 | 110 | 1420 | 2198 | ||
| Total | 1443 | 679 | 469 | 1145 | 485 | 263 | 421 | 110 | 1518 | 2198 | ||
| MSSP | ||||||||||||
| Medicaid | -- | -- | -- | -- | -- | -- | -- | -- | 248 | 164 | ||
| Medicare | -- | -- | -- | -- | -- | -- | -- | -- | 906 | 362 | ||
| Total | -- | -- | -- | -- | -- | -- | -- | -- | 1154 | 606 | ||
| Nursing Home without Walls | ||||||||||||
| Upstate | ||||||||||||
| Medicare | -- | -- | -- | -- | -- | -- | -- | -- | 299 | 224 | ||
| Medicaid | -- | -- | -- | -- | -- | -- | -- | -- | 533 | 894 | ||
| Total | -- | -- | -- | -- | -- | -- | -- | -- | 825 | 1117 | ||
| New York City | ||||||||||||
| Medicare | -- | -- | -- | -- | -- | -- | -- | -- | 518 | 528 | ||
| Medicaid | -- | -- | -- | -- | -- | -- | -- | -- | 1143 | 539 | ||
| Total | -- | -- | -- | -- | -- | -- | -- | -- | 1633 | 1159 | ||
| New York City Home Care | ||||||||||||
| Project | -- | -- | -- | -- | 551 | 0 | -- | -- | 551 | 0 | ||
| Medicare | 3 | 10 | 554 | 527 | 47 | 50 | -- | -- | 603 | 598 | ||
| Medicaid | -- | -- | -- | -- | -- | -- | -- | -- | 60 | 124 | ||
| Total | -- | -- | -- | -- | -- | -- | -- | -- | 1215 | 713 | ||
NOTE: Costs per month were calculated by dividing costs reported for the time period analyzed by the number of months in the period. All dollar amounts are converted to constant dollars for the first quarter of 1984, using the GNP implicit price deflator. Detail may not sum to total due to rounding.
|
||||||||||||
| TABLE A.7: Informal Caregiving | |||
| Demonstration | Measure | Results | |
| RANDOMIZED EXPERIMENTS | |||
| Worcester Home Care (Sherwood, Morris, and Gutkin, 1975, pp. 49, B.10) | Care recipient evaluation of how much their children do (2 items) | No difference | |
| Interviewer judgment concerning the capacity of informal caregiver to give care | No difference | ||
| Project OPEN (Sklar and Weiss, 1983, p. 127) | Receipt of support from the informal system | No difference | |
| South Carolina LTC (Blackman, Learner, and Witherspoon, 1985, p. III.133) | Receipt of informal care | Increases at 6, 12, and 24 monthsa | |
| San Diego LTC (Haskins et al., 1985, pp. 246-247) | Number of times per week assisted with: ADL tasks IADL tasks | No difference Decreases at 12 months | |
| Channeling (Christianson, 1986, Chapters IV-V) | |||
| Basic Model | Receipt of informal care: ADL tasks IADL tasks | No difference No difference | |
| Number of visits per week to provide informal care | No difference | ||
| Hours of care per week from primary caregiver | No difference | ||
| Financial Control Model | Receipt of informal care: ADL tasks IADL tasks | No difference Decreases at 6 and 12 monthsb | |
| Number of visits per week to provide informal care | No difference | ||
| Hours of care per week from primary caregiver | No difference | ||
| QUASI EXPERIMENT | |||
| New York City Home Care (Haskins et al., 1985, pp. 251, 254-256) | Number of days per week assisted with ADL tasks | Decrease at 6 and 12 monthsc | |
|
|||
| TABLE A.8: Satisfaction with Arrangements for Services after One Year | ||||||
| Demonstration (source) | Measure | Treatment Mean | Control Mean | Difference in Means | Percentage Difference | |
| RANDOMIZED EXPERIMENTS, COMPARABLE DATA | ||||||
| Georgia AHS (Skellie et al., 1982, p. 49A) | Getting enough help (one item) (1 = not enough, 3 = more than enough) | 1.71 | 1.62 | 0.07* | 4.3 | |
| Channeling (Applebaum and Harrigan, 1986, p. 28) | Percentage satisfied with arrangements for house cleaning, meals, laundry, and shopping (one item) | |||||
| Basic Model | 73 | 65 | 8* | 12.3 | ||
| Financial Model | 70 | 62 | 8* | 12.9 | ||
| * Statistically significant at the 5 percent level. | ||||||
| TABLE A.9: Unmet Service Needs after One Year | |||||||
| Demonstration (source) | Measure | Treatment Mean | Control Mean | Difference in Means | Percentage Difference | ||
| RANDOMIZED EXPERIMENTS, COMPARABLE DATA | |||||||
| Channeling (Applebaum and Harrigan, 1986, p. 36) Basic Model Financial Model | Unmet needs (eight items: transfer, dressing, toileting, bathing, meal preparation, housekeeping, transportation, and medical treatments) | ||||||
| Basic Model | 1.30 | 1.63 | -0.34* | -20.9 | |||
| Financial Model | 1.23 | 1.54 | -0.31* | -20.1 | |||
| QUASI EXPERIMENT, NONCOMPARATIVE DATA | |||||||
| New York City Home Carea (Sainer et al., 1984, pp. 280-283- 291-292) | Unmet needs | ||||||
| ADL (5 items) | 0.30 | 0.23 | 0.07 | 30.4 | |||
| IADL (18 items including mobility, grooming, homemaking, etc.) | 1.2 | 1.6 | -0.4 | -25.0 | |||
| Medical (6 items including physician, dental, eye, psychiatry, podiatry, and other) | 0.4 | 1.3 | -0.9* | -69.2 | |||
| Economic/social/environmental (8 items including financial, legal, housing, rent and utilities, social contact, security, housing repair, and other) | 0.3 | 1.1 | -0.8* | -72.7 | |||
* Statistically significant at the 5 percent level. |
|||||||
| TABLE A.10: Problems with Physical Environment after One Year | |||||||
| Demonstration (source) | Measure | Treatment Mean | Control Mean | Difference in Means | Percentage Difference | ||
| RANDOMIZED EXPERIMENTS, COMPARABLE DATA | |||||||
| Worcester Home Care (Sherwood, Morris, and Gutkin, 1975, Appendix B, p. 3) | Percentage with architectural barriersa (interviewer judgment) | ||||||
| Indoor | 11 | 18 | -7 | -38.9 | |||
| Outdoor | 31 | 34 | -3 | -8.8 | |||
| Channeling (Applebaum and Harrigan, 1986, p. 31) | Problems with physical environment (interviewer judgment concerning six items including standing water, fire hazards, rats or mice, infestation, no secure locks, etc.) (0 = none, 6 = all six) | ||||||
| Basic Model | 0.17 | 0.27 | -0.11* | -40.7 | |||
| Financial Model | 0.09 | 0.08 | 0.01 | 12.5 | |||
| RANDOMIZED EXPERIMENTS, NONCOMPARATIVE DATA | |||||||
| Project OPENb (Haskins et al., 1985, p.99) | Dissatisfaction with environment (seven items concerning satisfaction with or adequacy of: housing, building access, bathroom, meals, laundry, and transportation) (14 = low satisfaction/ adequacy, 7 = high satisfaction/adequacy) | 8.21 | 8.55 | -0.34 | -4.0 | ||
| QUASI EXPERIMENT, NONCOMPARATIVE DATA | |||||||
| New York City Home Careb (Haskins et al., 1985, pp. 224-226) | Problems with physical environment (sixteen items including plumbing, locks, wiring, infestation, elevators, etc.) (0 = none, 16 = all 16 problems) | 0.6 | 0.9 | -.3* | -33.3 | ||
* Statistically significant at the 5 percent level. |
|||||||
| TABLE A.11: Social Activities after One Year | ||||||
| Demonstration (source) | Measure | Treatment Mean | Control Mean | Difference in Means | Percentage Difference | |
| RANDOMIZED EXPERIMENTS, COMPARABLE DATA | ||||||
| Worcester Home Carea (Sherwood, Morris, and Gutkin, 1975, Appendix B, pp. 9, 11-12) | Social activities (seven items, including go to church, go to clubs, etc.) (0 = once or less for all activities, 7 = daily for one or more activities) | 1.7 | 1.9 | -0.2 | -3.3 | |
| Contact with friends (three items: 0 = least contact, 21 = most contact) | 10.2 | 10.3 | -0.1 | -1.0 | ||
| NCHSR Day Care/ Homemakerb (Weissert, Wan, and Livieratos, 1980, pp. 22, 33, 36) | Percentage maintained or increased frequency of activities (twelve items, including shopping, reading, and involvement in hobbies and sports) | |||||
| Day Care | 74 | 66 | 8 | 12.1 | ||
| Homemaker | 57 | 57 | 0 | 0.0 | ||
| Combined | 68 | 50 | 18* | 36.0 | ||
| San Diego LTC (Haskins et al., 1985, Appendix A., p. 76) | Social resources and activities (thirteen items: 0 = low score, 13 = high score) | 9.3 | 9.5 | -0.2c | -2.1 | |
| Channeling (Applebaum and Harrigan, 1986, p. 52) | Percentage never or only sometimes lonely Basic Model Financial Model | 73.965.1 | 67.667.3 | 6.3*-2.2 | 9.3-3.3 | |
| Percentage with daily or more frequent contact with family or friends Basic Model Financial Model | 49.544.2 | 45.942.6 | 3.71.6 | 8.13.8 | ||
| RANDOMIZED EXPERIMENTS, NONCOMPARATIVE DATA | ||||||
| Project OPEN(Haskins et al., 1986, Appendix A, p. 96) | Social network scale (fourteen items, including contact with friends and relatives, whether has someone to help, whether has a confident, social and recreational activities) (19 = least contact/activity, 92 = most contact/activity)d | 60.0 | 53.0 | 7.0*c | 13.2 | |
| Florida Pentastar (Maurer et al., 1984, pp. 168-169, 172-173) | Activities (eleven items including receives a visit, has a hobby, participates in group activity, reads, etc.) (11 = never or seldom for all items, 44 = daily for all items) | 25.0 | 24.0 | 1.0e | 4.2 | |
| QUASI EXPERIMENT, NONCOMPARATIVE DATA | ||||||
| New York City Home Careb (Haskins et al., 1985, pp. 224-226) | Social contact (number of contacts with children, other relatives, friends, and neighbors) (0 = none, 20 = 5 or more days per week with all four groups) | 16.1 | 14.6 | 1.5* | 10.3 | |
| Social activities (seven items including frequency of shopping, attending church, club activities, etc.) (0 = none, 35 = 5 or more days per week for all activities) | 5.2 | 3.1 | 2.1* | 67.7 | ||
* Statistically significant at the 5 percent level. |
||||||
| TABLE A.12: Self-rated Health after One Year | ||||||
| Demonstration (source) | Measure | Treatment Mean | Control Mean | Difference in Means | Percentage Difference | |
| RANDOMIZED EXPERIMENTS, COMPARABLE DATA | ||||||
| Worcester Home Care (Sherwood, Morris, and Gutkin, 1975, Appendix B, pp. 4-7) | Self-rated health (1 = poor, 4 = excellent) | 1.7 | 1.6 | 0.1 | 6.2 | |
| San Diego LTC (Pinkerton and Hill, 1984, p. 3.78) | Self-rated health (0 = poor, 9 = excellent) | 5.4 | 5.4 | 0.0 | 0.0 | |
| Channeling (Applebaum and Harrigan, 1986, p. 53) | Percentage rating health good or excellent | |||||
| Basic Model | 25 | 21 | 4* | 19.0 | ||
| Financial Model | 24 | 26 | -2 | 7.7 | ||
| QUASI EXPERIMENT, NONCOMPARATIVE DATA | ||||||
| New York City Home Care (Sainer et al., 1984, p. 179) | Self-rated healtha (1 = poor, 4 = excellent) | 1.9 | 1.9 | 0.0 | 0.0 | |
* Statistically significant at the 5 percent level. |
||||||
| TABLE A.13: Disability in Activities of Daily Living (ADL) after One Year | ||||||
| Demonstration (source) | Measure | Treatment Mean | Control Mean | Difference in Means | Percentage Difference | |
| RANDOMIZED EXPERIMENTS, COMPARABLE DATA | ||||||
| Worcester Home Care (Sherwood, Morris, and Gutkin, 1975, p. 53) | Six items ADL score including continence | 1.7 | 1.9 | -0.2 | -10.5 | |
| NCHSR Day Care/ Homemaker (Weissert, Wan, and Livieratos, 1980, pp. 44, 46, 48) | Percent declined in ADL functioning (based on six items including continence; deceased included as disabled in all activities)a | |||||
| Day Care | 37 | 43 | -5 | -11.5 | ||
| Homemaker | 40 | 43 | -3 | -7.0 | ||
| Combined | 38 | 40 | -2 | -5.0 | ||
| Georgia AHS (Skellie et al., 1982, p. 44-A) | Six items ADL score including continence (1-7) | 2.2 | 2.3 | -0.1 | -4.3 | |
| South Carolina LTC (Brown et al., 1985, p. III.68) | Six item ADL score including continence (0-12) | 6.0 | 6.5 | -0.5 | -7.7 | |
| San Diego LTCb (Haskins et al., 1985, Appendix A., p. 7476) | Five item ADL score (0-5) | 1.2 | 1.1 | 0.1 | 9.1 | |
| Channeling (Applebaum and Harrigan, 1986, p. 69) | Five item ADL score (0-5) | |||||
| Basic Model | 2.3 | 2.2 | 0.1 | 4.5 | ||
| Financial Model | 2.5 | 2.3 | 0.2* | 8.7 | ||
| RANDOMIZED EXPERIMENTS, NONCOMPARATIVE DATA | ||||||
| Project OPENb (Haskins et al., 1985, Appendix A, p. 96) | Five item ADL score (0-5) | 1.0 | 0.8 | 0.2 | 25.0 | |
| Florida Pentastar (Maurer et al., 1984, pp. 168) | Nine item disability score including eating, toileting, bathing, dressing, taking medicine, handling money, grooming, walking outside, managing stairs, but not transfer (9-27) | 13.7 | 13.5 | 0.2c | 1.5 | |
| QUASI EXPERIMENTS, COMPARABLE DATA | ||||||
| On Lokb (Haskins et al., 1985, Appendix A, pp. 71, 81) | Four item ADL score excluding transfer (0-4) | 1.6 | 1.9 | -0.3 | -15.8 | |
| Nursing Home without Walls (Birnbaum et al., 1984, p. IV.45) | Percentage maintained or declined in ADL functioning (based on six items including continence)a | |||||
| Upstate | 71 | 76 | -5 | -6.6 | ||
| New York City | 57 | 73 | -16* | -21.9 | ||
| QUASI EXPERIMENT, NONCOMPARATIVE DATA | ||||||
| Triage (Shealy, Hicks, and Quinn, 1979, p. 398) | Percentage declined in ADL functioning based) on seven item scale including both bowel and bladder continence) | 16 | 17 | -1d | -5.9 | |
| New York City Home Care (Haskins et al., 1985, Appendix A, pp. 59, 75) | Five item ADL score (0-5) | 3.0 | 1.9 | 1.1* | 57.9 | |
* Statistically significant at the 5 percent level. |
||||||
| TABLE A.14: Life Satisfaction/Morale after One Year | ||||||
| Demonstration (source) | Measure | Treatment Mean | Control Mean | Difference in Means | Percentage Difference | |
| RANDOMIZED EXPERIMENTS, COMPARABLE DATA | ||||||
| Worcester Home Care (Sherwood, Morris, and Gutkin, 1975, Appendix B, pp. 4-7) | Attitude toward aging (five items including happy, things are getting worse, have pep, feel less useful) (0 = poor attitude, 5 = best attitude) | 1.7 | 1.6 | 0.1 | 6.2 | |
| Life satisfaction (four items including satisfied with life, life isnt worth living, sad, life is hard) (0 = dissatisfied, 4 = satisfied) | 2.7 | 2.5 | 0.2 | 8.0 | ||
| Zung self-satisfaction scale (seven items including life is full, feel useful, easy to make decisions, hopeful, mind is clear) (0 = low self-satisfaction, 14 = high)a | 8.1 | 7.9 | 0.2 | 2.5 | ||
| Agitation (six items including worry, little things bother, get upset, get mad, afraid, and take things hard) (0 = highly agitated, 6 = not agitated) | 3.8 | 3.6 | 0.2 | 5.6 | ||
| NCHSR Day Care/ Homemakerb (Weissert, Wan, and Livieratos, 1980, pp. 22, 33, 36) | Percentage maintained or improved contentment (based on five items including satisfaction with life; attitude toward aging; satisfaction with arrangements for house cleaning, meals, laundry, and shopping; happiness; and concern about health) | |||||
| Day Care | 71 | 64 | 7 | 10.9 | ||
| Homemaker | 63 | 52 | 9* | 17.3 | ||
| Combined | 83 | 54 | 29* | 53.7 | ||
| Georgia AHS (Skellie et al., 1982, pp. 240, 45-A) | PGC morale scale (twelve items including happy, life not worth living, things are getting worse, have pep, little things bother, see enough of friends and family, feel less useful, a lot to be sad about, take things hard, get upset easily and afraid) (0 = low morale, 2 = high morale) | 1.51 | 1.49 | .02 | 1.3 | |
| San Diego LTC (Haskins et al., 1985, Appendix A., p. 76) | PGC morale (see Georgia AHS) (0 = low morale, 17 = high morale)a | 9.15 | 9.15 | 0.00c | 0.0 | |
| Channeling (Applebaum and Harrigan, 1986, p. 46, 50, 56) | Percentage completely or pretty satisfied with the way they are spending their lives Basic Model Financial Model | 6562 | 6356 | 2d6*d | 3.210.7 | |
| Percentage happy or very happy in the last month Basic Model Financial Model | 7364 | 7263 | 11 | 1.41.6 | ||
| Percentage reporting life is not worse or only somewhat worse as one grows older Basic Model Financial Model | 6556 | 5754 | 8*2 | 14.03.7 | ||
| Contentment index (see NCHSR Day Care/ Homemaker) (0 = low contentment, 10 = high contentment) Basic Model Financial Model | 5.695.12 | 5.474.95 | 0.220.17 | 4.03.4 | ||
| RANDOMIZED EXPERIMENTS, NONCOMPARATIVE DATA | ||||||
| Project OPEN(Sklar and Weiss, 1983, pp. 112, 114) | Life satisfaction (one item: taking everything into consideration, how would you say things are these days?) (1 = unhappy, 3 = happy)a | 2.19 | 2.15 | 0.14e | 6.5 | |
| QUASI EXPERIMENT, COMPARATIVE DATA | ||||||
| On Lok (Zawadski et al., 1984, pp. 5-10) | Psychological requirements of living (including personal fulfillment, social network, communication, service agency orientation) (0 = less independent, 24 = more independent) | 18.4 | 15.1 | 3.3* | 21.9 | |
* Statistically significant at the 5 percent level. |
||||||
REFERENCES
Note: An asterisk indicates that the document was used for the comparisons reported in text and tables.
Anderson, N.N., Patten, S.K., and Greenberg, J.N. 1980. A Comparison of Home Care and Nursing Home Care for Older Persons in Minnesota. Grant No. 90-A-682. Prepared for Administration on Aging. Minneapolis, Minn., University of Minnesota.
*Applebaum, R.A., and Harrigan, M. 1986. Channeling Effects on the Quality of Clients Lives. Contract No. HHS-100-80-0157. Prepared for Department of Health and Human Services. Princeton, N.J., Mathematica Policy Research. [http://aspe.hhs.gov/daltcp/reports/qualty.htm]
Applied Management Sciences. 1976. Evaluation of Personal Care Organizations and Other In-Home Alternatives to Nursing Home Care for the Elderly and Long-Term Disabled, Final Report and Executive Summary (Revised). Contract No. HEW-OS-74-294. Prepared for Department of Health, Education, and Welfare. Silver Spring, Md.
Arkansas Office on Aging. 1981. The In-Home Option: An Evaluation of Non-Institutional Services for Older Arkansans. Little Rock, Ark., Arkansas Department of Human Services.
Bakst, H.J., and Marra, E.F. 1955. Experience with home care for cardiac patients. American Journal of Public Health and the Nations Health 45(4):444-50.
Bell, G. 1973. Community care for the elderly: An alternative to institutionalization. Gerontologist 13(3, Part 1):350-55.
*Birnbaum, H., Gaumer, G., Pratter, F., and Burke, R. 1984. Nursing Home without Walls: Evaluation of the New York State Long-Term Home Health Program. Contract No. 500-79-0052. Prepared for Health Care Financing Administration. Cambridge, Mass., Abt Associates.
Blenkner, M., Bloom, M., and Nielson, M. 1971. A research demonstration project of protective services. Social Casework 52(8):483-499.
Brickner, P. and Scharer, L.K. 1977. Hospital provides home care for elderly at one-half nursing home cost. Forum 1(2):7-12.
*Brown, R.S., and Mossell, P.A. 1984. Examination of the Equivalence of Treatment and Control Groups and the Comparability of Baseline Data. Contract No. HHS-100-80-0157. Prepared for Department of Health and Human Services. Princeton, N.J., Mathematica Policy Research. [http://aspe.hhs.gov/daltcp/reports/baslines.htm]
*Brown, T.E., Jr., Blackman, D., Learner, R.M., and Witherspoon, M.B. 1985. South Carolina Community Long Term Care Project: Reports of Findings. Grant No. 11-P-97493/4. Prepared for Health Care Financing Administration, South Carolina. State Health and Human Services Finance Commission. Spartanburg, S.C.
Bryant, N.H., Candland, L., and Lowenstein, R. 1974. Comparison of care and cost outcomes for stroke patients with and without home care. Stroke 5:54-59.
Capitman, J.A. 1986. Community-based long-term care models, target groups, and impacts on service use. Gerontologist 26(4):389-397.
Capitman, J.A., Haskins, B., and Bernstein, J. 1986. Case management approaches in coordinated community-oriented long-term care demonstrations. Gerontologist 26(4):398-404.
*Carcagno, G., Applebaum, R., Christianson, J., et al. 1986. The Evaluation of the National Long Term Care Demonstration: The Planning and Operational Experience of the Channeling Projects, Vols. 1 and 2. Contract No. HHS-100-80-0157. Prepared for Department of Health and Human Services. Princeton, N.J., Mathematica Policy Research. [http://aspe.hhs.gov/daltcp/reports/process1.htm]
*Christianson, J.B. 1986. Channeling Effects on Informal Care. Contract No. HHS-100-80-0157. Prepared for Department of Health and Human Services. Princeton, N.J., Mathematica Policy Research. [http://aspe.hhs.gov/daltcp/reports/inform.htm]
Congressional Budget Office, 1977. Long Term Care for the Elderly and Disabled. Budget Issue Paper. Washington, D.C., Congressional Budget Office.
Doherty, N., Segal, I., and Hicks, B. 1978. Alternatives to institutionalization for the aged. Aged Care and Services Review 1:1-16.
Fraker, T., and Maynard, R. Forthcoming. The adequacy of comparison group designs for evaluations of employment-related programs. Journal of Human Resources.
Gerson, L.W., and Collins, J.F. 1976. A randomized controlled trial of home care: Clinical outcomes for five surgical procedures. Canadian Journal of Surgery 19(6):519-23.
Goldberg, M. 1970. Helping the Aged: A Field Experiment in Social Work. London: George Allen and Unwin.
*Grannemann, T.W., Grossman, J.B., and Dunstan, S.M. 1986. Differential Impacts among Subgroups of Channeling Enrollees. Contract No. HHS-100-80-0157. Prepared for Department of Health and Human Services. Princeton, N.J., Mathematica Policy Research. [http://aspe.hhs.gov/daltcp/reports/enrolles.htm]
Greenberg, J. 1974. A Planning Study of Services to Noninstitutionalized Older Persons in Minnesota, Part Two, The Costs of In-Home Services. Report prepared under contract to the Governors Citizens Council on Aging. Minneapolis, Minn., University of Minnesota.
Greenberg, J.N., Doth, D., Johnson, A., and Austin, C. 1980. A Comparative Study of Long Term Care Demonstration Projects: Lessons for Future Inquiry. Minneapolis, Minn., Center for Health Services Research, University of Minnesota.
Greenberg, J.N., Schmitz, M.P., and Lakin, K.C. 1983. An Analysis of Responses to the Medicaid Home- and Community-Based Long Term Care Waiver Program (Section 2176 of Public Law 97-35). Grant Nos. 18-P-97923/3-3/03 and 18-P-98078-5-01. Prepared for Health Care Financing Administration. Washington, D.C., State Medicaid Information Center, National Governors Association.
Greene, V.L., 1986. Nursing Home Admission Risk and the Cost-Effectiveness of Community-Based Long-Term Care. Paper presented at the Annual Meeting of the Gerontological Society of America. Chicago, Illinois.
Groth-Juncker, A., Zimmer, J.G., McCusker, J., and Williams, T.F. 1983. Home Health Care Team: Randomized Trial of a New Team Approach to Home Care. Grant No. HS-03030. Prepared for National Center for Health Services Research.
Hamm, L.V., Kickham, T.M., and Cutler, D.A. 1982. Research, demonstrations, and evaluations. In Vogel, R.J., and Palmer, H.C., eds., Long-Term Care: Perspectives from Research and Demonstrations. Health Care Financing Administration. Washington, D.C., U.S. Government Printing Office.
Hammond, J. 1979. Home health care cost effectiveness: An overview of the literature. Public Health Reports 94(4):305-311.
*Haskins, B., Capitman, J., Collignon, F., et al. 1985. Evaluation of Coordinated Community Oriented Long Term Care Demonstrations. Contract No. 500-80-0073. Prepared for Health Care Financing Administration. Berkeley, Calif., Berkeley Planning Associates.
Health Care Financing Administration. 1984. Studies Evaluating Medicaid Home and Community-Based Care Waivers. Office of Research and Demonstrations, Baltimore, Md.
Hedrick, S.C., and Inui, T.S. 1986. The effectiveness and cost of home care: An information synthesis. Health Services Research 20(6, Part II):851-880.
Hughes, S.L. 1981. Evaluation of a Comprehensive Long Term Care Program for Chronically Impaired Elderly. Ann Arbor, Mich., University Microfilms International.
Kane, R.L. and R.A. Kane, 1980. Alternatives to Institutional Care of the Elderly: Beyond the Dichotomy. Gerontologist 20(3):249-259.
Katz, S., Amasa, B., Downs, T.D., et al. 1972. Effects of Continued Care: A Study of Chronic Illness in the Home. DHEW Pub.No. HSM 73-3010. Public Health Service. Washington, D.C., U.S. Government Printing Office.
Katz, S., Vignos, P.J., Moskowitz, R.W., and Thompson, H.M. 1968. Comprehensive outpatient care in rheumatoid arthritis. JAMA 206(6):1219-1265.
*Kemper, P., Brown, R.S., Carcagno, G.J., et al. 1986. The Evaluation of the National Long Term Care Demonstration: Final Report. Contract No. HHS-100-80-0157. Prepared for Department of Health and Human Services. Princeton, N.J., Mathematica Policy Research. [http://aspe.hhs.gov/daltcp/reports/chanfr.htm]
Kotler, M., Wright, G., Jaskulski, T., and Kreisberg, I. 1985. Synthesis of Cost Studies on the Long Term Care of Health-Impaired Elderly and Other Disabled Persons: Final Report. Silver Spring, Md., Macro Systems, Inc., [http://aspe.hhs.gov/daltcp/reports/syncost1.htm]
LaLonde, R.J. 1986. Evaluating the econometric evaluations of training programs with experimental data. American Economic Review 76(4):604-620.
LaVor, J., and Callender, M. 1976. Home health cost effectiveness: What are we measuring? Medical Care 14(10):866-872.
Liu, K., Manton, and Liu, B.M. 1985. Home care expenses for the disabled elderly. Health Care Financing Review 7(2):51-58.
*Maurer, J., Ross, N.L., Bigos, Y., et al. 1984. Final Report and Evaluation of the Florida Pentastar Project. Report E-84-7. Tallahassee, Fla., Florida Department of Health and Rehabilitative Services.
Mechanic, D., 1979. Future Issues in Health Care: Social Policy and the Rationing of Medical Services. New York: Free Press.
Miller, L., Clark, M., Walter, L., et al. 1984. The Comparative Evaluation of the Multipurpose Senior Services Project--1981-1982: Final Report. Grant No. 11-P-97553/9-04. Prepared for Health Care Financing Administration. Berkeley, Calif., University of California.
Morris, R., 1971. Long-Term Disability: A Missing Dimension in Medical Care and Public Welfare Reform. Alternatives to Nursing Home Care: A Proposal. Prepared for Special Committee on Aging, U.S. Senate. Washington, D.C., U.S. Government Printing Office.
Nielsen, M., Blenkner, M., Bloom, M., et al. 1972. Older persons after hospitalization: A controlled study of home aide service. Public Health 62(8):1094-1011.
Palmer, H.C. 1982a. The alternatives question. In Vogel, R.J., and Palmer, H.C., eds., Long-Term Care: Perspectives from Research and Demonstrations. Health Care Administration. Washington, D.C., U.S. Government Printing Office.
Palmer, H.C. 1982b. Home care. In Vogel, R.J., and Palmer, H.C., eds., Long-Term Care: Perspectives from Research and Demonstrations. Health Care Administration. Washington, D.C., U.S. Government Printing Office.
Papsidero, J.A., Katz, S., Kroger, M.H., and Akpom, C.A., eds. 1979. Chance for Change: Implications of a Chronic Disease Module Study. East Lansing, Mich.: Michigan State University Press.
Piland, N.F. 1978. Feasibility and Cost-Effectiveness of Alternative Long-Term Care Settings. Contract No. SRS-74-39. Prepared for Office of Planning, Research, and Evaluation, Social and Rehabilitation Services, Department of Health, Education, and Welfare. Menlo Park, Calif., SRI International.
*Pinkerton, A., and Hill, D. 1984. Long Term Care Demonstration Project of North San Diego County: Final Report. Grant No. 95-P-97325/9-04. Prepared for Health Care Financing Administration. San Diego, Calif., Allied Home Health Association.
Pollak, W. 1973. Costs of alternative care settings for the elderly. Working Paper 963-11. Washington, D.C., The Urban Institute.
*Price, L.C., and Ripp, H.M. 1980. Third Year Evaluation of the Monroe County Long Term Care Program, Inc. HCFA Grant No. 05-011-P90-130 and AoA Grant No. 2A-50A. Prepared for Health Care Financing Administration and Administration on Aging. Silver Spring, Md., Macro Systems, Inc.
Quincy, J., 1852. A Municipal History of the Town and City of Boston during Two Centuries. Boston, Massachusetts: Charles Little and James Brown.
Rathbone-McCuan, E., and Lohn, H. 1975. Cost Effectiveness of Geriatric Day Care: A Final Report. Baltimore, Md., Levindale Geriatric Research Center.
Ruchlin, H.S., and Morris, J.N. 1983. Pennsylvanias domiciliary care experiment: II, Cost-benefit implications. American Journal of Public Health 73(6):654-660.
Sager, A. 1979. Learning the Home Care Needs of the Elderly: Patient, Family, and Professional Views of an Alternative to Institutionalization. AoA Grant No. 90-A-1026 (01) (02). Prepared for Administration on Aging. Waltham, Mass., The Levison Policy Institute, Brandeis University.
*Sainer, J.S., Brill, R., Horowitz, A., et al. 1971. Delivery of Medical and Social Services to the Homebound Elderly: A Demonstration of Intersystem Coordination. HCFA Grant No. 95-P-97492 and AoA Grant No. 90-AM-2187. Prepared for Health Care Financing Administration and Administration on Aging. New York, New York City Department for the Aging.
Scutchfield, F.D., and Freeborn, D.K. 1971. Estimation of need, utilization, and costs of personal care homes and home health services. Health Services and Mental Health Administration. Health Reports 86(4).
*Seidl, F., Applebaum, R., Austin, C., and Mahoney, K. 1980. Delivering In-Home Services to the Aged and Disabled--The Wisconsin Experiment. Grant No. 11-P-255549/5-05. Prepared for Fay McBeath Institute, University of Wisconsin-Madison.
*Shealy, M.J., Hicks, B.C., and Quinn, J.L. 1979. Triage: Coordinated Delivery of Services to the Elderly, Final Report. Grant No. HS02563. Prepared for National Center for Health Services Research. Plainville, Conn., Triage, Inc.
Sherwood, S., and Morris, J.N. 1983. The Pennsylvania domiciliary care experiment: I, Impact on quality of life. American Journal of Public Health 73(6):646:653.
Sherwood, S., Greer, D.S., Morris, J.N., et al. 1981. An Alternative to Institutionalization--The Highland Heights Experiment. Boston: Ballinger.
*Sherwood, F., Morris, J.N., and Gutkin, C.E. 1975. Final Report Concerning the Impact of Services on Health and Well-Being. HRS Grant No. HS01134. Prepared for Bureau of Health Services Research. Boston, Department of Gerontological Research, Hebrew Rehabilitation Center for the Aged.
*Skellie, A., Strauss, R., Favor, F., and Tudor, C. 1982. Alternative Health Services Project Final Report. Grant No. 11-P-90334/4-05. Prepared for Health Care Financing Administration. Atlanta, Ga., Georgia Department of Medical Assistance.
*Sklar, B.W., and Weiss, L.J. 1983. Project OPEN: Final Report. Grant No. 95-P-97231/9-04. Prepared for Health Care Financing Administration. San Francisco, Calif., Mt. Zion Hospital and Medical Center.
*Solem, R., Garrick, M., Nelson, H., et al. 1979. Community-Based Care Systems for the Functionally Disabled: A Project in Independent Living. Olympia, Wash., State of Washington Department of Social and Health Services.
Spivak, S. 1984. A Review of Research on Informal Support Systems. Contract No. 500-80-0073. Prepared for Health Care Financing Administration. Berkeley, Calif., Berkeley Planning Associates.
Stassen, M., and Holahan, J. 1980. A Comparative Analysis of Long-Term Care Demonstrations and Evaluations. AoA Grant No. 90-A-1371 (01). Prepared for Administration on Aging. Washington, D.C., The Urban Institute.
Steiner, P., and Needleman, P. 1981. Expanding Long Term Care Efforts: Options and Issues in State Program Design: A Synthesis of Findings from Health Services Research and Demonstration Projects. Contract No. 233-79-3018. Prepared for Department of Health and Human Services. Washington, D.C., Lewin and Associates, Inc.
Stone, J.R., Patterson, E., and Felson, L. 1968. Effectiveness of home care for general hospital patients. JAMA 205(7):145-148.
*Thornton, C., and Dunstan, S.M. 1986. The Evaluation of the National Long Term Care Demonstration: Analysis of the Benefits and Costs of Channeling. Contract No. HHS-100-80-0157. Prepared for Department of Health and Human Services. Princeton, N.J., Mathematica Policy Research. [http://aspe.hhs.gov/daltcp/reports/benecost.htm]
*Thornton, C., Will, J., and Davies, M. 1986. The Evaluation of the National Long Term Care Demonstration: Analysis of Channeling Project Costs. Contract No. HHS-100-80-0157. Prepared for Department of Health and Human Services. Princeton, N.J., Mathematica Policy Research. [http://aspe.hhs.gov/daltcp/reports/projcost.htm]
Toff, G.E. 1981. Alternatives to Institutional Care for the Elderly: An Analysis of State Initiatives. Washington, D.C., Intergovernmental Health Policy Project, George Washington University.
U.S. General Accounting Office. 1977. Home Health--The Need for a National Policy to Better Provide for the Elderly. GAO Pub.No. HRD-78-19. Washington, D.C., GAO.
U.S. General Accounting Office. 1979. Entering a Nursing Home--Costly Implications for Medicaid and the Elderly. GAO Pub.No. PAD-80-12. Washington, D.C., GAO.
U.S. General Accounting Office. 1982. The Elderly Should Benefit from Expanded Home Health Care but Increasing These Services Will Not Insure Cost Reductions. GAO Pub.No. IPE-83-1. Washington, D.C., U.S. Government Printing Office.
Weissert, W.G. 1985. Seven reasons why it is so difficult to make community-based long term care cost-effective. Health Services Research 20(4):423-433.
*Weissert, W.G., Wan, T.T.H., and Livieratos, B.B. 1980. Effects and Costs of Day Care and Homemaker Services for the Chronically Ill: A Randomized Experiment. Pub.No. (PMS) 79-3258. Office of Health Research, Statistics, and Technology, National Center for Health Services Research. Washington, D.C.
Williams, T.F., Hill, J.G., Fairbank, M.E., and Knox, T.G. 1973. Appropriate placement of the chronically ill and aged: A successful approach by evaluation. JAMA 226(11):1332-1335.
Woodroofe, K., 1971. From Charity to Social Work in England and the United States. Toronto: University of Toronto Press.
*Wooldridge, J., and Schore, J. 1986. The Evaluation of the National Long Term Care Demonstration: Channeling Effects on Hospital, Nursing Home, and Other Medical Services. Contract No. HHS-100-80-0157. Prepared for Department of Health and Human Services. Princeton, N.J., Mathematica Policy Research. [http://aspe.hhs.gov/daltcp/reports/hospit.htm]
*Zawadski, R.T., Shen, J., Yordi, C., and Hansen, J. 1984. On Loks Community Care Organization for Dependent Adults: A Research and Demonstration Project (1978-1983): Final Report. HCFA Grant No. 95-P-97293 and AoA Grant No. 18-P-00156/9. Prepared for Health Care Financing Administration and Administration on Aging. San Francisco, Calif., On Lok.
NOTES
-
For a sample of hospital patients to be discharged to a nursing home, Sager (1979) compared nursing home costs to the hypothetical costs of care in the community based on care plans carefully constructed by professionals. Contrary to the other hypothetical comparisons, Sager concluded that nursing home care was less costly than community care. Because his sample consisted of highly disabled, subacute patients, however, they probably fall in the "most disabled" categories among the studies that used community samples as the basis of their comparisons. (For example, Sager's average estimate of hours of formal care was 84 hours per week compared to Greenberg's actual 75 hours per month for the most disabled category.) Although Sager's overall finding does not appear inconsistent with the other comparisons, a specific conclusion -- that the most disabled can be cared for more cheaply in the community -- is clearly not consistent with the other hypothetical cost comparisons. Because this conclusion is based on only eight cases, we discount Sager's conclusion about the relation between disability and the relative cost of care in the community.
-
Although we have reviewed the waiver-funded community care demonstrations that provided case-managed community care to elderly community residents, we have not by any means reviewed all waiver-funded long-term care demonstrations; for example; Texas' effort to deinstitutionalize patients in ICF-II nursing homes, eliminating that level of care; Oregon's Flexible Intergovernmental Grant demonstration designed to foster cooperation among local agencies in providing community services to the elderly; the Medicare and Medicaid Hospice demonstration of alternative care for the terminally ill; the AFDC/Home Health demonstration of training AFDC recipients to provide home care; the Social Health Maintenance Organization demonstration of capitation financing integrating acute health and long-term care, including community care; as well as many others. (See Hamm, Kickham, and Cutler 1982 for descriptions of the waiver-funded demonstrations.) In addition, three of the demonstrations (Triage, ACCESS, and On Lok) evolved, after the initial demonstration reviewed here, into different interventions.
-
Studies of interventions other than case-managed community care, for example, sheltered housing (e.g., Sherwood et al. 1981) and personal care homes (e.g., Sherwood and Morris 1983, and Ruchlin and Morris 1983) have not been included in this review.
-
Basic Model Channeling's limited gap-filling services were funded directly through the demonstration contracts rather than through waivers.
-
Activities of daily living.
-
Several of the evaluations using quasi-experimental designs sought to mitigate the risk of bias by controlling statistically for pretreatment differences in characteristics using a multivariate statistical technique such as multiple regression. Such statistical control is limited in its ability to deal with pretreatment noncomparabilities because of the inability of measured characteristics to control for selection bias. Moreover, differential data collection for the treatment and comparison groups increased the risk of bias in four of the five quasi experiments.
-
Data collection from individuals can also include service use and cost diaries that the individuals maintain. They were collected by two of the quasi experiments.
-
In some cases service use data were obtained from individual interviews, raising the possibility of noncomparable service use measures as well. Moreover, depending on the procedures for generating searches for records, noncomparable interviewing can be transmitted to records collection.
-
Brown and Mossel (1984) examined differential measurement between program staff and research interviewers and found a number of differences, suggesting that some bias does result from differential data collection.
-
Frequency of follow up also varied across demonstrations. One demonstration had a single follow up 12 months after enrollment. Another followed up at 12 and 18 months. Three demonstrations followed up every 3 months, at least for the first 6 months. The rest had follow up interview at 6-month intervals.
-
Wherever possible, the table includes estimates for the full sample rather than survivors only. Estimates of effects thus include indirect effects on nursing home use through any effects on longevity. For those evaluations reporting both, results for survivors were similar.
-
The Wisconsin CCO evaluation is included in the group with essentially complete data on use, even though it analyzed only Medicaid use. Because Medicare is not a major payor for nursing home use, omission of use under Medicare is probably not material. (The omission of private payments is not important for Wisconsin CCO since clients had to be Medicaid eligible.)
-
Georgia AHS and Basic model Channeling did find statistically significant reductions for months 1-6 and months 2 and 3, respectively (not shown), but they were also small.
-
Two questions about the generalizability of the South Carolina CLTC results arise. First, would the South Carolina CLTC results apply to other community care environments? The South Carolina CLTC site was characterized by limited publicly financed community services. Extrapolation 737 other communities with different service environments may not be appropriate. In particular, in communities that already have substantial public financing for community services, expanding them may not reduce nursing home use as much because the existing community services may have already achieved whatever reduction in nursing home use is possible.
Second, was the magnitude of the nursing home reduction overestimated somewhat because of indirect effects on control group use of nursing homes? The South Carolina CLTC site was reportedly characterized by a tight nursing home bed supply. It is possible that the demonstration, by diverting some nursing home applicants to community care, may have reduced waiting times for nursing home admission for everyone else, including the control group. This would lead to overestimates of what control group nursing home use and the reduction due to expanded community care would be in communities where nursing home bed supply is less tightly constrained. The reduction might well be even greater than estimated, however, in environments with ample nursing home beds where presumably more patients are unnecessarily placed in nursing homes.
These questions are not addressed by the only other demonstration to identify clients exclusively through a nursing home preadmission screen, ACCESS. Its clients, although less disabled than the South Carolina CLTC demonstration's clients, were among the most disabled of the populations served. Unfortunately, a control group was not available to estimate the risk of nursing home placement in the absence of expanded community care.
-
The testing for differences in effects across subgroups differed among evaluations. Several (Channeling, San Diego LTC, Nursing Home without Walls, and New York City Home Care) tested for equality of effects (i.e., treatment-control differences) across subgroups. Several others (Worcester Home Care, Georgia AHS, and NCHSR Day Care/Homemaker) only tested for effects for each subgroup, not for differences in effects across subgroups. The remaining evaluations that analyzed subgroup differences (South Carolina CLTC, On Lok, and MSSP) did not report any statistical tests for subgroups, and we only report apparent patterns of differences across subgroups. These differences in the underlying studies make a comparison using a consistent statistical criterion for the existence of differences impossible.
-
Results for these variables were as follows:
Channeling's results for those on a nursing home waiting list were inconsistent -- Basic Model Channeling increased use among Medicaid eligibles while Financial Model Channeling decreased it.
South Carolina CLTC found larger reductions in nursing home use among those at home compared to those hospitalized. (Channeling and NCHSR Day Care/Homemaker, however, found no differences.)
Financial Model Channeling reduced nursing home use for those with low unmet needs. (Basic Model Channeling and New York City Home Care found no differences.)
Nursing Home without Walls' findings concerning prognosis at enrollment were inconsistent: the upstate project had smaller reported reductions among those expected to recover, while the New York City project had larger reductions among that group.
The NCHSR Day Care model found significant reductions among whites, but the other two models and New York City Home Care found no differences.
Finally, no differences in effects were observed with age, gender, diagnosis, or loneliness (each examined by one, evaluation).
-
The cost estimates for OPEN differ, depending on whether the OPEN or the Berkeley Planning Associates estimates are used. OPEN estimates include private and public costs except for a portion of project case management costs. The estimates of Berkeley Planning Associates include Medicare and all project costs. OPEN evaluation results show reduced costs; Berkeley Planning Associates, increased costs. To obtain the more comprehensive cost estimate, we have reported OPEN estimates for all categories except case management, where we reported the more inclusive Berkeley Planning Associates estimates (see Haskins et al. 1985, in source documents Appendix A, pp. 107-125). The OPEN evidence suggests to us that Medicare costs including community services paid for under waivers were increased; combined private and other public costs were reduced; and overall, total costs were reduced.
Wisconsin CCO estimates, as indicated, were limited to Medicaid.
-
These estimates are not statistically significant. They are based on multiple regression, which controls for treatment-control differences in baseline characteristics. The unadjusted treatment-control differences indicate that costs were reduced by $21 (3.1 percent) over the three-year period.
-
A third possible interpretation is that the treatment-control differences in disability were true differences between the treatment and control groups, which led to the observed reduction in nursing home use under South Carolina CLTC and the absence of an effect on nursing home use under Financial Model Channeling. Because both evaluations controlled for baseline differences in disability using multivariate statistical techniques and because Channeling's analysis of change in disability also showed effects, we do not believe this interpretation.
-
Two additional studies -- which differed from the community care demonstrations in that they were hospital-based home care studies -- are noteworthy because of their functioning results. In both (Katz et al; 1972 and Hughes 1981) treatment group members reported having significantly higher levels of ADL disability than controls. Authors of these studies also were unable to determine whether this was a result of client atrophy or measurement.
-
MSSP did not analyze overall ADL but classified sample members into three groups: no disabilities, disabilities in one or two tasks, and disabilities in three or more tasks. Transitions from the group with one or two disabilities to none were significantly more likely during the first evaluation period (see Miller et al.1984, pp. 9.28-9.33).
-
See also Weissert (1985) for a discussion of the reasons why cost reductions through substitution of community care for nursing home care are difficult.