
The Lewin Group
Printer Friendly Version in PDF Format (67 PDF pages)
ABSTRACT
The report Picture of Housing and Health (released by ASPE in 2014), found high prevalence of chronic conditions and higher health care utilization for HUD-assisted Medicare beneficiaries compared to unassisted beneficiaries. This second report seeks to understand whether the characteristics of the sample could explain the higher utilization. The study compares health care utilization and spending between HUD-assisted Medicare beneficiaries and unassisted beneficiaries taking into account confounding factors. This information could help inform targeted interventions and policies among specific HUD-assisted subgroups to ensure appropriate use of health care services and to better meet resident needs. In summary, after taking into account characteristics associated with health care utilization and payment, this study demonstrates that HUD-assisted Medicare beneficiaries do not consistently have higher health care utilization and payment than unassisted Medicare beneficiaries.
DISCLAIMER: The opinions and views expressed in this report are those of the authors. They do not necessarily reflect the views of the Department of Health and Human Services, the Department of Housing and Urban Development, the contractor or any other funding organization.
TABLE OF CONTENTS
I. INTRODUCTION
- Background
- Summary of the First Report: "Picture of Housing and Health"
- Picture of Housing and Health Part 2: Study Objectives and Hypotheses
II. METHODS
- Data
- Study Samples
- Outcomes
- Statistical Methods
III. RESULTS
- Medicare-Medicaid Enrollees Residing in the NYC/NJ MSA, Age 65 or Older, 2008
- Medicare-Medicaid Enrollees Residing in Study Geographic Areas Other Than the NYC/NJ MSA, Age 65 or Older, 2008
- Medicare-only Beneficiaries Residing in the NYC/NJ MSA, Age 65 or Older, 2008
- Medicare-only Beneficiaries Residing in Study Geographic Areas Other Than the NYC/NJ MSA, Age 65 or Older, 2008
IV. DISCUSSION
- Summary of Results
- Limitations
- Conclusion
APPENDICES
- APPENDIX A: Data Sources and Variable Definitions
- APPENDIX B: Unadjusted Results
LIST OF FIGURES
- FIGURE ES1: OR of Utilizing any Health Care Service for MMEs Receiving HUD Assistance Relative to MMEs Not Receiving Assistance, Age 65 or Older, 2008
- FIGURE ES2: Odds Ratio of Utilizing any Health Care Service for Medicare-only Beneficiaries Receiving HUD Assistance Relative to Beneficiaries Not Receiving Assistance, Age 65 or Older, 2008
- FIGURE 1: Study Sample Inclusions and Resulting Sample Size
- FIGURE 2: OR of Utilizing any Health Care Service for HUD-assisted MMEs and Unassisted MMEs Residing in the NYC/NJ MSA, Age 65 or Older, 2008
- FIGURE 3: OR of Utilizing any Health Care Service for Beneficiaries Receiving HUD Assistance, HUD-assisted MMEs and Unassisted MMEs Residing in Study Geographic Areas Other than the NYC/NJ MSA, Age 65 or Older, 2008
- FIGURE 4: OR of Utilizing any Health Care Service, HUD-assisted and Unassisted Medicare-only Beneficiaries in the NYC/NJ MSA, Age 65 or Older, 2008
- FIGURE 5: OR of Utilizing any Health Care Service, HUD-assisted and Unassisted Medicare-only Beneficiaries Residing in Study Geographic Areas Other than the NYC/NJ MSA, Age 65 or Older, 2008
LIST OF TABLES
- TABLE 1: HUD Tenant-level and CMS Individual-level Administrative Data
- TABLE 2: Final Sample Consisting of Four Subgroups Stratified, by MME Status and NYC/NJ MSA
- TABLE 3: Proportion of MME and Medicare-only Beneficiaries in Study Sample who Received HUD Assistance, Age 65 or Older, 2008
- TABLE 4: Demographic, Clinical, and Prior Health Care Utilization, HUD-assisted MMEs and Unassisted MMEs Residing in the NYC/NJ MSA, Age 65 or Older, 2008
- TABLE 5: OR of Utilizing any Health Care Service and Parameter Estimates of Payment, HUD-assisted MMEs and Unassisted MMEs Residing in the NYC/NJ MSA, Age 65 or Older, 2008
- TABLE 6: Demographic, Clinical, and Prior Health Care Utilization, HUD-assisted MMEs and Unassisted MMEs Residing in Study Geographic Areas Other than the NYC/NJ MSA, Age 65 or Older, 2008
- TABLE 7: OR of Utilizing any Health Care Service and Parameter Estimates of Payment, HUD-assisted MMEs and Unassisted MMEs Residing in Study Geographic Areas Other than the NYC/NJ MSA, Age 65 or Older, 2008
- TABLE 8: Demographic, Clinical, and Prior Health Care Utilization, HUD-assisted and Unassisted Medicare-only Beneficiaries Residing in the NYC/NJ MSA, Age 65 or Older, 2008
- TABLE 9: OR of Utilizing any Health Care Service and Parameter Estimates of Payment, HUD-assisted and Unassisted Medicare-only Beneficiaries in the NYC/NJ MSA, Age 65 or Older, 2008
- TABLE 10: Demographic, Clinical, and Prior Health Care Utilization, HUD-assisted and Unassisted Medicare-only Beneficiaries Residing in Study Geographic Areas Other than the NYC/NJ MSA, Age 65 or Older, 2008
- TABLE 11: OR of Utilizing any Health Care Service and Parameter Estimates of Payment, HUD-assisted and Unassisted Medicare-only Beneficiaries Residing in Study Geographic Areas Other than the NYC/NJ MSA, Age 65 or Older, 2008
- TABLE A1: Counties Included in Each of the 12 Study Geographic Areas
- TABLE A2: Assignment of Chronic Conditions into 9 Chronic Condition Groups
- TABLE A3: Medicare Health Care Utilization Variable Definitions
- TABLE A4: Dependent Outcome Definitions and Model Specifications
- TABLE B1: Unadjusted Health Care Utilization and Payment, HUD-assisted MMEs and Unassisted MMEs Residing in the NYC/NJ MSA, Age 65 or Older, 2008
- TABLE B2: Unadjusted Health Care Utilization and Payment, HUD-assisted MMEs and Unassisted MMEs Residing in Study Geographic Areas Outside the NYC/NJ MSA, Age 65 or Older, 2008
- TABLE B3: Unadjusted Health Care Utilization and Payment, HUD-assisted and Unassisted Medicare-only Beneficiaries Residing in the NYC/NJ MSA, Age 65 or Older, 2008
- TABLE B4: Unadjusted Health Care Utilization and Payment, HUD-assisted and Unassisted Medicare-only Beneficiaries Residing in Study Geographic Areas Other than the NYC/NJ MSA, Age 65 or Older, 2008
ACRONYMS
The following acronyms are mentioned in this report and/or appendices.
| ADI | Area Deprivation Index |
|---|---|
| AMI | Area Median Income |
| CCW | Chronic Condition Warehouse |
| CMS | Centers for Medicare & Medicaid Services |
| DIB | Disability Insurance Benefits |
| DME | Durable Medical Equipment |
| DRG | Diagnosis Related Group |
| ED | Emergency Department |
| ER | Emergency Room |
| ESRD | End Stage Renal Disease |
| FFS | Fee-For-Service |
| FIPS | Federal Information Processing Standards |
| GDIT | General Dynamics Information Technology |
| HCBS | Home and Community-Based Services |
| HHS | U.S. Department of Health and Human Services |
| HMO | Health Maintenance Organization |
| HUD | U.S. Department of Housing and Urban Development |
| MAX | Medicaid Analytic eXtract |
| MME | Medicare-Medicaid Enrollee |
| MSP | Medicare Savings Program |
| NF | Nursing Facility |
| NYC/NJ MSA | New York City/New Jersey Metropolitan Statistical Area |
| OLS | Ordinary Least Squares |
| OR | Odds Ratio |
| PHA | Public Housing Authority |
| PIC | Public and Indian Housing Information Center |
| PIH | Public and Indian Housing |
| PMPM | Per Member Per Month |
| PRAC | Project Rental Assistance Contract |
| RAP | Rental Assistance Payment |
| SD | Standard Deviation |
| SNF | Skilled Nursing Facility |
| SSA | U.S. Social Security Administration |
| SSI | Supplemental Security Income |
| TOS | Type of Service |
| TRACS | Tenant Rental Assistance Certification System |
EXECUTIVE SUMMARY
Background
In March 2014, The Lewin Group (Lewin) produced a report for the U.S. Department of Health and Human Services (HHS)/Office of the Assistant Secretary for Planning and Evaluation and the U.S. Department of Housing and Urban Development (HUD) titled Picture of Housing and Health: Medicare and Medicaid Use Among Older Adults in HUD-Assisted Housing.1 The study included descriptive comparisons that showed HUD-assisted Medicare beneficiaries had 58% higher Medicare payments than unassisted Medicare beneficiaries living in the community. The higher expenditures for HUD-assisted Medicare beneficiaries in part reflected a higher proportion enrolled in Medicaid (70% vs. 13%). Such Medicare-Medicaid Enrollees (MMEs, or Duals) have spending almost twice as high as Medicare-only beneficiaries.2 Yet, examining only MMEs age 65+, HUD-assisted MMEs still had more chronic conditions which translated into higher health care utilization and payments than unassisted MMEs in the community.
The descriptive results from The Picture of Housing and Health study began to shed light on how HUD-assisted Medicare beneficiaries differed from the unassisted Medicare beneficiaries in the community. However, descriptive statistics failed to account for several factors. First, the results did not adjust for demographic characteristics or health care conditions associated with health care utilization beyond MME status. Second, the New York City/New Jersey Metropolitan Statistical Area (NYC/NJ MSA) represented over half the beneficiaries in the sample. Therefore, the differences in the NYC/NJ MSA assisted population could account for a number of the observed differences. Finally, we were unable to identify all nursing facility (NF) stays, regardless of payer, with our current data sources, which led to us excluding all beneficiaries who had any days in a Medicare covered skilled nursing facility (SNF) stay following a hospitalization or Medicaid covered NF stay.
Study Objective
This report, Picture of Housing and Health Part 2: Medicare and Medicaid use among older adults in HUD-assisted housing, controlling for confounding factors, expands on the first Picture of Housing and Health report. In particular, we addressed each of the three limitations outlined above. First, we stratified the sample into four subgroups that distinguish beneficiaries based on geography (NYC/NJ MSA vs. other geographic areas in the study sample) and MME status. Next, we identified number of days in a NF during 2008 using the Medicare Timeline file. This allowed us to be more inclusive in our study sample; we included beneficiaries who were in a NF 180 days or less as opposed to excluding all beneficiaries with any indication of a NF stay. Finally, we conducted linear and logistic regressions to examine if the higher health care utilization and spending for HUD-assisted Medicare beneficiaries relative to unassisted Medicare beneficiaries in the community identified in the first report remained after controlling for confounders.
We hypothesized that HUD-assisted Medicare beneficiaries' health care utilization and spending would remain higher than unassisted beneficiaries living in the community after controlling for confounders. The hypothesis was that beneficiaries receiving HUD assistance may be less-informed health care users and may forgo preventative or less costly health care services due to difficultly accessing health care services and, therefore, resort to more expensive services when the condition worsened. If the hypotheses were found to be true, it indicated that the vulnerable group of HUD-assisted Medicare beneficiaries, who have a high prevalence of chronic conditions and disabilities, may be a fruitful target group for policy interventions.
Methods
We created the sample from the matched dataset constructed in the Picture of Housing and Health study based on the 2008 HUD, HHS Centers for Medicare & Medicaid Services (CMS) Medicare, and CMS Medicaid data available at that time. We limited the study sample to Medicare beneficiaries age 65 or older with Parts A and B coverage not enrolled in a Medicare Health Maintenance Organization (i.e., Medicare Advantage) and who did not have 181 days or more in a NF in the 12 study jurisdictions (N=2,901,505). We stratified our sample into four subgroups:3
- MMEs in NYC/NJ MSA.
- MMEs in study geographic areas other than the NYC/NJ MSA.
- Medicare-only beneficiaries in NYC/NJ MSA.
- Medicare-only beneficiaries in study geographic areas other than the NYC/NJ MSA.
In order to test our hypotheses, we ran a series of regressions to examine the association between receiving HUD assistance and a number of health care utilization and payment outcomes. For each model, we included a binary indicator for receiving HUD assistance. The binary indicator for receiving HUD assistance estimates the effect of receiving HUD assistance on utilization and payment outcomes after accounting for the confounders included in the regression. We describe the control variables in the complete summary report.
Results
Medicare-Medicaid Enrollee Results
Figure ES1 presents the odds ratio (OR) of health care utilization for beneficiaries receiving HUD assistance estimated from the logistic regression models separately for the two MME subgroups. After accounting for differences in demographic, clinical, and prior health care use of the MMEs and characteristics of the markets4 in which the MMEs reside:
-
HUD-assisted MMEs were significantly less likely to have any acute inpatient stay and to have any Medicare covered SNF stay.
-
The results on emergency department (ED) visits were mixed. HUD-assisted MMEs in NYC/NJ MSA were significantly less likely to have three or more ED visits, but there was no significant difference in having any ED visit. The opposite was found for HUD-assisted MMEs in the study geographies outside of the NYC/NJ MSA; HUD-assisted MMEs were significantly more likely to have any ED visit, but not more or less likely to have three or more ED visits.
-
The overall lower utilization, along with the lower payment among those with any acute inpatient stays, contributed to a significantly lower Medicare payment of $632 for HUD-assisted MMEs versus unassisted MMEs in NYC/NJ MSA and $523 for HUD-assisted MMEs versus unassisted MMEs in the other study geographic areas outside of the MSA (see report for full results).
-
HUD-assisted MMEs who were fully eligible for Medicaid had higher utilization for Medicaid home and community-based services (HCBS) than unassisted MMEs. HUD-assisted MMEs were more than two times as likely to have any personal care services, more than 1.5 times as likely to have any use of durable medical equipment (DME), and more than 1.7 times as likely to have used other HCBS.
-
This higher utilization of Medicaid covered services contributed to significantly higher Medicaid payments for HUD-assisted MMEs compared to unassisted MMEs ($798 in NYC/NJ MSA; $464 in the other study geographic areas) (see report for full results).
| FIGURE ES1. OR of Utilizing any Health Care Service for MMEs Receiving HUD Assistance Relative to MMEs Not Receiving Assistance, Age 65 or Older, 2008 |
|---|
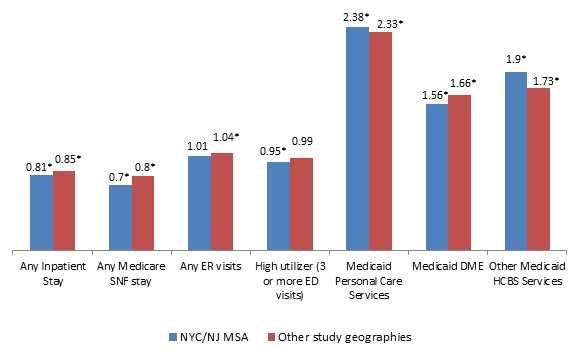 |
| * Indicates statistical significance at the 0.05 level. Personal care services, DME, and other HCBS are Medicaid covered services. |
Medicare-only Beneficiaries Results
Figure ES2 presents the OR of health care utilization for beneficiaries receiving HUD assistance estimated from the logistic regression models separately for the two Medicare-only beneficiary subgroups. HUD-assisted Medicare-only beneficiaries had higher utilization than unassisted Medicare-only beneficiaries. HUD-assisted Medicare-only beneficiaries were more likely to have any inpatient stay, more likely to have any Medicare covered SNF stay, more likely to have any ED visit, and more likely to have three or more ED visits in 2008 relative to unassisted Medicare-only beneficiaries. Despite the fact that HUD-assisted Medicare-only beneficiaries were more likely to use the key health care services included in our analysis, there was no significant difference in the Medicare fee-for-service (FFS) payments between the two groups (see report for full results).
| FIGURE ES2. OR of Utilizing any Health Care Service for Medicare-only Beneficiaries Receiving HUD Assistance Relative to Beneficiaries Not Receiving Assistance, Age 65 or Older, 2008 |
|---|
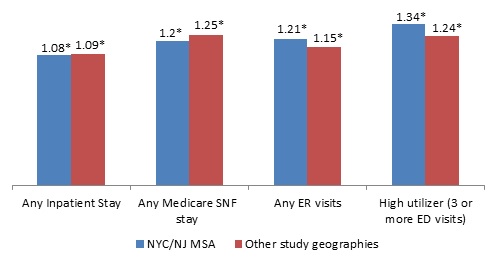 |
| * Indicates statistical significance at the 0.05 level. |
Discussion
To our knowledge, this study was the first attempt to compare health care utilization and spending between HUD-assisted Medicare beneficiaries and unassisted beneficiaries taking into account confounding factors. Knowing that the findings from the first report, Picture of Housing and Health,5 found high prevalence of chronic conditions and higher health care utilization for HUD-assisted Medicare beneficiaries compared to unassisted beneficiaries, we sought to understand whether the characteristics of the sample could explain the higher utilization. This information could help inform targeted interventions and policies among specific HUD-assisted subgroups to ensure appropriate use of health care services and to better meet resident needs.
In summary, after taking into account characteristics associated with health care utilization and payment, this study demonstrates that HUD-assisted Medicare beneficiaries do not consistently have higher health care utilization and payment than unassisted Medicare beneficiaries as originally hypothesized. On one hand, HUD-assisted MMEs were less likely to use certain Medicare covered services, such as acute inpatient stays and SNF stays, and they had significantly lower Medicare FFS payments than unassisted MMEs. Conversely, HUD-assisted MMEs were much more likely to use Medicaid covered community-based supportive services such as personal care services, DME, and HCBS and have higher Medicaid FFS payments. This suggests that perhaps HUD-assisted MMEs were more aware of Medicaid covered community-based supportive services than unassisted MMEs. HUD-assisted Medicare-only beneficiaries were also more likely to have any inpatient stay, Medicare covered SNF stay, and ED visit, but it did not result in significantly higher Medicare FFS payments relative to the unassisted Medicare-only beneficiaries.
While this indicates that HUD-assisted beneficiaries are not using more acute care health care services than unassisted beneficiaries after controlling for confounding factors, they still represent a vulnerable group with a high prevalence of chronic conditions and disabilities. The study demonstrates that HUD-assisted MMEs may be a fruitful target group for policy interventions, but that the interventions may vary depending on the type of Medicare beneficiary and the geographic location.
I. INTRODUCTION
A. Background
A large and rapidly expanding group of low-income and modest-income older adults face the dual challenges of finding affordable and safe housing that can also accommodate changing needs as they grow older. Millions of older adults who rent or own their own homes face excessive housing costs and/or live in housing with serious physical problems. In 2011, an estimated 3.9 million older renter households without children had very low incomes (50% or less of area median income [AMI]). Of these households, 37% faced severe housing cost burdens exceeding half their incomes without public housing assistance, and a similar proportion, 36%, did receive assistance.6
The Picture of Subsidized Households report stated that 1.4 million older adult renters received housing assistance in 2012.7 These older renters may have increased difficulty as they age, since they may experience a decline in their physical, cognitive, and/or mental health conditions.8 While the majority of these older renters are relatively healthy, data from the Assets and Health Dynamics Among the Oldest Old survey (Wave 2) show that relative to unassisted older renters, U.S. Department of Housing and Urban Development (HUD)-assisted renters report poorer health, more chronic conditions, significantly higher numbers of limitations in their ability to carry out basic activities of daily living and instrumental activities of daily living.9 Research has shown an association between the presence of these characteristics and high health care utilization and costs.10 This raises the question on whether or not the older adult renters receiving housing assistance have higher health care utilization than older adults not receiving rental subsidies.
B. Summary of the First Report: "Picture of Housing and Health"
The U.S. Department of Health and Human Services (HHS)/Office of the Assistant Secretary for Planning and Evaluation and HUD seek to better understand how HUD-assisted Medicare beneficiaries compare to unassisted beneficiaries in the community with regards to enrollment, chronic conditions, health care payment and utilization, and in September 2010 contracted with The Lewin Group (Lewin) to test whether HUD administrative data could be matched with Medicare and Medicaid claims data. In March 2014, Lewin produced a report titled Picture of Housing and Health: Medicare and Medicaid Use Among Older Adults in HUD-Assisted Housing.11 The study linked HUD individual tenant-level and the HHS Centers for Medicare & Medicaid Services (CMS) beneficiary level administrative data (enrollment and payment and utilization claims data) for the first time. While limited to 12 geographic areas, it demonstrated the feasibility of linking these rich data sources to conduct numerous informative analyses that can shed light on the advisability of investing in programs that might improve the health and well-being of individuals with HUD-assisted housing. In addition, the report also provided descriptive comparisons of HUD-assisted Medicare beneficiaries to unassisted Medicare beneficiaries, highlighting areas of potential future analyses.
The Picture of Housing and Health study included descriptive comparisons between HUD-assisted and unassisted Medicare beneficiaries living in the community. HUD-assisted Medicare beneficiaries had 58% higher Medicare payments than unassisted Medicare beneficiaries living in the community. The higher expenditures for HUD-assisted Medicare beneficiaries likely reflected the fact that Medicare enrollees in the HUD-assisted sample are much more likely than unassisted Medicare enrollees in the same communities to be enrolled in Medicaid as well (70% vs. 13%.) Such Medicare-Medicaid enrollees (MMEs or Duals) have spending almost twice as high as Medicare-only beneficiaries.12
Given the difference in MME enrollment among HUD-assisted beneficiaries and unassisted beneficiaries in the community, the first report compared the results between similar subgroups and tried to account for underlying differences in the use of nursing homes among the two groups. The first group included MMEs age 65+ with no Medicare covered skilled nursing facility (SNF) stay following a hospitalization or Medicaid covered nursing facility (NF) use. The second group analyzed included Medicare-only age 65+ with no Medicare covered SNF use. HUD-assisted MMEs age 65+ had more chronic conditions, which translated into higher health care utilization and payments than unassisted MMEs in the community. Approximately 55% of HUD-assisted MMEs had five or more chronic conditions, compared to 43% of unassisted MMEs in the community. The higher utilization for HUD-assisted MMEs was most notable for home health visits (31% higher), ambulatory surgery center visits (45% higher), other procedures (78% higher), durable medical equipment (DME) (22% higher), Part B services (22% higher) and Part D drugs (24% higher). As expected, this higher utilization resulted in 16% higher average Medicare per member per month (PMPM) payments (medical and pharmacy) for HUD-assisted MME beneficiaries than unassisted MME beneficiaries. In addition, HUD-assisted Medicare-only beneficiaries had 8% higher Medicare PMPM than unassisted beneficiaries due to the substantially higher utilization of costly services among the HUD-assisted sample.
The descriptive results from the Picture of Housing and Health study began to shed light on how HUD-assisted Medicare beneficiaries differed from the unassisted Medicare beneficiaries in the community. However, study limitations did not allow us to identify future paths of research and policy interventions. First, the strictly descriptive analyses did not adjust for demographic characteristics or health care conditions associated with health care utilization beyond MME status. In addition, the New York City/New Jersey Metropolitan Statistical Area (NYC/NJ MSA) represented over half the beneficiaries studied. Therefore, the differences in the NYC/NJ MSA assisted population could account for a number of the observed differences. Finally, the data did not allow us to identify all NF stays and beneficiaries with a long NF stay differ in health status and tend to use more health care services.13 The data available for the first report lacked information for NF stays paid by sources others that Medicare or Medicaid (e.g., individuals with private long-term care insurance, paying with their own income/resources). Therefore, the first report failed to capture some NF use, especially among the unassisted Medicare-only age 65+ with no Medicare covered SNF use.
C. Picture of Housing and Health Part 2: Study Objectives and Hypotheses
This report, Picture of Housing and Health Part 2: Medicare and Medicaid Use Among Older Adults in HUD-assisted Housing, Controlling for Confounding Factors, expands on the first Picture of Housing and Health report using the same matched data set with some enhancements. In particular, we address each of the three limitations outlined above. First, we stratify the sample into four subgroups that distinguish beneficiaries based on geography (NYC/NJ MSA vs. other geographic areas in the study sample) and MME status.14 Next, we identify number of days in a NF during 2008 by matching to the Medicare Timeline file. This allowed us to be more inclusive in our study sample; we included beneficiaries in a NF less than 180 days as opposed to excluding all beneficiaries with any number of days covered by the Medicare SNF benefit. Finally, we conducted linear and logistic regressions to examine whether the higher health care utilization and spending for HUD-assisted Medicare beneficiaries relative to unassisted Medicare beneficiaries in the community identified in the first report remained after controlling for confounders, such as race/ethnicity, age, geography, chronic conditions, and market characteristics.
We hypothesized that the HUD-assisted Medicare beneficiaries' health care utilization and spending would remain higher than unassisted beneficiaries living in the community. We based this on the assumption that beneficiaries receiving HUD-assistance may be less-informed users of health care and may forgo preventative or less costly health care services due to limited access and instead resort to more expensive services when the condition has worsened. Such a finding would indicate that HUD-assisted Medicare beneficiaries, who have a high prevalence of chronic conditions and disabilities, may prove a fruitful target group for policy interventions.
II. METHODS
A. Data
We based the analysis on tenant-level administrative data from HUD and individual-level administrative data from CMS in the table below and described in detail in Appendix A. Note that while we received HUD and CMS Medicare data for 2007-2009, our results are based on 2008, because 2009 Medicaid data were not available from CMS at the time.
| TABLE 1. HUD Tenant-level and CMS Individual-level Administrative Data | ||
|---|---|---|
| HUD Tenant-Level Administrative Data | CMS Individual-Level Administrative Data | |
| Years | 2007, 2008, and 2009 |
|
| Data Sources |
|
|
The data included individuals in our 12 geographic areas of interest for this study. Given the Picture of Housing and Health objectives, we chose geographic areas that have unique public housing with services models:
- New Haven-Milford, Connecticut
- Bridgeport-Stamford-Norwalk, Connecticut
- Milwaukee-Waukesha-West Allis, Wisconsin
- San Francisco-Oakland-Fremont, California
- Boston-Cambridge-Quincy, Massachusetts
- Durham-Chapel Hill, North Carolina
- Richmond, Virginia
- New York-Northern New Jersey-Long Island
- Columbus, Ohio
- Akron, Ohio
- Cleveland, Ohio
- The entire State of Vermont
B. Study Samples
To create the study sample, we began with the same 2008 matched dataset as in the Picture of Housing and Health study as it was the most recent year for which we had data on HUD, CMS Medicare, and CMS Medicaid enrollment at that time. In this section, we describe the specific criteria we used to identify beneficiaries for this analysis and the resulting sample size. We also conducted analyses to inform our decision to stratify the sample into four subgroups based on geography and Medicaid enrollment, also described below.
| FIGURE 1. Study Sample Inclusions and Resulting Sample Size |
|---|
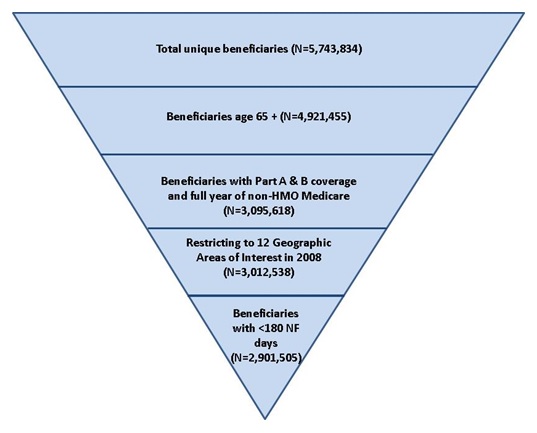 |
Figure 1 presents the sample inclusion criteria and resulting sample size. The 2008 Medicare Beneficiary Summary File received from CMS included 5,743,834 unique beneficiaries from our geographic areas of interest. We limited the sample to beneficiaries age 65 or older enrolled in fee-for-service (FFS) Medicare, Parts A and B, for all 12 months of 2008 or up until death. We excluded beneficiaries enrolled in a Medicare Health Maintenance Organization (HMO) at any point during 2008 because these beneficiaries did not have claim-level use and spending information in our data sources beyond the monthly capitated amounts paid to the HMO. Next, we excluded any beneficiaries included in the Medicare Beneficiary Summary File who did not reside in one of the 12 geographic areas of interest in 2008. Finally, we excluded individuals in a NF for at least six months in 2008 (181 days or more) for two main reasons. First, unassisted beneficiaries in the community had more days in a NF compared to HUD-assisted beneficiaries (16 vs. 9 days on average).15 This is partially a result of the unassisted beneficiary sample including full-time nursing home residents, which would not be the case for the HUD-assisted Medicare beneficiary sample. In addition, beneficiaries who spend a longer amount of time in a NF during a calendar year differ in health status, health care utilization and costs, and are less likely to transition back into the community than beneficiaries with less NF utilization.16 We retained individuals who died in 2008 in the study.17 The final sample size was 2,901,505.
Four Subgroups
In order to construct HUD-assisted and unassisted beneficiary samples with comparable characteristics, we created two strata, resulting in four subgroups.
Our descriptive analysis in Picture of Housing and Health highlighted two characteristics that we explored to determine whether to control for the characteristics in the regression models or use the characteristics to define subgroups. The two characteristics were: (1) MME status; and (2) residing in the NYC/NJ MSA versus the other geographic areas included in the study.
A much higher proportion of HUD-assisted Medicare beneficiaries than unassisted beneficiaries had MME status (70% vs. 10%). MMEs have 1.8 times higher spending than Medicare-only beneficiaries without Medicaid.18 Therefore, to determine if it was sufficient to include an indicator for MME status in the regression models, we ran two separate regressions--one for MMEs and one for Medicare-only19 beneficiaries. We compared the regression results of the two samples, particularly the parameter associated with receiving HUD-assistance. If the parameter indicating receiving HUD assistance was similar for the MME and the Medicare-only samples, we would not stratify based on MME status and would control for it within the regression. However, the results were different enough for the two stratified samples that we decided to run the analyses separately for MME and Medicare-only beneficiaries.
Second, we stratified the sample based on geographic location: NYC/NJ MSA versus all other locations. Approximately 51% of our sample consisted of beneficiaries from the NYC/NJ MSA. State Medicaid program choices, as well as health care supply within a market, are associated with health care utilization and costs.20 Therefore, similar to exploring the optimal treatment of MME status, we ran the regressions separately on beneficiaries located in the NYC/NJ MSA and beneficiaries in all other geographic locations included in our sample. Again, the parameters indicating receiving HUD assistance were different enough for the two samples that we decided to run the analyses separately for NYC/NJ MSA and the other 11 geographic areas. We further tested the impact of the NYC/NJ MSA geographic area on each of the independent variables by testing the statistical significance of multiple interaction terms that were included in the model. We interactedeach independent variable with a binary variable for being located in the NYC/NJ MSA versus all other locations, resulting in twice the number of independent variables in the model. We found that the majority of the interaction terms were statistically significant, suggesting that residence in the NYC/NJ MSA had a significant impact on the relationship between the independent variables and outcomes of interest. Therefore, we stratified the sample by residing in NYC/NJ MSA versus all other study locations. Table 2 shows the final sample size of the four subgroups.
| TABLE 2. Final Sample Consisting of Four Subgroups Stratified, by MME Status and NYC/NJ MSA | |
|---|---|
| Subgroup | N |
| MMEs in NYC/NJ MSA | 236,161 |
| Medicare-only beneficiaries in NYC/NJ MSA | 1,245,645 |
| MMEs in study geographic areas other than the NYC/NJ MSA | 182,783 |
| Medicare-only beneficiaries in study geographic areas other than the NYC/NJ MSA | 1,236,916 |
| Total unique Medicare beneficiaries | 2,901,505 |
C. Outcomes
Our analysis included the following health care utilization and payment outcomes:
-
Any acute inpatient stay.
-
Any Medicare covered SNF stay.
-
Any emergency department (ED) visit without hospitalization.
-
High utilizer (defined as having three or more ED visits without hospitalization).
-
Annual Medicare acute inpatient stay FFS payments, among beneficiaries who had at least one inpatient stay.
-
Annual Medicare FFS payments (excluding Part D pharmacy).21
-
Among MMEs who receive full Medicaid benefits for services not included in Medicare:22
- Annual Medicaid FFS payments.
- Annual Medicare + Medicaid FFS payments (excluding Medicare pharmacy).
- Various Medicaid home and community-based services (HCBS):
- Any Medicaid personal care services.
- Any Medicaid DME.
- Any other Medicaid HCBS (private duty nursing, adult day care, home health, rehab, targeted case management, transportation, and hospice).
See Appendix A for a complete listing of outcome definitions.
D. Statistical Methods
We conducted descriptive and multivariate analyses to examine health care utilization and payments among Medicare beneficiaries receiving HUD assistance compared to unassisted beneficiaries in the community. These analyses compared the means and distributions of demographic, clinical, prior health care use, and market supply characteristics between HUD-assisted and unassisted Medicare beneficiaries, as well as all outcome measures.
We ran multiple regression analyses to compare health care utilization and outcomes between beneficiaries who received HUD assistance and those who did not receive HUD assistance and were living in the community. The regression models were specified based on the distribution of the health care utilization or payment outcome. For the outcomes any ED visit without hospitalization, any acute inpatient stay, any Medicare covered SNF stay, and an indicator for high utilizers (defined as three or more ED visits), and specific Medicaid HCBS utilization (any personal care services, DME, and other HCBS), we conducted logistic regressions that yielded an odds ratio (OR) and confidence interval for each independent variable in the model.
For annual Medicare payments, annual Medicaid payments, and annual Medicare and Medicaid payments, we used a linear, ordinary least squares (OLS) regression to determine an estimate for the difference in payments between HUD-assisted beneficiaries and beneficiaries not receiving HUD assistance.
Approximately 78% of Medicare beneficiaries had no Medicare acute inpatient stay payments. Therefore, for annual Medicare acute inpatient stay payments, we used a two-part model: a logistic regression on all observations and then a linear, OLS regression on observations that had non-zero Medicare payments for an acute inpatient stay. Part 1 estimated the likelihood of HUD-assisted versus unassisted beneficiaries having any payments for an acute inpatient stay in 2008. Part 2 predicted the magnitude of difference for the two groups among those individuals who had any positive payments for an acute inpatient stay.23
For each model, we included a binary indicator for receiving HUD assistance. This is the primary independent variable of interest for this study. The binary indicator for receiving HUD assistance estimates the effect of receiving HUD assistance on utilization and payment outcomes after adjusting for all other confounders included in the regression. We also included a series of variables to control for factors associated with the outcome and primary independent variable. The control variables were determined on a theoretical basis and by completing descriptive analyses of the sample.
Income data were not available for the unassisted beneficiaries. Given the known association between income/socioeconomic characteristics and health care utilization and spending,24 we included a binary indicator to proxy beneficiaries' socioeconomic disadvantage based on Area Deprivation Index (ADI).25 The ADI provides a composite measure that incorporates the following for each geographic area: education attainment, employment in white-collar occupations, home values and rent, income disparity, poverty level, size of home, size of household per room, households with telephones and motor vehicles, and households receiving Supplemental Security Income (SSI) and household assistance income.
The independent and control variables included the following:
-
Binary indicator identifying beneficiaries receiving HUD assistance versus not receiving HUD assistance (primary independent variable of interest).
- A positive and statistically significant covariate on this variable demonstrates that receiving HUD assistance is correlated with having higher utilization or spending.
- A positive and statistically significant covariate on this variable demonstrates that receiving HUD assistance is correlated with having higher utilization or spending.
-
Binary indicator to proxy beneficiaries' socioeconomic disadvantage based on ADI.
- Areas with ADI at or above the 85th percentile (corresponding to 113.45) had significantly higher readmission rates and adverse health outcomes.
- Areas with ADI at or above the 85th percentile (corresponding to 113.45) had significantly higher readmission rates and adverse health outcomes.
-
Individual demographic characteristics:
- Age (65; 65-74; 75-79; 80-84).
- Binary indicator: Female.
- Race/ethnicity (White non-Hispanic; Hispanic; Black; Asian; Indian; other race).
- Binary indicator: Disabled (based on original reason for Medicare).
-
Prior use of health care, 2007:
- Binary indicator: Any acute inpatient stay.
- Binary indicator: Any Medicare covered SNF stays.
- Binary indicator: Any ED visit.
- Total Medicare FFS payments.
- Total Medicaid FFS payments.
-
Health indicators:
- Binary indicator: Depression.
- Count of chronic conditions.
- Indicator for death during 2008.
- 2008 NF use:26 no NF days; Short-term NF stay (1-30 days); Long-term NF stay (31-179 days).
- Although we exclude beneficiaries that were in the NF for six months or more in 2008, we still control for length of stay in a NF. Beneficiaries who have long stays in a NF differ from beneficiaries who do not have long stays. Therefore, this variable helps to capture those differences as well as controls for the additional cost of being in a NF.
- Geographic variation in Medicaid policies.
- Indicators for the states in the study sample.
- Indicators for the states in the study sample.
-
Market supply of health care providers.27 Market supply of health care providers is known to be associated with health care utilization and cost.
-
Primary care physicians per 10,000 residents age 65 or older.
-
Specialists per 10,000 residents age 65 or older.
-
Hospital beds per 10,000 residents age 65 or older.
-
SNF total beds per 10,000 residents age 65 or older.
-
III. RESULTS
Our final sample consisted of 2,901,505 Medicare beneficiaries age 65 or older in the 12 geographic areas of interest for this study. Approximately 7% (N=189,150) of the sample received HUD assistance in 2008. As described in the Methods section above, we stratified the sample into four subgroups based on MME status and geographic location. Both characteristics are associated with health care utilization and payments, and over 70% of the HUD-assisted sample was MMEs while over half of the sample resided in the NYC/NJ MSA. Our statistical tests confirmed that we needed to stratify by these characteristics as controlling for them was not sufficient. Therefore, the results presented below are organized by the four subgroups:
- MMEs residing in the NYC/NJ MSA [Section A];
- MMEs residing in study geographic areas other than the NYC/NJ MSA [Section B];
- Medicare-only beneficiaries residing in the NYC/NJ MSA [Section C]; and
- Medicare-only beneficiaries residing in study geographic areas other than the NYC/NJ MSA [Section D].
Table 3 presents the proportion of MME and Medicare-only beneficiaries who were HUD-assisted in the overall sample and the four subgroups. Among the Medicare-only subgroups, only 2-3% received HUD assistance. By contrast, of the MME subgroups, appropriately 30-33% received HUD assistance. When comparing the HUD-assisted and unassisted beneficiaries, approximately 70% (132,855/189,150) of the HUD-assisted beneficiaries were MMEs, compared with only 11% (286,089/2,712,355) of unassisted beneficiaries. This indicates that Medicare beneficiaries receiving HUD-assistance are a more vulnerable population than the general Medicare population.
| TABLE 3. Proportion of MME and Medicare-only Beneficiaries in Study Sample who Received HUD Assistance, Age 65 or Older, 2008 | ||||||||||||
|---|---|---|---|---|---|---|---|---|---|---|---|---|
| NYC/NJ MSA | Study Geographic Areas Other Than NYC/NJ MSA | All Study Geographic Areas | ||||||||||
| MME (N=236,161) Section A | Medicare-only (N=1,245,645) Section C | MME (N=182,783) Section B | Medicare-only (N=1,236,916) Section D | MME (N=418,944) | Medicare-only (N=2,482,561) | |||||||
| N | % | N | % | N | % | N | % | N | % | N | % | |
| HUD-assisted beneficiaries | 77,716 | 33 | 32,216 | 3 | 55,139 | 30 | 24,079 | 2 | 132,855 | 32 | 56,295 | 2 |
| Unassisted beneficiaries | 158,445 | 67 | 1,213,429 | 97 | 127,644 | 70 | 1,212,837 | 98 | 286,089 | 68 | 2,426,266 | 98 |
For each of the four study subgroups, we compared the demographic, clinical, and prior utilization characteristics of HUD-assisted and unassisted beneficiaries. We then present the results from the regressions, which determined whether there was a statistically significant association between receiving HUD assistance and health care utilization and payment after controlling for potential confounders.28
A. Medicare-Medicaid Enrollees Residing in the NYC/NJ MSA, Age 65 or Older, 2008
A1. Demographic, Clinical, and Prior Utilization Characteristics
Approximately 33% of the 236,161 MMEs residing in the NYC/NJ MSA in 2008 received HUD-assistance. Table 4 displays the descriptive results for the demographic, clinical, and prior utilization characteristics included in the regression models. MMEs residing in the NYC/NJ MSA in 2008 who received HUD-assistance are compared to enrollees in the community without any housing assistance.
-
HUD-assisted MMEs were more likely to live in areas with a deprivation index above the 85th percentile, an indicator for socioeconomic disadvantage, than unassisted MMEs. Approximately 36% of HUD-assisted MMEs lived in areas with a deprivation index above the 85th percentile compared to 17% of unassisted MMEs.
-
The distribution of HUD-assisted and unassisted MMEs across race/ethnicity and gender was generally similar except HUD-assisted MMEs had a greater proportion of Hispanic (29% vs. 25%), while unassisted MMEs had a greater proportion of Asian beneficiaries (15% vs. 8%).
-
While our sample was limited to beneficiaries age 65 and older, within that sample, the HUD-assisted MMEs were on average younger than unassisted MMEs. HUD-assisted MMEs had a smaller proportion of beneficiaries age 85 and older than unassisted MMEs (17% vs. 23%).
-
HUD-assisted MMEs had a smaller proportion of beneficiaries die in 2008 in comparison with unassisted enrollees (4% vs. 11%).
-
HUD-assisted MMEs had a higher prevalence of depression than unassisted MMEs (18% vs. 13%) and were more likely to qualify for Medicare based on disability (15% vs. 13%).
-
HUD-assisted MMEs lived in areas where there was a higher supply of acute care hospital beds per 10,000 persons age 65 and over than unassisted MMEs (325 vs. 285). Market supply of SNF total beds and physicians was similar between the two groups.
| TABLE 4. Demographic, Clinical, and Prior Health Care Utilization, HUD-assisted MMEs and Unassisted MMEs Residing in the NYC/NJ MSA, Age 65 or Older, 2008 | ||||
|---|---|---|---|---|
| HUD-assisted MMEs (N=77,716) | Unassisted MMEs (N=158,445) | |||
| Gender | N | % | N | % |
| Female | 55,843 | 71.9% | 109,069 | 68.8% |
| Male | 21,873 | 28.1% | 49,376 | 31.2% |
| Race/Ethnicity | N | % | N | % |
| White non-Hispanic | 31,635 | 40.7% | 65,914 | 41.6% |
| Black non-Hispanic | 14,882 | 19.1% | 23,485 | 14,8% |
| Hispanic | 22,400 | 28.8% | 39,010 | 24.6% |
| Asian | 6,367 | 8.2% | 24,322 | 15.4% |
| American Indian | 63 | 0.1% | 318 | 0.2% |
| Other | 2,369 | 3.0% | 5,396 | 3.4% |
| Age | N | % | N | % |
| Ages 65-69 | 13,404 | 17.2% | 27,738 | 17.5% |
| Ages 70-74 | 19,207 | 24.7% | 34,464 | 21.8% |
| Ages 75-79 | 17,278 | 22.2% | 31,329 | 19.8% |
| Ages 80-84 | 14,645 | 18.8% | 27,856 | 17.6% |
| Ages 85+ | 13,182 | 17.0% | 37,058 | 23.4% |
| Original Reason for Enrollment | N | % | N | % |
| Old age and survivor's insurance | 65,801 | 84.7% | 137,637 | 86.9% |
| DIB | 11,645 | 15.0% | 20,215 | 12.8% |
| ESRD | 147 | 0.2% | 314 | 0.2% |
| Disability Insurance and ESRD | 123 | 0.2% | 279 | 0.2% |
| Life Status | N | % | N | % |
| Died in 2008 | 3,288 | 4.2% | 16,664 | 10.5% |
| Disability Status | N | % | N | % |
| Disabled (Medicare determination) | 11,768 | 15.1% | 20,494 | 12.9% |
| Chronic Condition Prevalence (means) | Mean | SD | Mean | SD |
| Number of Chronic Conditions | 5.87 | 2.95 | 4.96 | 2.99 |
| Chronic Condition Prevalence | N | % | N | % |
| Depression | 14,129 | 18.2% | 21,170 | 13.4% |
| NF Utilization | N | % | N | % |
| No NF Days | 72,050 | 92.7% | 138,379 | 87.3% |
| Under 30 Total NF Days | 2,486 | 3.2% | 6,726 | 4.2% |
| 31-179 Days in NF | 3,124 | 4.0% | 13,303 | 8.4% |
| ADI | N | % | N | % |
| Residing in an Area At or Above the 85th Percentile of ADI | 27,619 | 35.5% | 27,170 | 17.1% |
| Market Supply | Mean | SD | Mean | SD |
| Physicians per 10,000 Persons Age 65+ (2010) | 63.90 | 22.62 | 63.28 | 21.83 |
| SNF Total Beds per 10,000 Persons Age 65+ (2008) | 425.52 | 160.57 | 422.25 | 136.42 |
| Specialists per 10,000 Persons Age 65+ (2008) | 160.87 | 91.23 | 146.98 | 83.52 |
| Acute Care Hospital Beds per 10,000 Persons Age 65+ (2008) | 325.26 | 153.15 | 285.19 | 151.04 |
| Prior Use (2007) | Mean | SD | Mean | SD |
| Outpatient ED Visits 2007 | 0.33 | 0.87 | 0.28 | 0.92 |
| Acute Stay Admissions 2007 | 0.48 | 1.13 | 0.49 | 1.18 |
| Medicare Covered SNF Stays 2007 | 0.05 | 0.29 | 0.09 | 0.42 |
| Total Medicare Payment (non-Part D) per Member 2007 | $13,139 | $23,113 | $12,560 | $25,753 |
| Total Medicaid Payment Payments per Member 2007 | $22,413 | $29,295 | $18,925 | $30,831 |
A2. Health Care Utilization and Payment Controlling for Other Characteristics, 2008
Table 5 presents the results of the logistic and OLS regressions of health care utilization and payment with the primary predictor of receiving HUD assistance for MMEs age 65 or older residing in the NYC/NJ MSA in 2008. Figure 2 presents the OR of health care utilization for beneficiaries receiving HUD assistance estimated from the logistic regression models. An OR provides the relative risk of HUD-assisted beneficiaries having an outcome compared to unassisted beneficiaries, controlling for other characteristics. As a result, an OR greater than 1.0, and statistically significant at the 0.05 level, indicates the outcome is more likely among HUD-assisted beneficiaries. An OR less than 1.0, and statistically significant, indicates the outcome is less likely among HUD-assisted beneficiaries.
| FIGURE 2. OR of Utilizing any Health Care Service for HUD-assisted MMEs and Unassisted MMEs Residing in the NYC/NJ MSA, Age 65 or Older, 2008 |
|---|
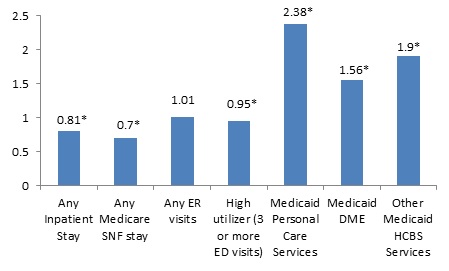 |
| * Indicates statistical significance at the 0.05 level. |
| TABLE 5. OR of Utilizing any Health Care Service and Parameter Estimates of Payment, HUD-assisted MMEs and Unassisted MMEs Residing in the NYC/NJ MSA, Age 65 or Older, 2008 | |||
|---|---|---|---|
| MME, NYC/NJ MSA (N=236,161) Receiving HUD Assistance (ref: unassisted) | |||
| Medicare Service Utilization | OR | Lower Confidence Limit | Upper Confidence Limit |
| Any Inpatient Stay | 0.81* | 0.79 | 0.84 |
| Any SNF Stay | 0.70* | 0.67 | 0.73 |
| Any ED Visits | 1.01 | 0.99 | 1.04 |
| High Utilizer (3 or more ED visits) | 0.95* | 0.91 | 0.99 |
| Annual Medicare Payments Per Member | OLS Parameter Estimate | ||
| Medicare Payment for Inpatient Acute Stays, among Beneficiaries with at least 1 Inpatient Stay | -$428 | ||
| Medicare Payment (excluding Part D payments) | -$632* | ||
| Utilization and Payment among MMEs who Receive Full Medicaid Benefits for Services not included in Medicare | (N=219,879) | ||
| Medicaid Service Utilization | OR | Lower Confidence Limit | Upper Confidence Limit |
| Personal Care Services | 2.38* | 2.32 | 2.44 |
| DME | 1.56* | 1.53 | 1.60 |
| Other HCBS | 1.90* | 1.86 | 1.95 |
| Annual Medicare and Medicaid Payments Per Member | OLS Parameter Estimate | ||
| Medicaid Payment | $799* | ||
| Medicare and Medicaid Payment | $493 | ||
| * Indicates statistical significance at the 0.05 level. ** Private duty nursing, adult day care, home health, rehab, targeted case management, transportation, and hospice. | |||
After adjusting for differences in demographic, clinical, and prior health care use of the MMEs and characteristics of the markets in which the MMEs reside:
-
HUD-assisted MMEs in the NYC/NJ MSA were 19% less likely to have any acute stay, 30% less likely to have any Medicare covered SNF stay, and 5% less likely to have three or more ED visits.
-
The lower utilization contributed to a significantly lower Medicare payment for HUD-assisted MMEs than for unassisted MMEs, with an average difference of $632.
-
HUD-assisted MMEs who received full Medicaid benefits for services not included in Medicare had much higher utilization for Medicaid HCBS than did unassisted MMEs. HUD-assisted MMEs were much more likely to use Medicaid HCBS: 2.4 times more likely to have any personal care services, 1.6 times more likely to have any use of DME, and 1.9 times more likely to have used other HCBS.
-
This higher utilization of Medicaid covered services contributed to significantly higher ($799) Medicaid payments for HUD-assisted MMEs than for unassisted MMEs.
B. Medicare-Medicaid Enrollees Residing in Study Geographic Areas Other Than the NYC/NJ MSA, Age 65 or Older, 2008
B1. Demographic, Clinical, and Prior Utilization Characteristics
Approximately 30% of the 182,783 MMEs residing in the study geographic areas other than the NYC/NJ MSA in 2008 received HUD-assistance. Table 6 displays the descriptive results for the demographic, clinical, and prior utilization characteristics included in the regression models. MMEs residing in the study geographic areas other than the NYC/NJ MSA in 2008 who received HUD-assistance are compared to unassisted MMEs in the community.
-
HUD-assisted MMEs were more likely to live in areas with a deprivation index above the 85th percentile than unassisted MMEs. Approximately 21% of HUD-assisted MMEs lived in areas with a deprivation index above the 85th percentile, compared with 10% of unassisted MMEs.
-
HUD-assisted MMEs were on average younger than unassisted MMEs. HUD-assisted MMEs had a smaller proportion of beneficiaries age 85 and older than unassisted MMEs (16% vs. 22%).
-
Most likely related to being a younger population, HUD-assisted MMEs had a smaller proportion of beneficiaries die in 2008 than unassisted enrollees (4% vs. 11%).
-
HUD-assisted MMEs had a higher prevalence of depression than unassisted MMEs. (19% vs. 15%) and were more likely to qualify for Medicare based on disability (20% vs. 17%).
-
The distributions of HUD-assisted MMEs and unassisted MMEs were fairly similar across the study MSAs, with a few exceptions. Boston-Cambridge-Quincy had a larger share of HUD-assisted MMEs than of unassisted MMEs (33% vs. 24%), and shares of HUD-assisted MMEs were smaller in Vermont (5% vs. 10%) and in Milwaukee, Wisconsin (8% vs. 11%).
-
Relative to unassisted MMEs, HUD-assisted MMEs lived in areas where there was a higher supply of specialists (164 vs. 133) and a greater supply of acute care hospital beds (319 vs. 266) per 10,000 persons age 65 and over.
| TABLE 6. Demographic, Clinical, and Prior Health Care Utilization, HUD-assisted MMEs and Unassisted MMEs Residing in Study Geographic Areas Other than the NYC/NJ MSA, Age 65 or Older, 2008 | ||||
|---|---|---|---|---|
| HUD-assisted MMEs (N=55,139) | Unassisted MMEs (N=127,644) | |||
| Gender | N | % | N | % |
| Female | 38,495 | 69.8% | 85,994 | 67.4% |
| Male | 16,644 | 30.2% | 41,650 | 32.6% |
| Race/Ethnicity | N | % | N | % |
| White non-Hispanic | 28,829 | 52.3% | 71,678 | 56.2% |
| Black non-Hispanic | 9,591 | 17,4% | 17,161 | 13,4% |
| Hispanic | 5,482 | 9.9% | 13,130 | 10.3% |
| Asian | 9,830 | 17.8% | 23,387 | 18.3% |
| American Indian | 66 | 0.1% | 149 | 0.1% |
| Other | 1,341 | 2.4% | 2,139 | 1.7% |
| Age | N | % | N | % |
| Ages 65-69 | 11,788 | 21.4% | 26,554 | 20.8% |
| Ages 70-74 | 13,170 | 23.9% | 27,325 | 21.4% |
| Ages 75-79 | 11,739 | 21.3% | 24,299 | 19.0% |
| Ages 80-84 | 9,716 | 17.6% | 22,006 | 17.2% |
| Ages 85+ | 8,726 | 15.8% | 27,460 | 21.5% |
| Original Reason for Enrollment | N | % | N | % |
| Old Age and Survivor's Insurance | 43,853 | 79.5% | 105,368 | 82.5% |
| DIB | 11,149 | 20.2% | 21,922 | 17.2% |
| ESRD | 65 | 0.1% | 185 | 0.1% |
| Disability Insurance and ESRD | 72 | 0.1% | 169 | 0.1% |
| Life Status | N | % | N | % |
| Died in 2008 | 2,266 | 4.1% | 13,847 | 10.8% |
| Disability Status | N | % | N | % |
| Disabled (Medicare determination) | 11,221 | 20.4% | 22,091 | 17.3% |
| MSA | N | % | N | % |
| Vermont | 2,994 | 5.4% | 12,292 | 9.6% |
| New Haven-Milford | 2,856 | 5.2% | 5,973 | 4.7% |
| Bridgeport-Stamford-Norwalk | 2,446 | 4.4% | 4,528 | 3.5% |
| Milwaukee-Waukesha-West Allis | 4,108 | 7.5% | 14,251 | 11.2% |
| San Francisco-Oakland-Fremont | 15,572 | 28.2% | 35,686 | 28.0% |
| Boston-Cambridge-Quincy | 18,418 | 33.4% | 31,106 | 24.4% |
| Durham-Chapel Hill | 563 | 1.0% | 2,572 | 2.0% |
| Richmond | 334 | 0.6% | 3,526 | 2.8% |
| Columbus | 2,296 | 4.2% | 5,642 | 4.4% |
| Akron | 1,204 | 2.2% | 2,465 | 1.9% |
| Cleveland | 4,348 | 7.9% | 9,603 | 7.5% |
| Chronic Condition Prevalence (Means) | Mean | SD | Mean | SD |
| Number of Chronic Conditions | 4.8 | 2.8 | 4.3 | 2.8 |
| Chronic Condition Prevalence | N | % | N | % |
| Depression | 10,548 | 19.1% | 19,570 | 15.3% |
| NF Utilization | N | % | N | % |
| No NF Days | 49,861 | 90.4% | 108,393 | 84.9% |
| Under 30 Total NF Days | 2,654 | 4.8% | 7,118 | 5.6% |
| 31-179 days in NF | 2,574 | 4.7% | 12,111 | 9.5% |
| ADI | N | % | N | % |
| Residing in an Area At or Above the 85th Percentile of ADI | 11,466 | 20.8% | 12,067 | 9.5% |
| Market Supply | Mean | SD | Mean | SD |
| Physicians per 10,000 Persons Age 65+ (2010) | 82.8 | 26.4 | 76.8 | 25.8 |
| SNF Total Beds per 10,000 Persons Age 65+ (2008) | 448.1 | 122.9 | 436.1 | 132.8 |
| Specialists per 10,000 Persons Age 65+ (2008) | 163.9 | 117.3 | 132.8 | 92.1 |
| Acute Care Hospital Beds per 10,000 Persons Age 65+ (2008) | 319.4 | 194.3 | 265.6 | 151.5 |
| Prior Use (2007) | Mean | SD | Mean | SD |
| Outpatient ED Visits 2007 | 0.5 | 1.3 | 0.4 | 1.1 |
| Acute Stay Admissions 2007 | 0.4 | 1.0 | 0.5 | 1.1 |
| Medicare Covered SNF Stays 2007 | 0.1 | 0.4 | 0.1 | 0.5 |
| Total Medicare Payment (non-Part D) per Member 2007 | $9,826 | $19,828 | $10,485 | $22,676 |
| Total Medicaid Payment Payments per Member 2007 | $7,271 | $11,462 | $8,557 | $19,744 |
B2. Health Care Utilization and Payment Controlling for Other Characteristics, 2008
Table 7 presents the results of the logistic and OLS regressions of health care utilization and payment with the primary predictor of receiving HUD assistance. Figure 3 presents the OR of health care utilization for beneficiaries receiving HUD assistance estimated from the logistic regression models.
For MMEs age 65 or older residing in study areas other than the NYC/NJ MSA during 2008, the following conclusions may be drawn after adjusting for demographic, clinical, prior health care use, and market characteristics:
-
HUD-assisted MMEs were 4% more likely than unassisted MMEs to have any ED visit but were not more or less likely to have three or more ED visits.
-
HUD-assisted MMEs were 15% less likely than unassisted MMEs in the same areas to have any acute inpatient stay and 20% less likely to have any Medicare covered SNF stay.
-
Among MMEs who had at least one acute inpatient stay, Medicare payments were $807 lower for HUD-assisted MMEs than for unassisted MMEs.
-
The lower acute inpatient stay and Medicare covered SNF utilization, along with the lower payment among those with any acute inpatient stays, contributed to a significantly lower ($523) Medicare payment for HUD-assisted MMEs than for unassisted MMEs.
-
HUD-assisted MMEs who receive full Medicaid benefits for services not included in Medicare had much higher utilization for Medicaid HCBS than did unassisted MMEs. HUD-assisted MMEs were 2.3 times more likely to have any personal care services, 1.7 times more likely to have any use of DME, and 1.7 times more likely to have used other HCBS than unassisted MMEs.
-
This higher Medicaid utilization contributed to a significantly higher ($464) Medicaid total payment for HUD-assisted MMEs relative to unassisted MMEs.
| FIGURE 3. OR of Utilizing any Health Care Service for Beneficiaries Receiving HUD Assistance, HUD-assisted MMEs and Unassisted MMEs Residing in Study Geographic Areas Other than the NYC/NJ MSA, Age 65 or Older, 2008 |
|---|
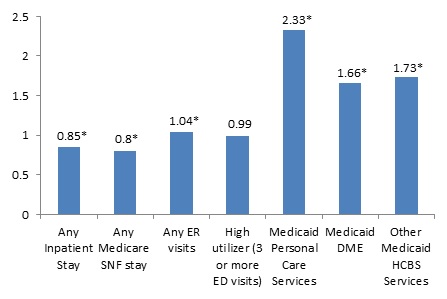 |
| * Indicates statistical significance at the 0.05 level. |
| TABLE 7. OR of Utilizing any Health Care Service and Parameter Estimates of Payment, HUD-assisted MMEs and Unassisted MMEs Residing in Study Geographic Areas Other than the NYC/NJ MSA, Age 65 or Older, 2008 | |||
|---|---|---|---|
| MME, NYC/NJ MSA (N=182,783) Receiving HUD Assistance (ref: unassisted) | |||
| Medicare Utilization | OR | Lower Confidence Limit | Upper Confidence Limit |
| Any Inpatient Stay | 0.85* | 0.82 | 0.87 |
| Any SNF Stay | 0.80* | 0.77 | 0.84 |
| Any ED Visits | 1.04* | 1.01 | 1.06 |
| High Utilizer (3 or more ED visits) | 0.99 | 0.95 | 1.03 |
| Annual Medicare and Medicaid Payments Per Member | OLS Parameter Estimate | ||
| Medicare Payment for Inpatient Acute Stays, among Beneficiaries with at least 1 Inpatient Stay | -$807* | ||
| Medicare Payment (excluding Part D payments) | -$523* | ||
| Utilization and Payment among MMEs who Receive full Medicaid Benefits for Services not included in Medicare (i.e., "full duals") | (N=146,993) | ||
| Medicaid Service Utilization | OR | Lower Confidence Limit | Upper Confidence Limit |
| Personal Care Services | 2.33* | 2.24 | 2.42 |
| DME | 1.66* | 1.62 | 1.70 |
| Other HCBS** | 1.73* | 1.68 | 1.79 |
| Annual Medicid Payments Per Member | OLS Parameter Estimate | ||
| Medicaid Payment | $464* | ||
| Medicare and Medicaid Payment | $149 | ||
| * Indicates statistical significance at the 0.05 level. ** Private duty nursing, adult day care, home health, rehab, targeted case management, transportation, and hospice. | |||
C. Medicare-only Beneficiaries Residing in the NYC/NJ MSA, Age 65 or Older, 2008
C1. Demographic, Clinical, and Prior Utilization Characteristics
Approximately 3% of the 1,245,645 Medicare-only beneficiaries residing in the NYC/NJ MSA in 2008 received HUD assistance. Medicare-only beneficiaries likely have higher incomes, on average, than MMEs. Medicare-only beneficiaries, by definition, are not enrolled in Medicaid. Table 8 displays the descriptive results for the demographic, clinical, and prior utilization characteristics included in the regression models. Medicare-only beneficiaries who received HUD-assistance are compared to Medicare-only beneficiaries without any assistance.
-
As a proxy for income, we compared the proportion of beneficiaries living in an area with an ADI above the 85th percentile. As hypothesized, HUD-assisted Medicare-only beneficiaries were more likely to live in areas with an ADI above the 85th percentile than unassisted Medicare-only beneficiaries. Approximately 22% of HUD-assisted Medicare-only lived in areas with a deprivation index above the 85th percentile, compared with only 4% of unassisted Medicare-only beneficiaries.
-
HUD-assisted Medicare-only beneficiaries had a higher proportion of female beneficiaries than unassisted Medicare-only beneficiaries (71% vs. 58%).
-
HUD-assisted Medicare-only beneficiaries had a higher proportion of Hispanic and Black non-Hispanic beneficiaries than unassisted Medicare-only beneficiaries (14% vs. 4% and 30% vs. 7%, respectively). Unassisted Medicare-only beneficiaries had a higher proportion of White non-Hispanic beneficiaries than did HUD-assisted Medicare-only beneficiaries (85% vs. 54%).
-
HUD-assisted Medicare-only beneficiaries had a greater proportion of beneficiaries age 85 and older than unassisted Medicare-only beneficiaries (23% vs. 18%).
-
HUD-assisted Medicare-only beneficiaries had a larger percentage of beneficiaries who were eligible for Medicare due to a disability than unassisted Medicare-only beneficiaries (15% vs. 7%).
-
HUD-assisted Medicare-only beneficiaries lived in areas where there was a greater supply of acute care hospital beds than unassisted MMEs (344 vs. 288 per 10,000 persons age 65 and over). Market supply of SNF total beds and physicians was similar between the two groups.
| TABLE 8. Demographic, Clinical, and Prior Health Care Utilization, HUD-assisted and Unassisted Medicare-only Beneficiaries Residing in the NYC/NJ MSA, Age 65 or Older, 2008 | ||||
|---|---|---|---|---|
| HUD-assisted Medicare-only Beneficiaries (N=32,216) | Unassisted Medicare-only Beneficiaries (N=1,213,429) | |||
| Gender | N | % | N | % |
| Female | 22,917 | 71.1% | 700,131 | 57.7% |
| Male | 9,299 | 28.9% | 513,298 | 42.3% |
| Race/Ethnicity | N | % | N | % |
| White non-Hispanic | 17,253 | 53.6% | 1,035,889 | 85.4% |
| Black non-Hispanic | 9,802 | 30.4% | 89,637 | 7.4% |
| Hispanic | 4,569 | 14.2% | 53,958 | 4.4% |
| Asian | 364 | 1.1% | 22,256 | 1.8% |
| American Indian | 15 | 0.0% | 274 | 0.0% |
| Other | 213 | 0.7% | 11,415 | 0.9% |
| Age | N | % | N | % |
| Ages 65-69 | 5,695 | 17.7% | 257,790 | 21.2% |
| Ages 70-74 | 6,506 | 20.2% | 272,994 | 22.5% |
| Ages 75-79 | 6,259 | 19.4% | 246,866 | 20.3% |
| Ages 80-84 | 6,349 | 19.7% | 218,341 | 18.0% |
| Ages 85+ | 7,407 | 23.0% | 217,438 | 17.9% |
| Original Reason for Enrollment | N | % | N | % |
| Old Age and Survivor's Insurance | 27,401 | 85.1% | 1,133,178 | 93.4% |
| DIB | 4,747 | 14.7% | 78,828 | 6.5% |
| ESRD | 29 | 0.1% | 798 | 0.1% |
| Disability Insurance and ESRD | 39 | 0.1% | 625 | 0.1% |
| Life Status | N | % | N | % |
| Died in 2008 | 1,325 | 4.1% | 51,286 | 4.2% |
| Disability Status | N | % | N | % |
| Disabled (Medicare Determination) | 4,786 | 14.9% | 79,453 | 6.5% |
| Chronic Condition Prevalence (Means) | Mean | SD | Mean | SD |
| Number of Chronic Conditions | 3.92 | 2.89 | 3.99 | 2.76 |
| Chronic Condition Prevalence | N | % | N | % |
| Depression | 2,636 | 8.2% | 88,588 | 7.3% |
| NF Utilization | N | % | N | % |
| No NF Days | 29,713 | 92.2% | 1,144,221 | 94.3% |
| Under 30 Total NF Days | 1,452 | 4.5% | 40,544 | 3.3% |
| 31-179 Days in NF | 1,043 | 3.2% | 28,471 | 2.3% |
| ADI | N | % | N | % |
| Residing in an Area At or Above the 85th Percentile of ADI | 7,051 | 21.9% | 47,940 | 4.0% |
| Market Supply | Mean | SD | Mean | SD |
| Physicians per 10,000 Persons Age 65+ (2010) | 73.56 | 24.00 | 73.37 | 22.85 |
| SNF Total Beds per 10,000 Persons Age 65+ (2008) | 443.57 | 150.85 | 427.55 | 102.92 |
| Specialists per 10,000 Persons Age 65+ (2008) | 174.88 | 93.65 | 153.79 | 78.82 |
| Acute Care Hospital Beds per 10,000 Persons Age 65+ (2008) | 343.90 | 152.12 | 288.13 | 132.95 |
| Prior Use (2007) | Mean | SD | Mean | SD |
| Outpatient ED Visits 2007 | 0.23 | 0.68 | 0.17 | 0.55 |
| Acute Stay Admissions 2007 | 0.29 | 0.83 | 0.27 | 0.77 |
| Medicare Covered SNF Stays 2007 | 0.04 | 0.27 | 0.04 | 0.26 |
| Total Medicare Payment (non-Part D) per Member 2007 | $7,419 | $16,870 | $7,889 | $17,081 |
| Total Medicaid Payment Payments per Member 2007 | $3,019 | $11,594 | $3,996 | $15,525 |
C2. Health Care Utilization and Payment Controlling for Other Characteristics, 2008
Table 9 presents the results of the logistic and OLS regressions of health care utilization and payment with the primary predictor of receiving HUD assistance. Figure 4 presents the OR of health care utilization for beneficiaries receiving HUD assistance estimated from the logistic regression models.
| TABLE 9. OR of Utilizing any Health Care Service and Parameter Estimates of Payment, HUD-assisted and Unassisted Medicare-only Beneficiaries in the NYC/NJ MSA, Age 65 or Older, 2008 | |||
|---|---|---|---|
| Medicare-only, NYC/NJ MSA (N=1,245,645) Receiving HUD Assistance (ref: unassisted) | |||
| Medicare Service Utilization | OR | Lower Confidence Limit | Upper Confidence Limit |
| Any Inpatient Stay | 1.08* | 1.04 | 1.12 |
| Any SNF stay | 1.20* | 1.14 | 1.27 |
| Any ED visits | 1.21* | 1.17 | 1.25 |
| High utilizer (3 or more ED visits) | 1.34* | 1.26 | 1.42 |
| Annual Medicare Payments Per Member | OLS Parameter Estimate | ||
| Medicare Payment for Inpatient Acute Stays, among Beneficiaries with at least 1 Inpatient Stay | -$340 | ||
| Medicare Payment (excluding Part D payments) | -$164 | ||
| * Indicates statistical significance at the 0.05 level. | |||
After adjusting for differences in demographic,29 clinical, and prior health care use characteristics of the Medicare-only beneficiaries residing in the NYC/NJ MSA in 2008 and characteristics of the markets in which the Medicare-only beneficiaries reside:
-
HUD-assisted Medicare-only beneficiaries had higher utilization. HUD-assisted Medicare-only beneficiaries were 8% more likely to have any inpatient stay, 20% more likely to have any Medicare covered SNF stay, 21% more likely to have any ED visit, and 34% more likely to have three or more ED visits in 2008 than unassisted Medicare-only beneficiaries.
-
Despite the fact that HUD-assisted Medicare-only beneficiaries were more likely to use the key health care services included in our analysis, we found no significant difference in the Medicare FFS payments between the two groups.
| FIGURE 4. OR of Utilizing any Health Care Service, HUD-assisted and Unassisted Medicare-only Beneficiaries in the NYC/NJ MSA, Age 65 or Older, 2008 |
|---|
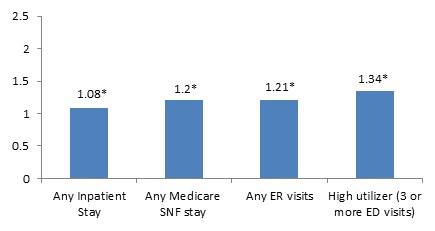 |
| * Indicates statistical significance at the 0.05 level. |
D. Medicare-only Beneficiaries Residing in Study Geographic Areas Other Than the NYC/NJ MSA, Age 65 or Older, 2008
D1. Demographic, Clinical, and Prior Utilization Characteristics
Approximately 2% of the 1,236,916 Medicare-only beneficiaries residing in the study geographic areas other than the NYC/NJ MSA in 2008 received HUD-assistance. Table 10 displays the descriptive results for the demographic, clinical, and prior utilization characteristics included in the regression models. Medicare-only beneficiaries residing in the study geography areas outside of the NYC/NJ MSA in 2008 who received HUD-assistance are compared to beneficiaries in the community without any assistance.
-
HUD-assisted Medicare-only beneficiaries were more likely to live in areas with a deprivation index above the 85th percentile than were unassisted Medicare-only beneficiaries. Approximately 10% of HUD-assisted Medicare-only lived in areas with a deprivation index above the 85th percentile, compared with only 2% of unassisted Medicare-only beneficiaries.
-
HUD-assisted Medicare-only beneficiaries had a higher proportion of female beneficiaries than unassisted Medicare-only beneficiaries (72% vs. 57%).
-
HUD-assisted Medicare-only beneficiaries had a higher proportion of Black non-Hispanic beneficiaries than unassisted Medicare-only beneficiaries (15% vs. 6%). Unassisted Medicare-only beneficiaries had a higher proportion of White, non-Hispanicbeneficiaries than HUD-assisted Medicare-only beneficiaries (90% vs. 80%).
-
HUD-assisted Medicare-only beneficiaries had a greater proportion of beneficiaries age 85 and older than unassisted Medicare-only beneficiaries (27% vs. 17%).
-
HUD-assisted Medicare-only beneficiaries were more likely to have been eligible for Medicare coverage due to a disability than were unassisted Medicare-only beneficiaries (15% vs. 6%).
-
Within our study sample, there was a large difference in the distribution of beneficiaries' residence. Approximately 51% of HUD-assisted Medicare-only beneficiaries lived in the MSA of Boston-Cambridge-Quincy, compared with only 26% of the unassisted Medicare-only beneficiaries.
| TABLE 10. Demographic, Clinical, and Prior Health Care Utilization, HUD-assisted and Unassisted Medicare-only Beneficiaries Residing in Study Geographic Areas Other than the NYC/NJ MSA, Age 65 or Older, 2008 | ||||
|---|---|---|---|---|
| HUD-assisted Medicare-only Beneficiaries (N=24,079) | Unassisted Medicare-only Beneficiaries (N=1,212,837) | |||
| Gender | N | % | N | % |
| Female | 17,283 | 71.8% | 687,562 | 56.7% |
| Male | 6,796 | 28.2% | 525,275 | 43.3% |
| Race/Ethnicity | N | % | N | % |
| White non-Hispanic | 19,219 | 79.8% | 1,087,698 | 89.7% |
| Black non-Hispanic | 3,656 | 15.2% | 69,016 | 5.7% |
| Hispanic | 727 | 3.0% | 22,134 | 1.8% |
| Asian | 331 | 1.4% | 23,820 | 2.0% |
| American Indian | 14 | 0.1% | 423 | 0.0% |
| Other | 132 | 0.5% | 9,746 | 0.8% |
| Age | N | % | N | % |
| Ages 65-69 | 3,628 | 15.1% | 272,507 | 22.5% |
| Ages 70-74 | 4,198 | 17.4% | 280,214 | 23.1% |
| Ages 75-79 | 4,578 | 19.0% | 239,547 | 19.8% |
| Ages 80-84 | 5,080 | 21.1% | 209,502 | 17.3% |
| Ages 85+ | 6,595 | 27.4% | 211,067 | 17.4% |
| Original Reason for Enrollment | N | % | N | % |
| Old Age and Survivor's Insurance | 20,412 | 84.8% | 1,145,713 | 94.5% |
| DIB | 3,637 | 15.1% | 65,900 | 5.4% |
| ESRD | 14 | 0.1% | 703 | 0.1% |
| Disability Insurance and ESRD | 16 | 0.1% | 521 | 0.0% |
| Life Status | N | % | N | % |
| Died in 2008 | 1,150 | 4.8% | 53,073 | 4.4% |
| Disability Status | N | % | N | % |
| Disabled (Medicare determination) | 3,653 | 15.2% | 66,421 | 5.5% |
| MSA | N | % | N | % |
| Vermont | 926 | 3.8% | 58,757 | 4.8% |
| New Haven-Milford | 1,982 | 8.2% | 68,380 | 5.6% |
| Bridgeport-Stamford-Norwalk | 1,431 | 5.9% | 72,071 | 5.9% |
| Milwaukee-Waukesha-West Allis | 1,348 | 5.6% | 110,686 | 9.1% |
| San Francisco-Oakland-Fremont | 1,526 | 6.3% | 169,298 | 14.0% |
| Boston-Cambridge-Quincy | 12,201 | 50.7% | 315,048 | 26.0% |
| Durham-Chapel Hill | 288 | 1.2% | 32,396 | 2.7% |
| Richmond | 398 | 1.7% | 73,286 | 6.0% |
| Columbus | 1,293 | 5.4% | 96,368 | 7.9% |
| Akron | 633 | 2.6% | 49,061 | 4.0% |
| Cleveland | 2,053 | 8.5% | 167,486 | 13.8% |
| Chronic Condition Prevalence (Means) | Mean | SD | Mean | SD |
| Number of Chronic Conditions | 4.17 | 2.77 | 3.65 | 2.59 |
| Chronic Condition Prevalence | N | % | N | % |
| Depression | 3,260 | 13.5% | 115,856 | 9.6% |
| NF Utilization | N | % | N | % |
| No NF Days | 21,542 | 89.5% | 1,134,039 | 93.5% |
| Under 30 Total NF Days | 1,540 | 6.4% | 46,565 | 3.8% |
| 31-179 Days in NF | 987 | 4.1% | 32,027 | 2.6% |
| ADI | N | % | N | % |
| Residing in an Area At or Above the 85th Percentile of ADI | 2,318 | 9.6% | 27,071 | 2.2% |
| Market Supply | Mean | SD | Mean | SD |
| Physicians per 10,000 Persons Age 65+ (2010) | 76.78 | 24.68 | 73.08 | 26.40 |
| SNF Total Beds per 10,000 Persons Age 65+ (2008) | 482.74 | 99.13 | 455.37 | 123.86 |
| Specialists per 10,000 Persons Age 65+ (2008) | 143.44 | 100.60 | 118.96 | 78.14 |
| Acute Care Hospital Beds per 10,000 Persons Age 65+ (2008) | 280.17 | 169.03 | 234.61 | 124.50 |
| Prior Use (2007) | Mean | SD | Mean | SD |
| Outpatient ED Visits 2007 | 0.36 | 0.89 | 0.24 | 0.67 |
| Acute Stay Admissions 2007 | 0.37 | 0.93 | 0.28 | 0.78 |
| Medicare Covered SNF Stays 2007 | 0.09 | 0.39 | 0.06 | 0.32 |
| Total Medicare Payment (non-Part D) per Member 2007 | $7,990 | $16,562 | $6,738 | $15,308 |
| Total Medicaid Payment Payments per Member 2007 | $2,877 | $7,999 | $7,605 | $16,878 |
D3. Health Care Utilization and Payment Controlling for Other Characteristics, 2008
Table 11 presents the results of the logistic and OLS regressions of health care utilization and payment with the primary predictor of receiving HUD assistance. Figure 5 presents the OR of health care utilization for beneficiaries receiving HUD assistance estimated from the logistic regression models.
| TABLE 11. OR of Utilizing any Health Care Service and Parameter Estimates of Payment, HUD-assisted and Unassisted Medicare-only Beneficiaries Residing in Study Geographic Areas Other than the NYC/NJ MSA, Age 65 or Older, 2008 | |||
|---|---|---|---|
| Medicare-only, Outside NYC/NJ MSA (N=1,236,916) Receiving HUD Assistance (ref: unassisted) | |||
| Medicare Utilization | OR | Lower Confidence Limit | Upper Confidence Limit |
| Any Inpatient Stay | 1.09* | 1.04 | 1.14 |
| Any SNF Stay | 1.25* | 1.18 | 1.32 |
| Any ED Visits | 1.15* | 1.11 | 1.19 |
| High Utilizer (3 or more ED visits) | 1.24* | 1.17 | 1.31 |
| Annual Medicare Payments Per Member | OLS Parameter Estimate | ||
| Medicare Payment for Inpatient Acute Stays, among Beneficiaries with at least 1 Inpatient Stay | -$538* | ||
| Medicare Payment (excluding Part D payments) | -$45 | ||
| * Indicates statistical significance at the 0.05 level. | |||
| FIGURE 5. OR of Utilizing any Health Care Service, HUD-assisted and Unassisted Medicare-only Beneficiaries Residing in Study Geographic Areas Other than the NYC/NJ MSA, Age 65 or Older, 2008 |
|---|
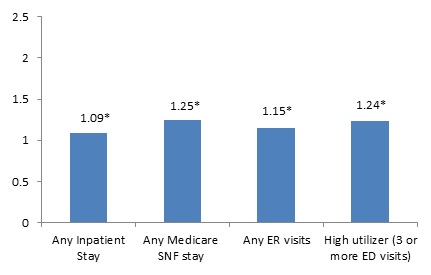 |
| * Indicates statistical significance at the 0.05 level. |
After adjusting for differences in demographic,30 clinical, and prior health care use characteristics of the Medicare-only beneficiaries residing in the study geographic areas other than the NYC/NJ MSA in 2008, and characteristics of the markets in which the Medicare-only beneficiaries reside:
-
Similar to the results among Medicare-only beneficiaries within the NYC/NJ MSA, HUD-assisted Medicare-only beneficiaries had higher utilization than unassisted Medicare-only beneficiaries residing in the remaining study geographic areas. HUD-assisted Medicare-only beneficiaries were 9% more likely to any inpatient stay, 25% more likely to have any Medicare covered SNF stay, 15% more likely to have any ED visit, and 24% more likely to have three or more ED visits in 2008 relative to unassisted Medicare-only beneficiaries.
-
Despite the fact that HUD-assisted Medicare-only beneficiaries were more likely to use the key health care services included in our analysis, there was no significant difference in the Medicare FFS payments between the two groups.
IV. DISCUSSION
To our knowledge, this study was the first attempt to compare health care utilization and payment between HUD-assisted Medicare beneficiaries and unassisted beneficiaries in the community taking into account confounding factors. Knowing that the first report, Picture of Housing and Health, found high prevalence of chronic conditions and higher health care utilization for HUD-assisted Medicare beneficiaries compared with unassisted beneficiaries, we could attribute the higher utilization to the characteristics of the sample. If, in this follow-on analysis, we found that the higher utilization remained after accounting for confounding factors, this would more definitively confirm that HUD-assisted beneficiaries had higher rates of health care utilization even after accounting for observable differences in characteristics compared to unassisted beneficiaries. This information could help inform targeted interventions among specific HUD-assisted subgroups to ensure appropriate use of health care services and to better meet resident needs.
A. Summary of Results
A1. HUD-Assisted Versus Unassisted MMEs, 2008
The differences in demographic and clinical characteristics between HUD-assisted MMEs and unassisted MMEs were as expected across all study geographic areas. HUD-assisted MMEs were more likely to live in areas with an ADI above the 85th percentile, an indicator for socioeconomic disadvantage, than unassisted MMEs. While our sample was limited to beneficiaries age 65 and older, within that sample, the HUD-assisted MMEs were on average younger than unassisted MMEs. HUD-assisted MMEs also had a higher number of chronic conditions, were more likely to qualify for Medicare based on a disability, and were more likely to have depression than unassisted MMEs.
After accounting for differences in demographic, clinical, and prior health care use of the MMEs and characteristics of the markets in which the MMEs reside, we found that HUD-assisted MMEs were less likely than unassisted MMEs to use some health care services and more likely to use others. HUD-assisted MMEs were less likely to have any acute inpatient stay or any Medicare covered SNF stay than unassisted MMEs living in the same geographic areas in both the NYC/NJ MSA and the other study geographic areas. The results controlling for other characteristics for ED use were mixed. HUD-assisted MMEs living in NYC/NJ MSA were less likely to have three or more ED visits than unassisted MMEs in NYC/NJ MSA. However, while HUD-assisted MMEs outside of NYC/NJ MSA were more likely to have at least one ED visit than unassisted MMEs, the likelihood of having three or more ED visits was no different between HUD-assisted and unassisted MMEs living in the remaining geographic areas included in our study.
The total Medicare FFS payments, excluding Part D pharmacy, were significantly lower for HUD-assisted MMEs than for unassisted MMEs ($632 lower among NYC/NJ MSA residents; $523 lower among beneficiaries residing in other geographic areas within the study). The lower likelihood to have any inpatient acute stay or Medicare covered SNF stay, along with a lower average payment for inpatient acute stays, contributed to the lower total Medicare FFS payments.
HUD-assisted MMEs were more likely to use Medicaid covered services, such as community-based supportive services, than were unassisted MMEs living in the same geographic areas in both the NYC/NJ MSA and the other study geographic areas. HUD-assisted MMEs in the NYC/NJ MSA were 2.4 times more likely to use any personal care services, 1.6 times more likely to use any DME covered by Medicaid, and 1.7 times more likely to use other HCBS (i.e., private duty nursing, adult day care, home health, rehabilitation, targeted case management, transportation, and hospice) than unassisted MMEs in the NYC/NJ MSA. HUD-assisted MMEs in the other study geographic areas were 2.3 times more likely to use any personal care services, 1.6 times more likely to use any DME covered by Medicaid, and 1.9 times more likely to use other HCBS than unassisted MMEs in the same geographic areas. This higher likelihood to use services covered by Medicaid contributed to significantly higher Medicaid payments for HUD-assisted MMEs compared to unassisted MMEs. This difference may suggest that MMEs receiving HUD assistance are either more aware of or more in need of Medicaid covered services than are unassisted MMEs in the community. While not formally tested as part of this analysis, these results may also suggest that the use of the Medicaid covered services among HUD-assisted MMEs was associated with lower use of Medicare covered services.
A2. HUD-Assisted Versus Unassisted Medicare-only Beneficiaries, 2008
HUD-assisted Medicare-only beneficiaries differed from unassisted Medicare-only beneficiaries across demographic and clinical characteristics in all the study geographic areas. HUD-assisted Medicare-only beneficiaries were much more likely to live in areas with a deprivation index above the 85th percentile than unassisted Medicare-only beneficiaries. HUD-assisted Medicare-only beneficiaries had a greater proportion of beneficiaries age 85 and older than unassisted Medicare-only beneficiaries. HUD-assisted Medicare-only beneficiaries had a larger percentage of beneficiaries who were eligible for Medicare due to a disability and were more likely to have depression than unassisted Medicare-only beneficiaries.
We compared health care utilization and Medicare FFS payments between HUD-assisted and unassisted Medicare-only beneficiaries accounting for differences in demographic, clinical, and prior health care use characteristics as well as the characteristics of the markets in which they resided. We found that relative to unassisted Medicare-only beneficiaries, HUD-assisted Medicare-only beneficiaries were more likely to have an inpatient stay, a Medicare covered SNF stay, and any ED visit. They were also much more likely to have three or more ED visits (OR = 1.34 for NYC/NJ MSA; OR = 1.24 for study geographic areas other than NYC/NJ MSA). However, despite the higher likelihood of using these costly services, the total Medicare FFS payments for HUD-assisted Medicare-only beneficiaries were not significantly different than the Medicare FFS payments for unassisted Medicare-only beneficiaries in 2008. Furthermore, the Medicare payment associated with the inpatient acute stays was significantly lower for HUD-assisted Medicare-only beneficiaries relative to unassisted Medicare-only beneficiaries. This difference in payment may be due to differences in the types of inpatient stays by the two samples (i.e., unassisted beneficiaries may be admitted for more expensive diagnosis related groups (DRGs) than HUD-assisted beneficiaries). However, the claims data available for analysis under this study did not include sufficient detail that would allow us to compare the DRGs. Without this additional information, it is difficult to conclude much from this finding.
B. Limitations
As with any analysis, this study has limitations. First, we were not able to control for unobservable characteristics. Social determinants of health are highly associated with health care cost and utilization. Despite controlling for geographic location and race/ethnicity, there were many other social determinants of health (e.g., education, social support, access to community resources) not present in our data that may be captured in the indicator for receiving HUD assistance.31 In addition, when comparing HUD-assisted and unassisted Medicare-only beneficiaries, we controlled for ADI as a proxy for income. However, it may not completely control for differences in income across the two samples. Related to differences in socioeconomic status within the Medicare-only sample, it is possible that the unassisted Medicare-only beneficiaries are more likely to have purchased supplemental insurance (i.e., Medigap) in addition to having traditional Medicare coverage. Supplemental insurance is optional and is purchased from a third-party insurer. For a monthly premium, the supplemental insurance covers certain out-of-pocket expenses for health care services. Having supplemental insurance may increase the likelihood of unassisted Medicare beneficiaries utilizing certain health care services given their out-of-pocket responsibility would be less than for someone without the supplemental insurance. Therefore, the higher utilization of health care services by HUD-assisted beneficiaries relative to unassisted beneficiaries could be conservative; if we were able to control for the presence of supplemental insurance, these differences may be even larger.
The Medicare and Medicaid claims available for analysis in this study lack sufficient detail that would have allowed us to examine if the DRG on the inpatient stay could be driving the difference in Medicare payments for the inpatient acute stays among the Medicare-only beneficiary samples. Also, the Medicare and Medicaid payment outcomes are not standardized. Standardized Medicare and Medicaid payments are adjusted to account for differences in payment, such as geography or wage index, as well as the Medicare Disproportionate Share Hospital adjustment provision. Although our comparison group is from the same geographic areas as the HUD-assisted beneficiary sample and we control for geography in our regression models, it is possible that HUD-assisted beneficiaries access different types of providers than unassisted beneficiaries that are not captured in the unstandardized payment outcomes in our study. This could lead to differences, or lack of statistical differences, in the payment outcomes we analyzed. Finally, this analysis was conducted using 2008 HUD and Medicare and Medicaid claims data. It is possible the association between receiving HUD assistance and health care utilization and payment has changed since this time. However, we do not have any reason to assume this is the case.
Finally, the only measure of behavioral/mental health conditions available in our data was a Medicare claim indicating depression. As a result, we were unable to control for numerous behavioral health conditions that could have influenced some of the results.
C. Conclusion
In summary, after taking into account characteristics associated with health care utilization and payment, this study demonstrates that HUD-assisted Medicare beneficiaries do not consistently have higher utilization and payment for health care services than unassisted Medicare beneficiaries. On one hand, HUD-assisted MMEs were generally less likely to use certain Medicare covered services, such as acute inpatient stays and Medicare covered SNF stays, and they had significantly lower Medicare FFS payments than unassisted MMEs. Conversely, HUD-assisted MMEs were much more likely to use Medicaid covered community-based supportive services, such as personal care services, DME, and HCBS and have higher Medicaid FFS payments. This suggests that perhaps HUD-assisted MMEs were more aware of Medicaid covered community-based supportive services than were unassisted MMEs. HUD-assisted Medicare-only beneficiaries were also more likely to have any inpatient stay, Medicare covered SNF stay, and ED visit, but it did not result in significantly higher Medicare FFS payments relative to the unassisted Medicare-only beneficiaries.
While this indicates that HUD-assisted beneficiaries are not consistently using more acute health care services than unassisted beneficiaries after controlling for confounding factors, they still represent a vulnerable group with a high prevalence of chronic conditions and disabilities. The study demonstrates that HUD-assisted MMEs may be a fruitful target group for policy interventions, but that the interventions may vary depending on the type of Medicare beneficiary and the geographic location.
APPENDIX A. DATA SOURCES AND VARIABLE DEFINITIONS
The following table provides a guide to HUD and CMS key concepts and terms.
| Guide to Housing Assistance and Medicare and Medicaid Services |
|---|
| U.S. Department of Housing and Urban Development (HUD) Programs |
| HUD provides housing assistance to about 4.6 million low-income households,1 including families with children, older adults, and people with disabilities. Tenant income eligibility is determined on the basis of AMI (generally calculated for metropolitan areas and non-metropolitan counties), adjusted for family size. Low-income families are defined as families whose incomes do not exceed 80% of the AMI and very low-income families are defined as families whose incomes do not exceed 50% of the AMI. Over three-fourths of assisted households in 2009 had extremely low incomes not exceeding 30% of AMI. HUD programs important for this report include:
|
| Centers for Medicare and Medicaid Services (CMS) Programs |
| Medicare7,8,9 is a federal program that provides health insurance for older adults and people with disabilities. This program was designed for people age 65 and older. This program is typically an entitlement for older adults who:
The spouse of someone who meets these guidelines is also eligible for Medicare. Those under 65 can qualify for a couple of reasons. One of the major reasons is being entitled to Social Security disability benefits for at least 2 years. There are multiple parts to Medicare, including:
Medicaid10,11 is a public health insurance program for low-income children and adults.12 States administer this program following federal rules, and it is jointly financed by both federal and state governments. The federal minimum standards for eligibility are:
Beyond these federal minimums, states can set their own standards for eligibility within the allowed federal range and can opt to cover additional services. For example, all states provide HCBS to older adults through waivers and many states use the upper income limits of 300% of SSI for these services. Medicaid also covers the Medicare premiums and copayments for low-income Medicare beneficiaries through the MSP. Those with income 100% or less of the federal poverty level receive premium and copayment coverage while those with income 101-125% of the federal poverty level receive premium coverage only. Participants who are a part of both programs, MMEs, are often referred to as Dual Eligibles or Duals. In addition, some individuals receive full Medicaid benefits for services not included in Medicare, such as assistance with personal care and long stay NF care. |
NOTES:
|
A. Data Sources
We based the analysis on individual-level administrative data from both HUD and CMS described in detail below.
A1. HUD Individual-level Administrative Data
We received individual-level administrative data from HUD for calendar years 2007, 2008, and 2009. The data originated from two HUD data systems. Given the study objective, we chose geographic areas that have unique public housing with services models.
The data were limited to individuals in our 12 geographic areas of interest:
- New Haven-Milford, Connecticut
- Bridgeport-Stamford-Norwalk, Connecticut
- Milwaukee-Waukesha-West Allis, Wisconsin
- San Francisco-Oakland-Fremont, California
- Boston-Cambridge-Quincy, Massachusetts
- Durham-Chapel Hill, North Carolina
- Richmond, Virginia
- New York-Northern New Jersey-Long Island
- Columbus, Ohio
- Akron, Ohio
- Cleveland, Ohio
- The entire State of Vermont
| TABLE A1. Counties Included in Each of the 12 Study Geographic Areas | ||||
|---|---|---|---|---|
| Metropolitan Statistical Area (CBSA Code) | County | County Census Code | SSA State Code | SSA County Code |
| State of Vermont | 50000 | 47 | 000 | |
| New Haven-Milford (35300) | Connecticut--New Haven County--state FIPS code: 09 | 09009 | 07 | 040 |
| Bridgeport-Stamford-Norwalk (14860) | Connecticut--Fairfield County--state FIPS code: 09 | 09001 | 07 | 000 |
| Milwaukee-Waukesha-West Allis (33340) | Wisconsin--state FIPS code: 55 | 52 | ||
| Milwaukee County | 55079 | 52 | 390 | |
| Ozaukee County | 55089 | 52 | 440 | |
| Washington County | 55131 | 52 | 650 | |
| Waukesha County | 55133 | 52 | 660 | |
| San Francisco-Oakland-Fremont (41860) | California--state FIPS code: 06 | 05 | ||
| Alameda County | 06001 | 05 | 000 | |
| Contra Costa County | 06013 | 05 | 060 | |
| Marin County | 06041 | 05 | 310 | |
| San Francisco County | 06075 | 05 | 480 | |
| San Mateo County | 06081 | 05 | 510 | |
| Boston-Cambridge-Quincy (14460) | Massachusetts--state FIPS code: 25 | |||
| Norfolk County | 25021 | 22 | 130 | |
| Plymouth County | 25023 | 22 | 150 | |
| Suffolk County | 25025 | 22 | 160 | |
| Middlesex County | 25017 | 22 | 090 | |
| Essex County | 25009 | 22 | 040 | |
| New Hampshire--state FIPS code: 33 | ||||
| Rockingham County | 33015 | 30 | 070 | |
| Strafford County | 33017 | 30 | 080 | |
| Durham-Chapel Hill (20500) | North Carolina--state FIPS code: 37 | |||
| Chatham County | 37037 | 34 | 180 | |
| Durham County | 37063 | 34 | 310 | |
| Orange County | 37135 | 34 | 670 | |
| Person County | 37145 | 34 | 720 | |
| Richmond (40060) | Virginia--state FIPS code: 51 | |||
| Amelia County | 51007 | 49 | 030 | |
| Caroline County | 51033 | 49 | 160 | |
| Charles City County | 51036 | 49 | 180 | |
| Chesterfield County | 51041 | 49 | 200 | |
| Cumberland County | 51049 | 49 | 240 | |
| Dinwiddie County | 51053 | 49 | 260 | |
| Goochland County | 51075 | 49 | 370 | |
| Hanover County | 51085 | 49 | 420 | |
| Henrico County | 51087 | 49 | 430 | |
| King and Queen County | 51097 | 49 | 480 | |
| King William County | 51101 | 49 | 500 | |
| Louisa County | 51109 | 49 | 540 | |
| New Kent County | 51127 | 49 | 621 | |
| Powhatan County | 51145 | 49 | 720 | |
| Prince George County | 51149 | 49 | 740 | |
| Sussex County | 51183 | 49 | 910 | |
| New York-Northern New Jersey-Long Island (35620) | New Jersey--state FIPS code: 34 | |||
| Middlesex County | 34023 | 31 | 270 | |
| Monmouth County | 34025 | 31 | 290 | |
| Ocean County | 34029 | 31 | 310 | |
| Somerset County | 34035 | 31 | 350 | |
| Hunterdon County | 34019 | 31 | 250 | |
| Morris County | 34027 | 31 | 300 | |
| Sussex County | 34037 | 31 | 360 | |
| Union County | 34039 | 31 | 370 | |
| Bergen County | 34003 | 31 | 100 | |
| Hudson County | 34017 | 31 | 230 | |
| Passaic County | 34031 | 31 | 320 | |
| Essex County | 34013 | 31 | 200 | |
| New York--state FIPS code: 36 | ||||
| Nassau County | 36059 | 33 | 400 | |
| Suffolk County | 36103 | 33 | 700 | |
| Bronx County | 36005 | 33 | 020 | |
| Kings County | 36047 | 33 | 331 | |
| New York County | 36061 | 33 | 420 | |
| Putnam County | 36079 | 33 | 580 | |
| Queens County | 36081 | 33 | 590 | |
| Richmond County | 36085 | 33 | 610 | |
| Rockland County | 36087 | 33 | 620 | |
| Westchester County | 36119 | 33 | 800 | |
| Pennsylvania--Pike County | 42103 | 39 | 630 | |
| Columbus (18140) | Ohio | |||
| Delaware County | 39041 | 36 | 210 | |
| Fairfield County | 39045 | 36 | 230 | |
| Franklin County | 39049 | 36 | 250 | |
| Licking County | 39089 | 36 | 460 | |
| Madison County | 39097 | 36 | 500 | |
| Morrow County | 39117 | 36 | 600 | |
| Pickaway County | 39129 | 36 | 660 | |
| Union County | 39159 | 36 | 810 | |
| Akron (10420) | Portage County | 39133 | 36 | 680 |
| Summit County | 39153 | 36 | 780 | |
| Cleveland (17460) | Cuyahoga County | 39035 | 36 | 170 |
| Geauga County | 39055 | 36 | 280 | |
| Lake County | 39085 | 36 | 440 | |
| Lorain County | 39093 | 36 | 480 | |
| Medina County | 39103 | 36 | 530 | |
Tenant Rental Assistance Certification System
The Tenant Rental Assistance Certification System (TRACS) system collects certified tenant data from owners and management agents of privately owned multifamily housing projects, as well as from local PHAs, and state housing agencies acting as subsidy contract administrators for HUD. The programs covered in TRACS include: Section 8, Rent supplement, Rental Assistance Payment (RAP), Section 236 (Interest Reduction and RAPs), Section 211 Below-Market Interest Rate mortgage insurance, Section 202 Project Rental Assistance Contract (PRAC), Section 811 PRAC, and Section 202/162 PAC. Note that there are two Section 202 categories. A small number of 202 properties contain units for non-elderly disabled that were funded with rental assistance created by Section 162 of the Housing and Community Development Act of 1987 (P.L. 100-242). Section 162 has been superseded by the Section 811 program, which supports housing for disabled individuals. This program is authorized by Section 811 of the National Affordable Housing Act of 1990 (P.L. 101-625) as amended by the Housing and Community Development Act of 1992 (P.L. 102-550), the Rescission Act (P.L. 104-19) the American Homeownership and Opportunity Act of 2000 (P.L. 106-569), and the Frank Melville Supportive Housing Act of 201032 (P.L. 111-374).
Data contain information on both an individual level (for each individual who resides in the household) and a household level.
Public and Indian Housing (PIH) Information System (PIC)
PHAs collect and electronically submit information to HUD about the households they assist, and the housing assistance that is provided. This study limited its review of housing assistance to the following programs administered by HUD: Section 8 Certificates, Mod Rehab, Public Housing, and Section 8 Vouchers, Multifamily. Data were available for the head of household and each individual that resides in the household.
We combined the TRACS and PIC data into one dataset for our sample. For individuals that appear in both datasets (across all three years this was 38,326 individuals, or 1.54%), we created only one observation per individual based on the PIC data.
A2. CMS Individual-level Administrative Data
We received individual-level administrative data from CMS for both Medicare and Medicaid. This included information on enrollment, eligibility, presence of chronic conditions, health care payments, and health care use for individuals covered by Medicare and/or Medicaid who resided in any of our 12 geographic areas of interest. We received the most recent data available for the data sources: 2007-2009 for Medicare data and 2007 and 2008 for Medicaid data. Note that while we received HUD and CMS Medicare data for 2007-2009, given 2009 data was not available for CMS Medicaid data, our results are based on 2008.
Medicare Administrative Data
We received three segments of the Medicare Beneficiary Summary File for each year of 2007 through 2009. Data contain information on the individual level for any Medicare beneficiary that had coverage at any point in time during the four year period. The three segments included:
-
Parts A, B, and D. This file contains information on the beneficiary's demographic, enrollment and eligibility for Medicare coverage. For example, variables include gender, race, first date of Medicare coverage, date of death if applicable, length of Medicare enrollment, indicatorfor any Medicare managed care coverage, indicator for Part D coverage, and number of months eligible for both Medicare and Medicaid.
-
Chronic Conditions. This file contains flags for 28 chronic conditions based on validated criteria, as defined and identified by CMS. Example conditions include acute myocardial infarction, hypertension, cancers, and Alzheimer's. For each of the 28 conditions, the file includes a year-end flag, mid-year flag, and the first date of occurrence for the condition.
-
Cost and Use. This file includes the total utilization, Medicare payments, and beneficiary payments for the given year by type of health care service for each beneficiary. Examples of health care services include utilization of outpatient ED, acute inpatient hospital, SNF days covered by Medicare, imaging, and DME.
Medicaid Administrative Data
We received the Medicaid Analytic eXtract (MAX) Person Summary file for 2007 and 2008. The Person Summary file contains demographic characteristics, Medicaid enrollment, payment, and utilization variables for each beneficiary that had Medicaid coverage at any point in time during the calendar year.
B. Variable Definitions
B1. Medicare Beneficiary Demographic and Coverage Characteristics
The variables below were based on information in the Medicare Beneficiary Summary File. Each variable was created for all Medicare beneficiaries in the 12 geographic areas of interest.
-
Age. Age at end of year. Age groups were also created as followed: under age 65 (62, 62-64); 65+ (65-74, 75-84, 85+).
-
Gender. Values included unknown, female, and male.
-
Race. Research Triangle Institute Race Code which is based on enhanced race/ethnicity designation based on first and last name algorithms. Categories include: unknown, non-Hispanic White, Black, other, Asian/Pacific Islander, Hispanic, American Indian/Alaska Native.
-
Died. Each beneficiary was assigned a Y/N flag based on the beneficiary date of death variable. If date of death = mmddyyyy, then Died = Y(1). If date of death is missing, then Died = N(0).
-
Part A Coverage Indicator. Part A coverage was assigned as a Y/N variable using the Beneficiary Health Insurance Coverage Months variable. If the beneficiary had a minimum of one month of Part A coverage, Part A Coverage indicator = Y(1), else = N(0). Medicare Part A includes inpatient services coverage, such as hospital care, SNF care, nursing home care (with exceptions), hospice, and home health services. The costs covered for these services depend on a number of factors.
-
Part B Coverage Indicator. Part B coverage was assigned as a Y/N variable using the Beneficiary Serious Mental Illness Coverage Months variable. If the beneficiary had a minimum of one month of Part B coverage, Part B Coverage indicator = Y(1), else = N(0). Medicare Part B covers outpatient services, such as doctor's visits. The services covered by Part B are medically necessary services (i.e., those needed to diagnosis or treat a medical condition) or preventive services (e.g., a flu shot).33
-
Month Count with Part A Coverage. The count of months when the beneficiary had Medicare Part A coverage. Values ranged from 0 to 12.
-
Month Count with Part B Coverage. The count of months when the beneficiary had Medicare Part B coverage. Values ranged from 0 to 12.
-
Annual Part A and B Enrollment. Beneficiaries were identified as being enrolled in both Part and B for the entire year if the month count with Part A coverage = 12 and month count with Part B coverage = 12.
-
Medicare HMO/Managed Care Indicator. The Medicare HMO/Managed Care indicator was assigned as a Y/N variable using the HMO coverage total months variable. If the beneficiary had a minimum of one month of HMO coverage, HMO/Managed Care Coverage indicator = Y(1), else = N(0). Medicare HMOs, or Managed Care, are plans that incorporate Medicare Parts A and B; these are called Medicare Part C, or Medicare Advantage plans. In these plans, a private Medicare-approved company provides oversight of a beneficiary's health care utilization.
-
Month Count with HMO/Managed Care Coverage. The count of months when the beneficiary had Medicare HMO/Managed Care coverage. Values ranged from 0 to 12.
-
Original Reason for Medicare Entitlement. Reason why the beneficiary was initially entitled to Medicare coverage. Values include: 0 = Old age and survivors insurance; 1 = Disability insurance benefits (DIB); 2 = End Stage Renal Disease (ESRD); and 3 = Both DIB and ESRD.
-
Current Reason for Medicare Entitlement. Reason why the beneficiary was currently entitled to Medicare coverage during reference year. Values include: 0 = Old age and survivors insurance; 1 = Disability insurance benefits (DIB); 2 = End Stage Renal Disease (ESRD); and 3 = Both DIB and ESRD.
-
Medicare Coverage Status. Medicare coverage status was assigned based on the monthly buy-in indicators which specify if the beneficiary had Part A and/or Part B coverage by month. Medicare coverage status values were based on the following mapping:
- If no buy-in monthly flags = (1,2,3,A,B,C) then beneficiary was assigned to 1 = Not Entitled;
- If all buy-in monthly flags = (1 or A) then beneficiary was assigned to 2 = Part A coverage only category;
- If all buy-in monthly flags = (2 or B) then beneficiary was assigned to 3 = Part B coverage only category;
- If all buy-in monthly flags = (3 or AB) then beneficiary was assigned to 4 = Part A and B coverage only category;
- If enrollee has any other combination of buy-in monthly flags they were assigned to the 5 = Combination coverage category.
-
Part D Coverage Indicator. Part D coverage was assigned as a Y/N variable using the Plan D coverage monthsvariable. If the beneficiary had a minimum of one month of Part D coverage, Part D Coverage indicator = Y(1), else = N(0). Medicare Part D is prescription drug coverage. This is optional coverage that Medicare beneficiaries can purchase through private plans.34 Having Part D coverage adds more drug coverage to Medicare Part A and B plans, in addition to some other Medicare plans.
-
MME Status. MME Status was assigned to one of the following categories based on the variable 'EL_MDCR_DUAL_ANN'. Categories included: 00 (or NA), 99 (or unknown), 01 (QMB only), 02 (QMB Plus), 03 (SLMB only), 04 (SLMB plus), or 05 (Other MME status). These categories include the array of categories for MMEs, meaning that someone eligible for both Medicare and Medicaid may fall under some of these categories.35
-
Any MME Status. A binary Y/N variable based on DUAL_MO count. If DUAL_MO count not equal to 0, MME Status = Y; else N.
-
Number of Months with Dual (Medicare and Medicaid) Coverage. Equal to the number of months within the DUAL_MO variable.
B2. Medicaid Coverage Characteristics
The variables below were based on information in the Medicaid person summary file. Each variable was created by year for all Medicaid beneficiaries in the 12 geographic areas of interest.
-
Medicaid HMO/Managed Care Indicator. The Medicaid HMO/Managed Care indicator was assigned as a Y/N variable using the private insurance month count variable. If the beneficiary had a minimum of 1 month of private insurance, Medicaid HMO/Managed Care Coverage indicator = Y(1), else = N(0).
B3. Chronic Conditions
The Chronic Condition Warehouse (CCW) flags, as defined by CMS, were used to identify individuals with Medicare coverage who had any of the 27 chronic conditions. A binary variable (Y/N) was created for each of the 28 CCW conditions using the "end-of-year" flags. Individuals with an "end-of-year" value = 1 ("claims met") or 3 ("claims and coverage met") for a condition were assigned a "Y" for the given CCW condition. A summary variable was created which summed up the flags across 26 of the 27 conditions (excluding Alzheimer's chronic condition to not double count with Alzheimer's and related conditions flag) for a given individual (e.g., an individual with three CCW condition "end-of-year" flags would be assigned a three for the given calendar year).
We grouped the 27 chronic conditions into nine categories, shown in Table A2 below.
| TABLE A2. Assignment of Chronic Conditions into 9 Chronic Condition Groups | |
|---|---|
| Chronic Condition Group | Chronic Conditions |
| 1. Cardiovascular Chronic Conditions |
|
| 2. Cancer |
|
| 3. Endocrine & Renal |
|
| 4. Alzheimer's Disease |
|
| 5. Depression |
|
| 6. Musculoskeletal |
|
| 7. Pulmonary |
|
| 8. Ophthalmic |
|
| 9. Other |
|
B4. Health Care Utilization and Payment
Health care utilization metrics were generally defined as available in the Medicare Beneficiary Summary File and Medicaid Person Summary File. In a few instances, we combined existing metrics to create a summation of related services. For MMEs, we created the following three variables using the Medicaid Person Summary data for 2008 to capture the use of Medicaid-covered services among this subset of our study sample. These services help Medicaid beneficiaries stay in their communities and are implemented by states.
Table A3 below includes the utilization metrics created in our dataset and the corresponding variable or data-based logic.
| TABLE A3. Medicare Health Care Utilization Variable Definitions | ||
|---|---|---|
| Utilization Metric | Variable as Named in Medicare Data or Algorithm using Medicare Data Variables | Variable Definitionsa |
| Medicare Outcomes | ||
| Acute Stay Admissions | ACUTE_STAYS | Count of hospital stays (unique admissions, which may span more than 1 facility) in the acute inpatient setting for a given year. An acute stay is defined as a set of 1 or more consecutive acute claims where the beneficiary is only discharged on the most recent claim in the set. Acute care settings include a hospital, ED, and short-stay facilities for shorter-term treatment. |
| Medicare Covered SNF Stays | SNF_STAYS | Count of Medicare covered SNF setting stays (unique admissions, which may span more than 1 facility) for a given year. A SNF stay is defined as a set of 1 or more consecutive SNF claims where the beneficiary is only discharged on the most recent claim in the set. |
| ED Visits without an Admission | HOP_ER_VISITS | Count of unique ED revenue center dates (as a proxy for an ED visit) in the hospital outpatient data file for a given year. |
| Annual Medicare FFS Payments for Inpatient Acute Stays | ACUTE_MDCR_PMT | The total Medicare payments for the year in an acute inpatient setting. The total Medicare payments are calculated as the sum of the CLM_PMT_AMT for all acute inpatient claims where the CLM_PMT_AMT >= 0.b |
| Annual Medicare FFS Payments, excluding Part D | Sum of all Medicare payments for Medical services on the Cost and Use file (e.g., "SNF_MDCR_PMT"). Sum does not include Part D or payments for long-term care services. | The total Medicare payments for the year, summed across settings. The total Medicare payments are calculated as the sum of the CLM_PMT_AMT for all claims where the CLM_PMT_AMT >= 0.b |
| Medicaid Outcomes | ||
| Medicaid Personal Care Services | FFS_CLM_CNT when TOS = 30. | Any claims (FFS_CLM_CNT) when TOS represented personal care services (TOS = 30). |
| Medicaid DME | FFS_CLM_CNT when TOS = 51. | Any claims (FFS_CLM_CNT) when TOS represented DME, (TOS = 51). |
| Other Medicaid HCBS | FFS_CLM_CNT when TOS = 13, 31, 33, 35, 26, 38, or 54. | Any claims (FFS_CLM_CNT) when TOS represented 1 of the following: private duty nursing, adult day care, home health, rehab, targeted case management, transportation, and hospice. (TOS = 13, 31, 33, 35, 26, 38, 54). |
| Medicaid FFS Spending | TOT_MDCD_PYMT_AMT | Total FFS payments paid by Medicaid FFS spending variable from the Medicaid person summary file (TOT_MDCD_PYMT_AMT). |
NOTE:
| ||
Table A4 describes how we defined our final outcome variables using the Medicare and Medicaid data elements described in Table A3 above. Most of the variables were created by converting continuous variables into binary outcomes which allowed us to look at the association between receiving HUD assistance and using any of these services.
| TABLE A4. Dependent Outcome Definitions and Model Specifications | ||
|---|---|---|
| Outcome | Definition | Model Specification |
| Medicare Outcomes | ||
| Any Acute Inpatient Stay | 1 if any acute inpatient stays in 2008/0 if no acute inpatient stays | logistic |
| Any Medicare Covered SNF Admission | 1 for anyone with a Medicare covered SNF stay of N>30 days; else 0. This includes only Medicare covered SNF stays. | logistic |
| Any ED Visits without Hospitalization | 1 if any ED visit without hospitalization in 2008/0 if no ED visit without hospitalization | logistic |
| Being a High Utilizer | 1 if individual had above the 90% percentile of ED outpatient visits (N>3); else 0. | logistic |
| Annual Medicare Acute Inpatient Stay Payments | Medicare payments, acute inpatient stays, 2008 | two-part model: logistic on all observations; OLS on positive only |
| Annual Medicare Payments (pharmacy excluded) | Medicare payments, 2008 | OLS |
| Medicaid Outcomes (limited to MMEs with full eligibility for Medicaid) | ||
| Any Personal Care Services | 1 if any use of Medicaid-covered personal care services/0 if no use of personal care services in 2008 | logistic |
| Any DME | 1 if any use of Medicaid-covered DME/0 if no use of DME in 2008 | logistic |
| Any Other HCBS (private duty nursing, adult day care, home health, rehab, targeted case management, transportation, and hospice) | 1 if any use of Medicaid-covered HCBS/0 if no use of HCBS in 2008 | logistic |
| Annual Medicaid Payments | Medicaid payments per Medicare-Medicaid beneficiary | OLS |
| Annual Medicare + Medicaid Payments (Medicare pharmacy excluded) | Medicare and Medicaid total payments per Medicare-Medicaid beneficiary | OLS |
APPENDIX B. UNADJUSTED RESULTS
This Appendix includes the unadjusted results for each of the four subgroups.
A. Subgroup A: Medicare-Medicaid Enrollees Residing in the NYC/NJ MSA
Table B1 presents a comparison of unadjusted health care utilization and payments among HUD-assisted and unassisted MMEs residing in the NYC/NJ MSA in 2008.
-
HUD-assisted MMEs had slightly lower spending on acute inpatient hospital stays than unassisted MMEs ($7,145 vs. $7,560) and higher total Medicare FFS payments ($16,137 vs. $15,470).
-
HUD-assisted MMEs were less likely to have an acute inpatient admission and a Medicare covered SNF stay but more likely to have an ED visit and three or more ED visits than unassisted MMEs.
-
Among those who were fully eligible for Medicaid-covered services, a higher proportion of HUD-assisted MMEs used Medicaid-covered services, such as personal care services (35% vs. 17%), DME (55% vs. 38%), and other HCBS (58% vs. 42%) than unassisted MMEs.
-
Among those who receive full Medicaid benefits for services not included in Medicare,36 HUD-assisted MMEs had higher Medicaid FFS payments per member ($18,974 vs. $14,288).
| TABLE B1. Unadjusted Health Care Utilization and Payment, HUD-assisted MMEs and Unassisted MMEs Residing in the NYC/NJ MSA, Age 65 or Older, 2008 | ||||
|---|---|---|---|---|
| HUD-assisted MMEs (N=77,716) | Unassisted MMEs (N=158,445) | |||
| Medicare Service Utilization | N | % | N | % |
| Any Inpatient Stay | 22,298 | 28.7% | 46,757 | 29.5% |
| Any Medicare Covered SNF Stay | 4,796 | 6.2% | 13,609 | 8.6% |
| Any ED Visit | 28,942 | 37.2% | 57,066 | 36.0% |
| 3 or More ED Visits (High Utilizer) | 7,154 | 9.2% | 13,172 | 8.3% |
| Medicare Payments Per Member Per Year | Mean | SD | Mean | SD |
| Acute Stay Admission Payments per Member per Year | $7,145 | $20,168 | $7,560 | $21,543 |
| Total Medicare Payment (non-Part D) Payments per Member per Year | $16,137 | $29,021 | $15,470 | $30,586 |
| Utilization and Payment among MMEs who Receive full Medicaid Benefits for Services not included in Medicare (i.e., full duals) | HUD-Assisted MMEs, Fully Eligible for Medicaid (N=73,590) | Unassisted MMEs, Fully Eligible for Medicaid (N=146,289) | ||
| Medicaid Service Utilization | N | % | N | % |
| Any Personal Care Services | 25,858 | 35.1% | 25,315 | 17.3% |
| Any DME | 40,399 | 54.9% | 56,151 | 38.4% |
| Any Other HCBS* | 42,507 | 57.8% | 60,813 | 41.6% |
| Medicare and Medicaid Payments Per Member Per Year | Mean | SD | Mean | SD |
| Total Medicaid FFS Payment Payments per Member per Year | $18,974 | $28,404 | $14,288 | $27,542 |
| Total Medicare + Medicaid Payment Payments per Member per Year | $34,142 | $ 44,713 | $28,736 | $44,943 |
| *Private duty nursing, adult day care, home health, rehab, targeted case management, transportation, and hospice. | ||||
B. Subgroup B: Medicare-Medicaid Enrollees Residing in Study Geographic Areas Outside the NYC/NJ MSA
Table B2 presents a comparison of unadjusted health care utilization and payment among HUD-assisted and unassisted MMEs residing in the study geography areas outside of the NYC/NJ MSA in 2008.
-
HUD-assisted MMEs were more likely to have a Medicare covered SNF stay (9% vs. 6%) and less likely to have an acute inpatient stay (26% vs. 28%) than unassisted MMEs.
-
HUD-assisted MMEs had lower Medicare FFS spending on acute inpatient stays ($4,751 vs. $5,208) and total Medicare FFS spending ($12,094 vs. $12,297) than unassisted MMEs.
-
Among those who were fully eligible for Medicaid-covered services, a higher proportion of HUD-assisted MMEs used Medicaid-covered services such as personal care services (27% vs. 16%), DME (55% vs. 38%), and other HCBS (33% vs. 24%) than unassisted MMEs.
-
Among those who receive full Medicaid benefits for services not included in Medicare, HUD-assisted MMEs had higher Medicaid FFS payments per member ($8,328 vs. $7,773).
| TABLE B2. Unadjusted Health Care Utilization and Payment, HUD-assisted MMEs and Unassisted MMEs Residing in Study Geographic Areas Outside the NYC/NJ MSA, Age 65 or Older, 2008 | ||||
|---|---|---|---|---|
| HUD-assisted MMEs (N=55,139) | Unassisted MMEs (N=127,644) | |||
| Medicare Service Utilization | N | % | N | % |
| Any Inpatient Stay | 14,157 | 25.7% | 35,242 | 27.6% |
| Any Medicare Covered SNF Stay | 2,272 | 9.4% | 67,652 | 5.6% |
| Any ED Visit | 22,917 | 41.6% | 52,057 | 40.8% |
| 3 or More ED Visits (High Utilizer) | 6,404 | 11.6% | 13,923 | 10.9% |
| Medicare Payments Per Member | Mean | SD | Mean | SD |
| Acute Stay Admission Payments per Member | $4,751 | $14,421 | $5,208 | $15,989 |
| Total Medicare Payment (non-Part D) Payments per Member | $12,094 | $24,116 | $12,297 | $26,374 |
| Utilization and Payment among MMEs Fully Eligible for Medicaid-services | HUD-Assisted MMEs, Fully Eligible for Medicaid (N=47,547) | Unassisted MMEs,F ully Eligible for Medicaid (N=99,446) | ||
| Medicaid Service Utilization | N | % | N | % |
| Personal Care Services | 12,661 | 26.6% | 16,039 | 16.1% |
| DME | 26,060 | 54.8% | 37,843 | 38.1% |
| Other HCBS* | 15,828 | 33.3% | 23,767 | 23.9% |
| Medicare and Medicaid Payments Per Member | Mean | SD | Mean | SD |
| Total Medicaid FFS Payment Payments per Member | $8,328 | $12,731 | $7,773 | $18,471 |
| Total Medicare + Medicaid Payment Payments per Member | $19,402 | $30,284 | $18,556 | $35,277 |
| *Private duty nursing, adult day care, home health, rehab, targeted case management, transportation, and hospice. | ||||
C. Subgroup C: Medicare-only Beneficiaries Residing in the NYC/NJ MSA
Table B3 presents a comparison of unadjusted health care utilization and payments among HUD-assisted and unassisted Medicare-only beneficiaries residing in the NYC/NJ MSA in 2008.
-
Relative to unassisted Medicare-only beneficiaries, HUD-assisted Medicare-only beneficiaries were more likely to have an inpatient stay (23% vs. 20%), a Medicare covered SNF stay (7% vs. 5%), any ED visit (32% vs. 25%), and three or more ED visits (7% vs. 4%).
-
The higher utilization contributed to higher Medicare FFS payments for HUD-assisted Medicare-only beneficiaries compared with unassisted Medicare-only beneficiaries ($10,406 vs. $9,405).
| TABLE B3. Unadjusted Health Care Utilization and Payment, HUD-assisted and Unassisted Medicare-only Beneficiaries Residing in the NYC/NJ MSA, Age 65 or Older, 2008 | ||||
|---|---|---|---|---|
| HUD-assisted Medicare-only Beneficiaries (N=32,216) | Unassisted Medicare-only Beneficiaries (N=1,213,429) | |||
| Medicare Service Utilization | N | % | N | % |
| Any Inpatient Stay | 7,457 | 23.1% | 237,513 | 19.6% |
| Any Medicare Covered SNF Stay | 2,261 | 7.0% | 60,746 | 5.0% |
| Any ED Visit | 10,425 | 32.4% | 302,604 | 24.9% |
| 3 or More ED Visits (High Utilizer) | 2,113 | 6.6% | 47,260 | 3.9% |
| Medicare and Medicaid Payments Per Member | Mean | SD | Mean | SD |
| Acute Stay Admission Payments per Member | $4,418 | $13,867 | $3,739 | $13,113 |
| Total Medicare Payment (non-Part D) | $10,406 | $22,199 | $9,405 | $20,702 |
D. Subgroup D: Medicare-only Beneficiaries Residing in Study Geographic Areas Outside the NYC/NJ MSA
Table B4 presents a comparison of unadjusted health care utilization and payments among HUD-assisted and unassisted Medicare-only beneficiaries residing in the study geography areas outside of the NYC/NJ MSA in 2008.
-
Relative to unassisted Medicare-only beneficiaries, HUD-assisted Medicare-only beneficiaries were more likely to have an inpatient stay (25% vs. 20%), a Medicare covered SNF stay (9% vs. 6%), any ED visit (39% vs. 29%), and three or more ED visits (9% vs. 5%).
-
The higher utilization contributed to higher Medicare FFS payments for HUD-assisted Medicare-only beneficiaries compared with unassisted Medicare-only beneficiaries ($10,020 vs. $7,940).
| TABLE B4. Unadjusted Health Care Utilization and Payment, HUD-assisted and Unassisted Medicare-only Beneficiaries Residing in Study Geographic Areas Other than the NYC/NJ MSA, Age 65 or Older, 2008 | ||||
|---|---|---|---|---|
| HUD-assisted Medicare-only Beneficiaries (N=24,079) | Unassisted Medicare-only Beneficiaries (N=1,212,837) | |||
| Medicare Service Utilization | N | % | N | % |
| Any Inpatient Stay | 6,108 | 25.4% | 236,374 | 19.5% |
| Any Medicare Covered SNF Stay | 2,272 | 9.4% | 67,652 | 5.6% |
| Any ED Visit | 9,387 | 39.0% | 345,959 | 28.5% |
| 3 or More ED Visits (High Utilizer) | 2,172 | 9.0% | 60,631 | 5.0% |
| Medicare Payments Per Member | Mean | SD | Mean | SD |
| Acute Stay Admission Payments per Member | $3,905 | $11,248 | $3,052 | $10,495 |
| Total Medicare Payment (non-Part D) Payments per Member | $10,020 | $20,050 | $7,940 | $18,037 |
NOTES
-
The Lewin Group. (2014). Picture of Housing and Health: Medicare and Medicaid Use Among Older Adults in HUD-Assisted Housing. Prepared for the U.S. Department of Health and Human Services, Office of the Assistant Secretary for Planning and Evaluation. Available online at: https://aspe.hhs.gov/basic-report/picture-housing-and-health-medicare-and-medicaid-use-among-older-adults-hud-assisted-housing.
-
Kaiser Family Foundation. (2012). Medicare's Role for Dual Eligible Beneficiaries. Issue Brief by Gretchen Jacobson, Tricia Neuman, and Anthony Damico.
-
See main report for a complete description on the rationale for the four subgroups.
-
See complete report for a complete listing of confounders.
-
The Lewin Group. (2014). Picture of Housing and Health: Medicare and Medicaid Use Among Older Adults in HUD-Assisted Housing. Prepared for the U.S. Department of Health and Human Services, Office of the Assistant Secretary for Planning and Evaluation. Available online at: https://aspe.hhs.gov/basic-report/picture-housing-and-health-medicare-and-medicaid-use-among-older-adults-hud-assisted-housing.
-
U.S. Department of Housing and Urban Development.(2013). Worst Case Housing Needs 2011: Report to Congress. Washington, DC. Available at: http://www.huduser.org/portal/publications/affhsg/wc_HsgNeeds11_report.html.
-
Picture of Subsidized Households. (2015).
-
Summit on Aging in Place in Public Housing. (2011). Hosted by Enterprise Community Partners, Inc., LeadingAge. Supported by The Atlantic Philanthropies.
-
Gibler, K. (2003). Aging Subsidized Housing Residents: A Growing Problem in U.S. Cities. Journal of Real Estate Research, 25(4): 395-420.
-
Alecxih, L., Shen, S., Chan, I., and Drabek, J. (2010) Individuals Living in the Community with Chronic Conditions and Functional Limitations: A Closer Look. Prepared for the U.S. Department of Health and Human Services, Office of the Assistant Secretary for Planning and Evaluation. Available online at: https://aspe.hhs.gov/basic-report/individuals-living-community-chronic-conditions-and-functional-limitations-closer-look.
-
The Lewin Group. (2014). Picture of Housing and Health: Medicare and Medicaid Use Among Older Adults in HUD-Assisted Housing. Prepared for the U.S. Department of Health and Human Services, Office of the Assistant Secretary for Planning and Evaluation. Available online at: https://aspe.hhs.gov/basic-report/picture-housing-and-health-medicare-and-medicaid-use-among-older-adults-hud-assisted-housing.
-
Kaiser Family Foundation. (2012). Medicare's Role for Dual Eligible Beneficiaries. Issue Brief by Gretchen Jacobson, Tricia Neuman, and Anthony Damico.
-
Gassoumis, Z.D., Fike, K.T., Rahman, A.N., Enguidanos, S.M., Wilber, K.H. (2013). Who Transitions to the Community from Nursing Homes? Comparing Patterns and Predictors for Short-Stay and Long-Stay Residents. Home Health Care Services Quarterly, 32: 75-91.
-
We stratified the sample into MMEs and Medicare-only beneficiaries (i.e., not enrolled in Medicaid).
-
Based on number of days in a Nursing Home, including Medicare covered SNF days, based on the 2008 Medicare Timeline file, which identifies the Medicare beneficiaries' location for each day of the year, regardless of payer.
-
Gassoumis, Z.D., Fike, K.T., Rahman, A.N., Enguidanos, S.M., Wilber, K.H. (2013). Who Transitions to the Community from Nursing Homes? Comparing Patterns and Predictors for Short-Stay and Long-Stay Residents. Home Health Care Services Quarterly, 32: 75-91.
-
We included individuals who died in 2008. Given this study would be used to help inform targeted interventions among HUD-assisted individuals, we wanted to include as many of the sample as possible.
-
Kaiser Family Foundation. (2012). Medicare's Role for Dual Eligible Beneficiaries. Issue Brief by Gretchen Jacobson, Tricia Neuman, and Anthony Damico.
-
Not enrolled in Medicaid.
-
Skinner, J. (2012). Causes and Consequences of Regional Variations in Health Care. Chapter in Handbook of Health Economics (Vol. 2).
-
We only have pharmacy payments for individuals who are enrolled in Medicare Part D. In order to not have to reduce our sample to those with Part D coverage, we excluded pharmacy from these outcomes.
-
Medicaid covers the Medicare premiums and copayments for low-income Medicare beneficiaries through the Medicare Savings Program (MSP). Those with income 100% or less of the federal poverty level receive premium and copayment coverage while those with income 101-125% of the federal poverty level receive premium coverage only. In addition, some individuals receive full Medicaid benefits for services not included in Medicare, such as assistance with personal care and long stay NF care. MMEs refers to participants who are a part of both programs. Therefore, to appropriately look at the use of Medicaid-covered services, we limited our MME study sample to those beneficiaries who receive full Medicaid benefits.
-
The binary utilization outcome for any acute inpatient stay is equivalent to presenting the results from Part 1 of the two-part model for acute inpatient stay Medicare payments. Therefore, in the results section, we do not present the OR from Part 1 of the two-part Model and only display the parameter estimate from Part 2 of the model.
-
Sutherland, J.M., Fisher, E.S., and Skinner, J.S. (2009).Getting Past Denial--The High Cost of Health Care in the United States. New England Journal of Medicine, 361(13): 1227-1230.
-
Kind, A., Jencks, S., Brock, J., Yu, M., Bartels, C., Ehlenbach, W., Greenberg, C., and Smith, M. (2014). Neighborhood Socioeconomic Disadvantage and 30-Day Rehospitalization: A Retrospective Cohort Study. Ann Intern Med, 161(11): 765-774.
-
This includes Medicare covered SNF stays.
-
Variables created from the Area Health Resource File 2008.
-
The comparison of unadjusted health care cost and utilization outcomes can be located in Appendix B.
-
We do not have income data available for the unassisted beneficiaries. Therefore, as a proxy for income, we included a binary indicator in the model that identified whether the beneficiary lived in an area with a deprivation index above the 85th percentile.
-
We do not have income data available for the unassisted beneficiaries. Therefore, as a proxy for income, we included a binary indicator in the model that identified whether the beneficiary lived in an area with a deprivation index above the 85th percentile.
-
Healthy People 2020. Social Determinants of Health. Available at: http://www.healthypeople.gov/2020/topics-objectives/topic/social-determinants-health. Accessed August 12, 2015.
-
See http://www.gpo.gov/fdsys/pkg/BILLS-111s1481enr/pdf/BILLS-111s1481enr.pdf.
-
See http://www.medicare.gov/what-medicare-covers/part-b/what-medicare-part-b-covers.html.
-
See https://www.ccwdata.org/cs/groups/public/documents/document/ccw_partddata_userguide.pdf.
-
See http://www.cms.gov/Research-Statistics-Data-and-Systems/Statistics-Trends-and-Reports/MedicareEnrpts/Downloads/Buy-InDefinitions.pdf.
-
Medicaid covers the Medicare premiums and copayments for low-income Medicare beneficiaries through the MSP. Those with income 100% or less of the federal poverty level receive premium and copayment coverage while those with income 101-125% of the federal poverty level receive premium coverage only. In addition, some individuals receive full Medicaid benefits for services not included in Medicare, such as assistance with personal care and long stay NF care. MMEs refers to participants who are a part of both programs. Therefore, to appropriately look at the use of Medicaid-covered services, we limited our MME study sample to those beneficiaries who receive full Medicaid benefits.
This report was prepared under contract #HHSP23320100018WI between the U.S. Department of Health and Human Services (HHS), Office of Disability, Aging and Long-Term Care Policy (DALTCP) and the Lewin Group. For additional information about this subject, you can visit the DALTCP home page at http://aspe.hhs.gov/office-disability-aging-and-long-term-care-policy-daltcp or contact the ASPE Project Officer, Emily Rosenoff, at HHS/ASPE/DALTCP, Room 424E, H.H. Humphrey Building, 200 Independence Avenue, S.W., Washington, D.C. 20201. Her e-mail addresses is: Emily.Rosenoff@hhs.gov.